Band Population Measurements
in a
Purely Optical Dark Lattice
Abstract
We create a dark optical lattice structure using a blue detuned laser field coupling an atomic ground state of total angular momentum simultaneously to two excited states with angular momenta and , or and . The atoms are trapped at locations of purely circular polarization. The cooling process efficiently accumulates almost half of the atomic population in the lowest energy band which is only weakly coupled to the light field. The populations of the two lowest energy bands reaches 70%. Kinetic energies on the order of the recoil energy are obtained by adiabatically reducing the optical potential. The band populations are directly mapped on free particle momentum intervals by this adiabatic release. In an experiment with subrecoil momentum resolution we measure the band populations and find good absolute agreement with the theoretically calculated steady state band populations.
laser cooling and trapping, atomic physics in general
I Introduction
Optical lattices present a unique quantum-mechanical system for the study of matter waves interacting with a perfectly periodic potential. The periodic potential is formed by the light shift that an atom experiences in a near-resonant standing wave. The atoms can be cooled to the minima of the optical potential forming a periodic array of microscopic traps[2]. It is a fascinating question whether atom-atom-interactions [3] and quantum statistical effects, similar to those observed in magnetic traps[4], can be studied in optical lattices when two or more atoms occupy a single lattice site. This requires a technique for achieving much higher atomic densities than possible in optical lattices at present. To overcome the density limit that is due to light induced interactions between atoms optical lattices have been proposed [5, 6], in which the fluorescence rate for the trapped atoms is strongly reduced. They are referred to as dark or gray optical lattices and have been demonstrated [7] using a scheme that requires a static magnetic field.
In this paper we describe and experimentally investigate a new type of dark (or gray) optical lattice that utilizes merely an optical field. The lattice combines efficient accumulation of the atoms in the lowest energy level of the optical potential with a reduced fluorescence rate for the localized atoms. We have studied [8, 9] the adiabatic release of atoms from the dark optical lattice both theoretically and experimentally with the result that the band populations are indeed mapped on the corresponding momentum intervals of the free atom, as it was suggested by Kastberg et al. [10] for adiabatic cooling in a bright optical lattice. This population mapping is accurate, if optical pumping between different bands is negligible during the adiabatic release. In an experiment with a slow beam of Rb atoms we utilize this population mapping to measure the band populations of the purely optical dark lattice. For a wide range of parameters we find excellent agreement between the measured band populations and theoretically calculated values. This establishes population mapping by adiabatic release as an experimental tool to investigate the interaction of atoms with a spatially periodic potential.
II Purely Optical Dark Lattice
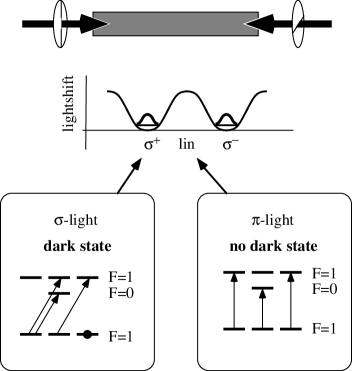
To create the optical lattice we use a standing wave consisting of two counter propagating waves with mutually orthogonal linear polarizations (linlin). In this configuration the polarization changes periodically from to polarization along the standing wave axis. Detuning and intensity are chosen such, that the laser field couples a ground state manifold with integer total angular momentum to two excited state manifolds with angular momenta and . Fig. 1 illustrates the situation for the simplest example of a transition pair. The interaction of the oscillating atomic dipole with the standing wave causes spatially periodic light shifts in the atomic ground state manifold. In regions of purely () polarized light the atoms are optically pumped into the = () ground state, which is decoupled from the light field and experiences no light shift or optical excitation. At locations of linearly polarized light all ground state sublevels are coupled to excited states[11]. In this case all ground state sublevels are light shifted towards higher energies, if the laser field is tuned to a frequency higher than both transition frequencies (blue detuning). In this semi classical picture of point like atoms one expects that the atoms are cooled by a Sisyphus mechanism[12] and accumulated in dark states at locations of pure -polarization. In a picture which treats the atomic motion quantum mechanically the atomic wave function always has a finite spatial extent and can not be completely decoupled from the light field. Therefore a dark (gray) optical lattice with a low fluorescence rate and long coherence times is formed [9]. Low fluorescence rates for the localized atoms are achieved, even if the lattice is operated at small detunings. The situation is qualitatively similar to that of magnetic field induced dark optical lattices, where localized dark states are created by combining a standing wave with a magnetic field [5, 7].
We have also investigated a second configuration[8], in which a purely optical dark lattice is formed in a similar way on a transition pair with integer angular momentum . The laser field forms a linlin standing wave and is tuned between the two transitions. To understand the underlying mechanism consider first the coupling of the laser field only to the transition. For any polarization and for any position in space one substate of the ground state manifold is not coupled to the light field. All other substates of the ground state manifold couple to the light and are light shifted towards higher energies, because the laser field is tuned to a frequency higher than the transition frequency. Now complete the picture and consider additionally the coupling of the laser field to the excited state manifold. Here the laser field is detuned towards lower frequency and introduces additional spatially varying light shifts towards lower energies. This affects all substates of the ground state manifold. The state , which so far was unshifted, undergoes the largest light shift towards lower energy. As a result a dark optical lattice is formed, since optical pumping on the (far detuned) transition is negligible. In spite of low optical pumping dynamics on the transition the coupling to the transition allows for an efficient Sisyphus cooling[12] of the atoms to the minima of the lowest optical potential.
III Adiabatic Mapping

It has been suggested in recent experimental work[10, 8] that the populations of an optical lattice can be directly experimentally measured by an adiabatic release of the atoms from the lattice and a subsequent measurement of the resulting atomic momentum distribution. Fig. 2 shows schematically the band structure of the lattice during the adiabatic release. The plot on the left side corresponds to a situation of high laser field intensity, i. e. of deep optical potentials. The atoms are tightly bound to the lattice sites and tunneling between neighboring potential wells is negligible. Therefore the lowest energy bands are flat[13]. For lower field intensity (central plot) the wave functions of neighboring wells can overlap and the energy bands have a corresponding curvature. If the field is completely switched off and no lattice interaction is present, the band structure is that of a free particle. The segments of the energy-momentum-parabola are plotted on the right side in the reduced zone scheme. If the release is fully adiabatic, the population from the lowest (first) band is mapped exactly to the momentum interval between and and the second band will be mapped to the intervals to and to . The -th band will be mapped on the to and the to momentum intervals. Nonadiabaticity and incoherent redistribution of the atoms during the release will modify this mapping. The assignment between the band populations of the lattice and the momentum intervals of the free atoms will be less accurate. We have performed a full quantum Monte Carlo simulation with a time dependent laser intensity to quantitatively verify the mapping between the stationary population distribution of the lattice and the momentum distribution of the free atom. For the three lowest energy bands the deviations between the band populations and the calculated fraction of atoms to be found in the corresponding momentum interval are below 1% [9].
IV Experiment
For an experimental demonstration of the purely optical dark lattice and the band population measurement, we have performed an experiment [9] with the apparatus described in Refs.[14, 8]. The purely optical dark lattice is realized on the transitions of the 85Rb -line.
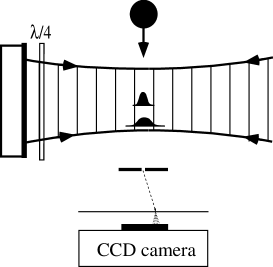
A pulsed beam of cold Rubidium atoms is directed vertically downwards and crosses a standing wave field (lattice field), which induces the optical potentials of the dark lattice (Fig. 3). The atoms are cooled into the lattice sites and are then gradually released from the optical potential due to the Gaussian shape of the lattice field. Below the lattice field the momentum distribution of the atoms is measured with a resolution of one third of the photon recoil.
The lattice field is induced by a standing wave oriented along the -axis and has a frequency tuned MHz to the blue of the transition. The hyperfine-splitting between the two excited states of the -line is . Correspondingly the detuning with reference to the transition is . The incoming beam of the standing wave is linearly polarized along the -axis and the reflected beam is polarized along the y-axis. The Gaussian waists of the beams are mm in -direction and mm in -direction. This corresponds to a 0.4 ms time of flight of the atoms (3.2 m/s) through the waist . The region of the lattice field is shielded against stray magnetic fields to well below 0.5 mG. A second standing wave overlaps the lattice field. It is tuned to the transition of the -line and optically pumps the atoms into the ground state.
To determine the momentum distribution we place a pinhole of m diameter 5 mm below the standing wave axis. The atoms that pass through the pinhole expand horizontally in two dimensions according to their transversal momentum. A transversal momentum of is translated into m transversal displacement in a plane 9.6 cm below the pinhole. The spatial distribution of the atoms in this plane is imaged by recording the fluorescence in a sheet of light with a CCD camera. The sheet of light is formed by a standing wave which is resonant with the closed cycle transition of the -line. For each set of parameters we accumulate 200 single shot images and subtract the separately measured background. To obtain a one dimensional momentum distribution in -direction we integrate the two dimensional distributions along the -axis.
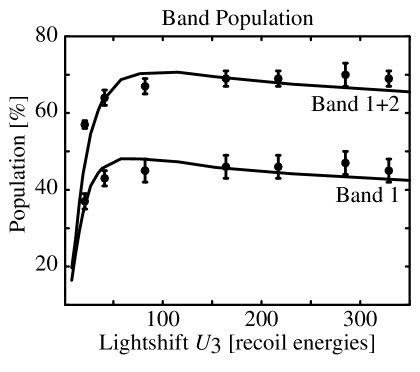
We count the number of atoms detected in the momentum intervals to and to corresponding to the populations in the lowest energy band and the two lowest energy bands, respectively. These experimentally obtained band populations are plotted as data points in Fig. 4. The light shift is given by , where is the resonant saturation parameter on the transition in the center of the Gaussian beam. The data points were recorded for several intensities and fixed detuning. The solid lines represent the (steady state) band populations in the lattice calculated [9] for the center-of-beam parameters using a rate equation approach. The experimentally measured populations and the calculated steady state populations agree within 5% over the full range of investigated parameters. This is remarkable, because the calculation is based only on the detunings and the intensities in the center of the Gaussian beam and the comparison involves no fit parameter. Small deviations for the experimental values towards higher ground state population are found for high light shift parameters . This can be attributed to the small but finite spontaneous emission probability during the release of the atoms. It mainly affects energetically higher lying states and transfers additional population to the ground state.
V Conclusion
In conclusion, we have theoretically and experimentally studied purely optical dark optical lattices which combine low photon scattering rates with a high population in the lowest energy bands. Long coherence times in this bands allow for adiabatic manipulations and for the observation of non-dissipative effects in periodic potentials [15]. The lattice is formed by coupling an atomic ground state to two excited states. The atoms are trapped at locations of purely circular polarization which permits an extension of the scheme to two and three dimensions using the same field configurations as for bright optical lattices [16]. The adiabatic population mapping between the energy bands and free particle momentum intervals allows a direct determination of the band populations. We measured the band populations over a wide range of lattice parameters. The quantitative agreement of the measured band populations with the calculated results shows that adiabatic mapping is a promising tool to study the density dependence of the band populations in an optical lattice.
ACKNOWLEDGMENTS
We are grateful to Peter Marte for his stimulating and inspiring contributions, and the Deutsche Forschungsgemeinschaft for their support of the project. Helmut Ritsch and Herwig Stecher wish to thank the Östereichischer Fonds zur Förderung der wissenschaftlichen Forschung for their support under the grant No. S6506/S6507.
REFERENCES
- [1]
- [2] M. G. Prentiss, Science 260, 1078 (1993); G. P. Collins, Physics Today 46, 17 (1993); and references therein.
- [3] K. Ellinger, J. Cooper and P. Zoller, Phys. Rev. A 49, 3909 (1995), and Refs. therein; C. G. Townsend, N. H. Edwards, C. J. Cooper, K. P. Zetie, C. J. Foot, A. M. Steane, P. Szriftgiser, H. Perrin, and J. Dalibard, Phys. Rev. A 52, 1423 (1995).
- [4] M. H. Anderson, J. R. Ensher, M. R. Mathews, C. E. Wieman, and E. A. Cornell, Science 269, 198 (1995); C. C. Bradley, C. A. Sackett, J. J. Tollett, and R. G. Hulet, Phys. Rev. Lett. 75, 1687 (1995); K. B. Davis, M.-O. Mewes, M. R. Andrews, N. J. van Druten, D. S. Durfee, D. M. Kurn, and W. Ketterle, Phys. Rev. Lett. 75, 3969 (1995).
- [5] G. Grynberg and J.-Y. Courtois, Europhys. Lett, 27, 41 (1994).
- [6] T. Pellizzari and H. Ritsch, Europhys. Lett. 31, 133 (1995); J. Guo and P. Berman, Phys. Rev. A 48, 3225 (1993).
- [7] A. Hemmerich, M. Weidemüller, T. Esslinger, C. Zimmermann, and T. Hänsch, Phys. Rev. Lett. 75, 37 (1995).
- [8] T. Esslinger, F. Sander, A. Hemmerich, H. Ritsch, M. Weidemüller, and T. W. Hänsch, Opt. Lett. 21, 991 (1996).
- [9] H. Stecher, H. Ritsch, P. Zoller, F. Sander, T. Esslinger, and T. W. Hänsch, Phys. Rev. A, scheduled for 1. Dec. 1996.
- [10] A. Kastberg, W. D. Phillips, S. L. Rolston, R. J. C. Spreeuw, and P. S. Jessen, Phys. Rev. Lett. 74, 1542 (1995).
- [11] Choosing the quantization axis along the electric field vector at locations of linear polarization simplifies the analysis. The light field then induces -transitions (). At locations of purely circular polarization the light field induces -transitions if the quantization axis is chosen along the standing wave axis. These conventions are used in Fig. 1.
- [12] J. Dalibard and C. Cohen-Tannoudji, J. Opt. Soc. Am. B 6, 2023 (1989).
- [13] N. W. Ashcroft and N. D. Mermin, Solid state physics, Int. Ed., Saunders College Publishing (1976)
- [14] T. Esslinger, F. Sander, M. Weidemüller, A. Hemmerich, and T. W. Hänsch, Phys. Rev. Lett. 76, 2432 (1996).
- [15] M. B. Dahan, E. Peik, J. Reichel, Y. Castin, and C. Salomon, Phys. Rev. Lett. 76, 4508 (1996); S. R. Wilkinson, C. F. Bharucka, K. W. Madison, Q. Niu, and M. G. Raizen, Phys. Rev. Lett. 76, 4512 (1996).
- [16] A. Hemmerich and T. W. Hänsch, Phys. Rev. Lett. 70, 410 (1993); A. Hemmerich, C. Zimmermann, and T. W. Hänsch, Europhys. Lett. 22, 89 (1993); G. Grynberg, B. Lounis, P. Verkerk, J.-Y. Courtois, C. Salomon, Phys. Rev. Lett. 70, 2249 (1993).