Network Topology of the Austrian Airline Flights
Abstract
The information of the Austrian airline flights was collected and quantitatively analyzed by the concepts of complex network. It displays some features of small-world networks, namely large clustering coefficient and small average shortest-path length. The degree distributions of the networks reveal power law behavior with exponent value of 2 3 for the small degree branch but a flat tail for the large degree branch. Similarly, the flight weight distributions show power-law behavior for the small weight branch. Furthermore, we found that the clustering coefficient , 0.206, of this flight network is greatly larger than that of a random network, 0.01, which has the same numbers of the airports () and mean degree (), and the diameter , 2.383, of the flight network is significantly smaller than the value of the same random network, 18.67. In addition, the degree-degree correlation analysis shows the network has disassortative behavior, i.e. the large airports are likely to link to smaller airports. Furthermore, the clustering coefficient analysis indicates that the large airports reveal the hierarchical organization.
pacs:
89.75.Hc, 89.75.Da, 89.40.DdNetwork behaviors emerge across many interdisciplinary sciences and attract the interests from many researchers in different research fields. Network is usually a set of items, which we will call vertices or sometimes nodes, with connections between them, called edges. Systems with the form of networks are distributed over the world. Examples BA-RMP ; Dorogovtsev ; Newm include the Internet, the World Wide Web (WWW), social networks of friends, networks of business relations between companies, neutral network, metabolic networks, food webs, distribution networks such as blood vessels or postal delivery routes, networks of citations between papers, networks of paper collaborators, network of publication download frequency Han , and traffic transportation networks cai ; cai2 ; cai3 ; Railway ; Zhou ; Xu and many others He ; Wang ; Wu ; Ouyang ; Liu1 ; Chen . Even in microscopic scale, such as in nuclear fragmentation produced in heavy ion collisions, the hierarchial power-law distribution of nuclear fragments emerges by Ma’s nuclear Zipf-type plots around the nuclear liquid gas phase transition, which also shows a similar character to the scale free network Ma ; Ma2 .
In a pioneering work of Barabasi and Albert, they found that the degree of node of Internet routes, URL (universal resource locator) - linked networks in the WWW satisfies the power-law distribution BA ; BA2 , also called as the scale-free networks. The degree distribution of a scale-free network is a power law,
| (1) |
where is called the degree exponent. In addition, there are other two main topological structures of complex networks: random-graph models rand and small-world networks Wat . The research on random graphs was initiated by Erdös and Rényi in the 1950s. It has shown that the degree distribution of a random graph is of Poisson type, . Small-world networks are somehow in between regular networks and random ones Koc .
In this work we study the flight network affiliated with Austrian Airline company to shed light on understanding the real topological structure and inherent laws of flight network design by a specific airline company. Some features of the flight network will be compared with those of the above three categories of networks. To this end, we would like to check the similarities and differences among possibly different networks. Some studies have been performed for the flight networks, such as for international transportation airport networks by the foreign colleagues Pnas ; Guimera ; Colizza as well as the US and China flight networks by Cai’s group cai ; cai2 . Some interesting features have been demonstrated for such flight networks, such as the small-world property: high clustering coefficient, small diameter and hierarchical structure. However, our present work is different in motivation and results. The previous flight network involved in a whole national or international airport networks, which did not care about the detailed information of the fights which were operated by a specific airline company. These national- or world-wide flight networks are large scale Pnas ; Guimera ; Colizza but they are the result from collective role by the various Airline company networks. Therefore, it is of interesting to survey a particular airline flight network instead of a whole national or international- wide flight network. Based upon this motivation, we will investigate a smaller network which was composed by the flights affiliated with a specific airline in the present work. As an example, we have investigated the flight network of a central European airline company, Austrian Airline. The flight information is available in the web page, http://www.aua.com/
In the flight network, the airports can be represented by the vertices and the flights connecting two airports by edges. In the previous studies Pnas ; Guimera ; Colizza ; cai ; cai2 , some features of the structure of flight networks have been recognized: (1) the network is directional. All the flights are directed, sorted as outgoing and incoming. (2) the network has weight. To reflect how busy a certain line is, it is important to record the exact number of flights between any given airport and cai , even to record the seat numbers available in different flights Pnas . (3) the network may be a little different day by day in a whole week. Hence, the weekly flight information partially involves the information on evolution of the flight network. Our data contain a whole week information of around 134 airports and 9560 flights. The detailed numbers of the airports and flights are listed in Table I. For the number of flights, it is the largest on Monday and the smallest on Saturday.
The paper is organized as follows. First we present a sample of the flight network in Friday and its degree distribution. Then we give the results of the flight weight distributions, of the clustering coefficient, of the diameter and of the assortative coefficient, respectively. Finally a summary is given.
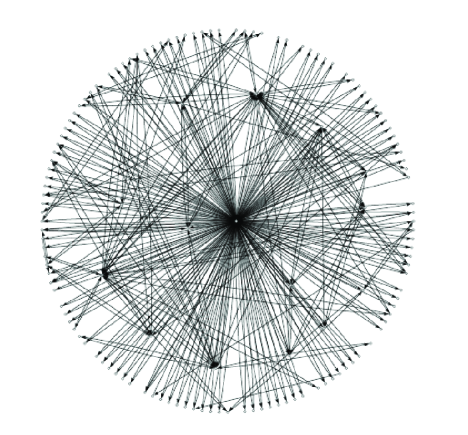
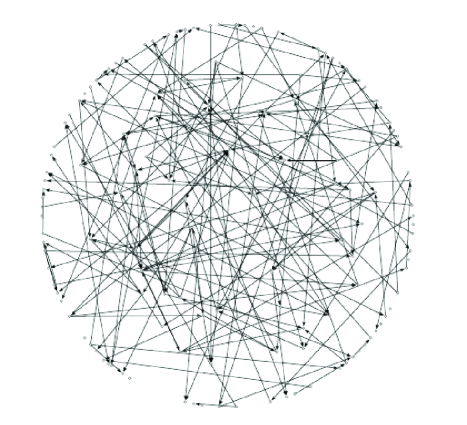
The vertex degree distribution function gives the probability that a randomly selected vertex has exactly edges Bol . Figure 1 shows a topological structure of the Austrian airline flight network on Friday, where each airport is expressed by a node and the flights are connected by the lines between two nodes. The Vienna airport is the dominative airport operated by the Austrian airlines, which has naturally the largest amount of edges. There are several major airports, such as Paris, Frankfurt etc, which have frequent flights to connect with other small airports operated by the Austrian Airlines. For comparison, the Erdös and Rényi-type random network structure which has the same vertices = 136 and mean degree = 1.31 is also plotted in the figure. The obvious different topological structure is there.
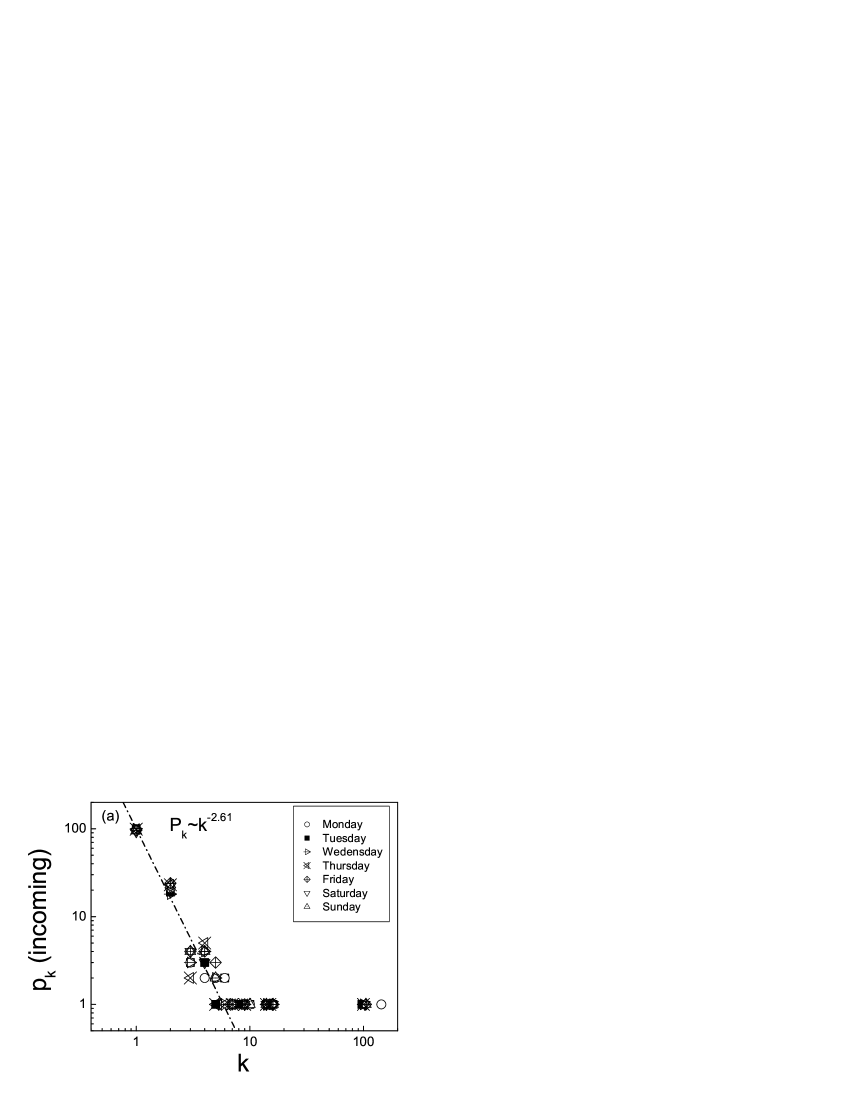
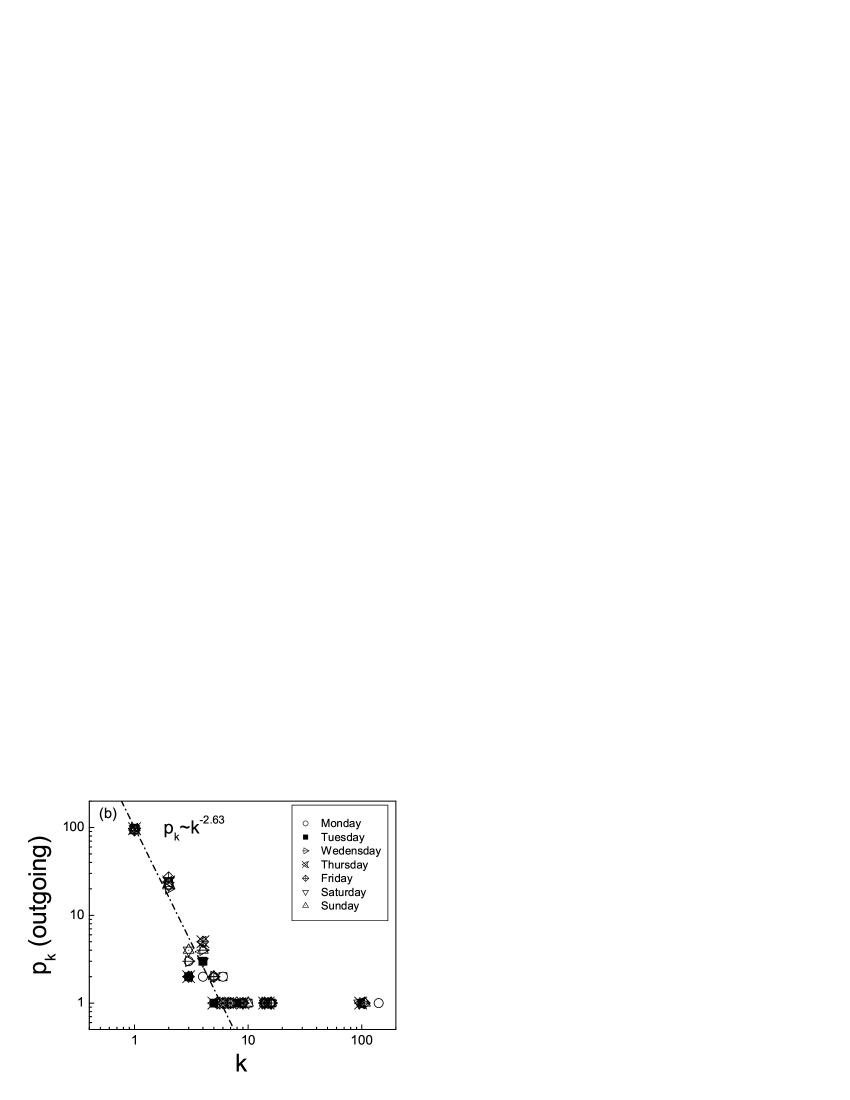
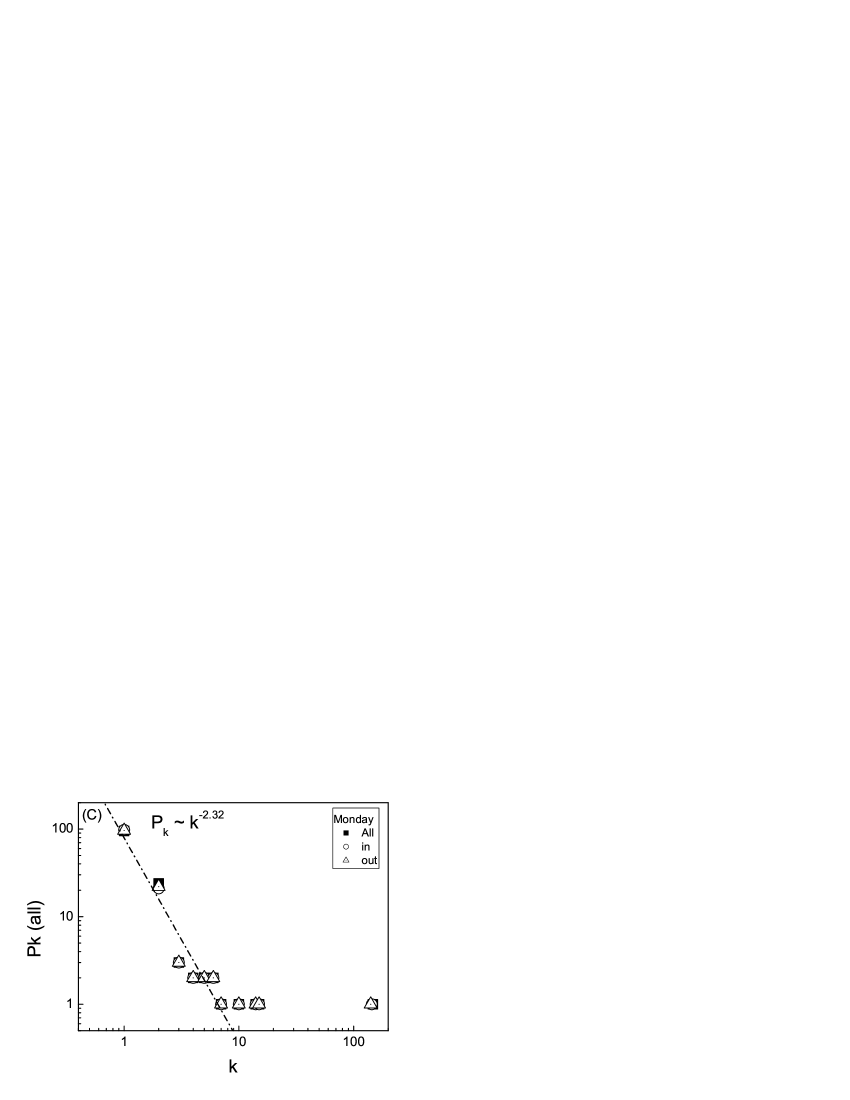
Three kinds of degree distributions, namely , and are shown in Figure 2. and represent the frequencies of incoming and outgoing of flights, respectively. is used when we do not distinguish outgoing and incoming flights, i.e. it is just the degree number which is regardless wether the flight is outgoing, incoming, or both of them. Note that the present degree distribution is not cumulative distribution as done in Ref. cai ; cai2 . Even though the statistical fluctuation could keep large in degree distribution in comparison with the cumulative distribution, the distribution can give the direct probability how many Austrian Airline flights are coming or taking off. Two branches are seen in Figures 2(a) and 2(b): the first one follows the power-law when and the second one is the flat tail distribution when , which is basically related to some largest airports which serve for Austrian Airlines. This behavior can be partially attributed to different mechanisms between small airports and large airports. For an example, they have different growth rates since the construction of small airports or the flight line extension to small airports by the Austrian Airlines is much easier and faster than that of large airports. In the following, we can extract the exponents of the degree distribution for small airports which Austrian Airline flights cover. When , the mean weekly value of , and correspond to 2.61, 2.63 and 2.47; Exponents in each day in Figure 2 are listed in Table I. The average degree of the flight network is given by . The average = 1.30 . That means each airport is linked to 1.3 other airports for the flights affiliated with Austrian Airlines. Similarly, = 1.279 and = 1.277. In details, on each day are listed in Table I.
| Mon | Tue | Wed | Thu | Fri | Sat | Sun | |
| 133 | 136 | 134 | 136 | 136 | 130 | 134 | |
| 1518 | 1421 | 1418 | 1296 | 1471 | 1158 | 1278 | |
| 2.319 | 2.476 | 2.399 | 2.507 | 2.312 | 2.622 | 2.443 | |
| 2.319 | 2.509 | 2.410 | 2.506 | 2.413 | 2.653 | 2.424 | |
| 2.331 | 2.319 | 2.478 | 2.519 | 2.495 | 2.649 | 2.457 | |
| 1.587 | 1.248 | 1.256 | 1.221 | 1.221 | 1.206 | 1.212 | |
| 1.576 | 1.230 | 1.271 | 1.215 | 1.281 | 1.108 | 1.256 | |
| 1.609 | 1.221 | 1.306 | 1.250 | 1.309 | 1.177 | 1.231 | |
| 1.120 | 1.234 | 1.218 | 1.224 | 1.258 | 1.724 | 1.543 | |
| 0.202 | 0.204 | 0.195 | 0.206 | 0.242 | 0.180 | 0.210 | |
| -0.529 | -0.515 | -0.519 | -0.517 | -0.517 | -0.562 | -0.543 |
As shown in Figure 1, the topological structure of flight network is significantly different from those of random graphs. In a random graph of the type studied by Erdös and Rényi, each edge is present or absent with equal probability, and hence the degree distribution is binomial or Poisson distribution in the limit of large graph size. Real-world networks are mostly found to be very unlike the random graph in their degree distributions. The degrees of the vertices in most network are highly right-skewed. This is the case of the present flight network. From the exponents of different days in a week as shown in Table I, we can find that exponents and on Saturday are the largest and on Monday are basically the smallest. Similarly, the mean degrees of flights on Saturday and Monday are significantly different: it is the smallest on Saturday and the largest on Monday, which is in consistent with the largest value of on Saturday and the smallest on Monday. This is also not contradicted with the difference of total day-flight number between Saturday and Monday as shown in the same table. In other words, Monday is the busiest flight transportation day and Saturday is the most unoccupied flight transportation day for the Austrian Airline. This can be partially related to the behavior of human business travel.
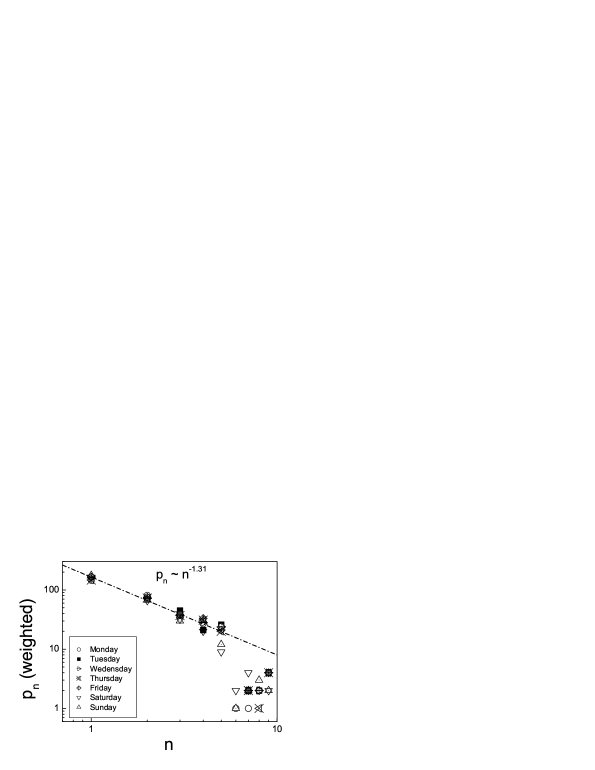
Since the flight network involves in transportation flux, the weight is important and can reflect some information of the whole network. As shown in Fig. 3, the flight weight distribution in a week has a power-law distribution in the small weight branch,
| (2) |
where is the exact number of flights between any given airport and . The outgoing network exponents, , of different days in a week are shown in Table I. The mean exponent of a week is 1.33. Again, there is a different value for working days and weekend. The exponent is around 1.2 in working days but it shifts dramatically to larger values on Saturday and Sunday (see Table I). Again, the value of Saturday is the largest and the one of Monday is the smallest. The larger means the steep slope, which results in the smaller mean weight. Therefore, the values of larger can be attributed to the declining flight number on weekends.
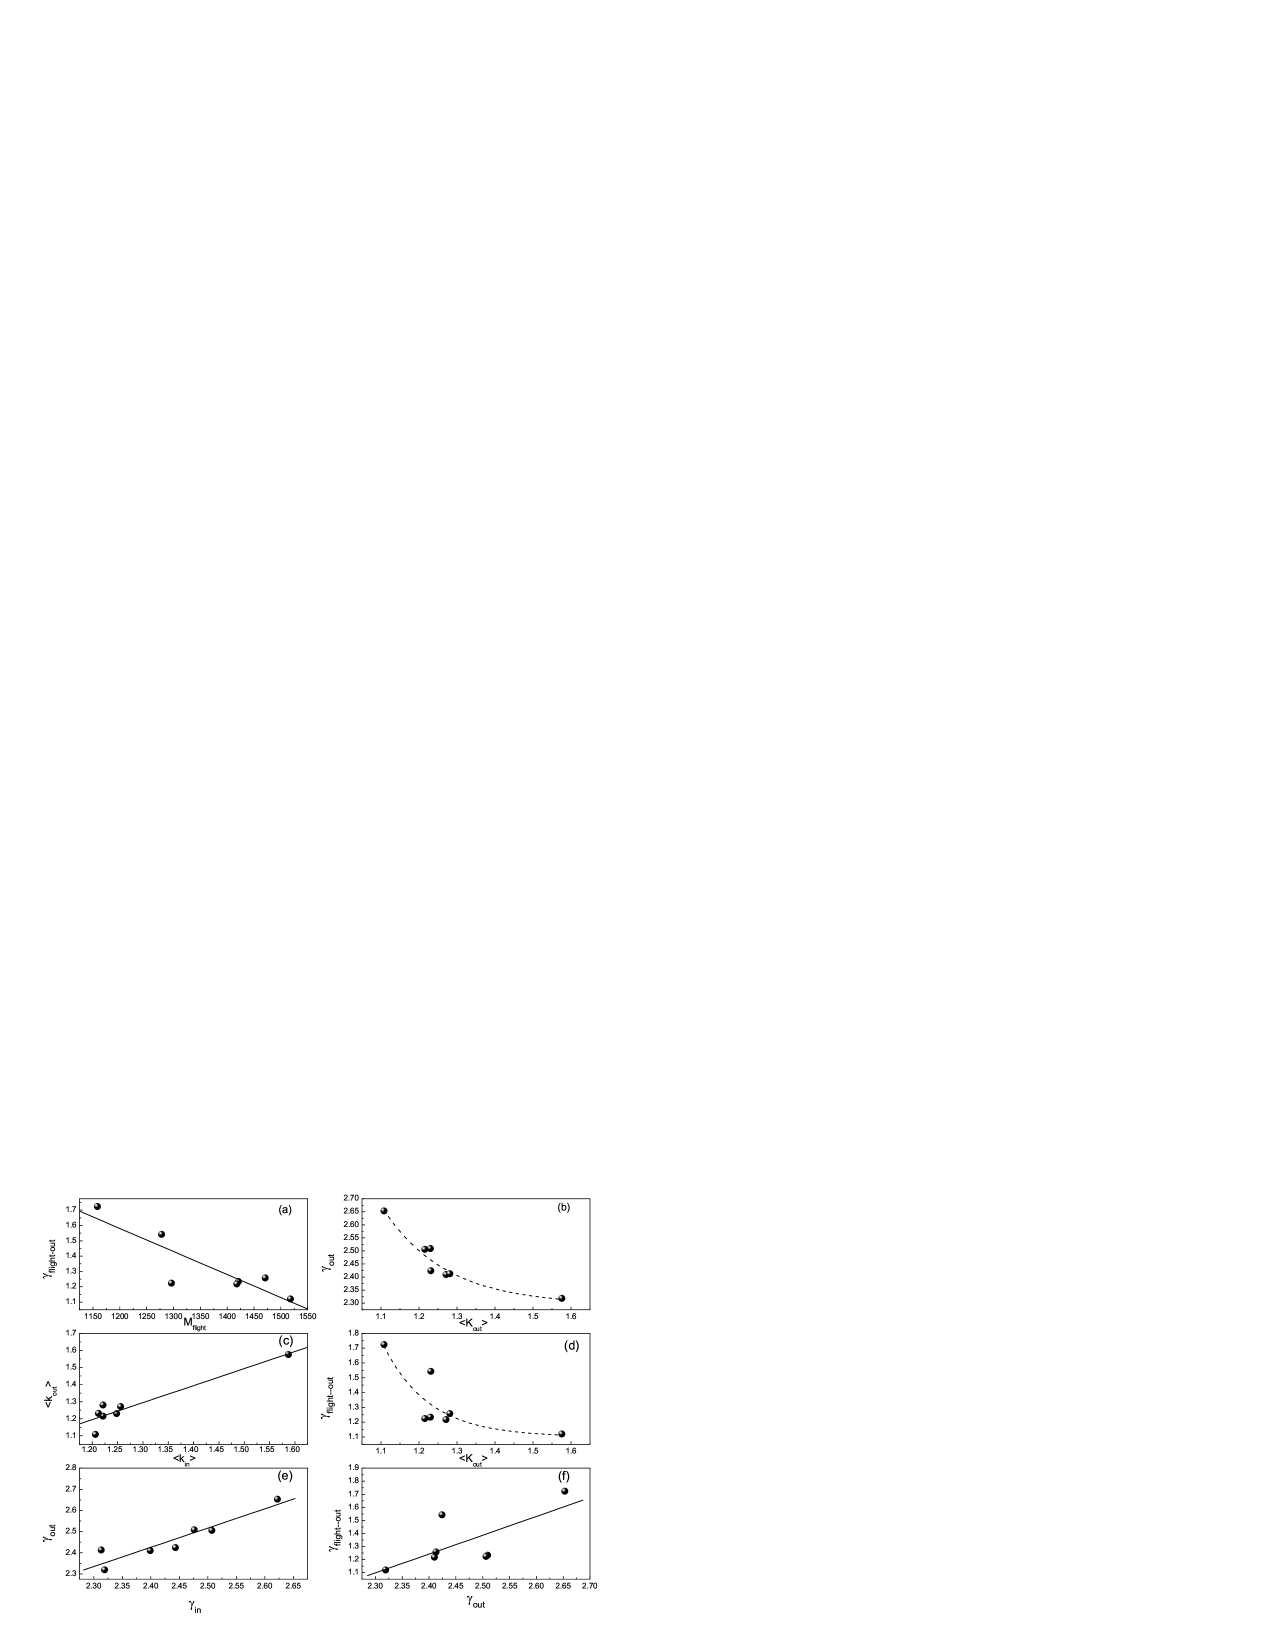
To have a visual feeling of the Table, we take the outgoing flight network as an example to make some correlation plots which are shown in Fig. 4. Each point represent the data of a day in one week. Fig. 4(a) shows the correlation of total flight numbers () and the power-law exponents of the weight flight distributions (). It is cleanly seen that the larger the total flight numbers, the smaller the exponents, i.e. the flatter the weight flight distribution. Fig. 4(c) and (e) display the positive correlation between and , and and , respectively. This just says there is similar behavior for both incoming flight network and outgoing flight network. Fig. 4(f) shows the positive correlation between and , i.e. there exists the positive correlation between the degree distribution and weight flight distribution. Fig. 4(b) and (d) shows the relationship between the and or , respectively, which indicates that the degree or weight flight distribution which has larger mean value of the degree or weight flights has flatter distributions. From these correlation plots, we found that the flight network shows its evolving feature day by day in a week, i.e. there are different exponent values of network distributions in different week-days which are apparently related to total flight number of each week-day.
In many social networks, there exists a clique form which can be represented by circles of friends or acquaintances. Quantitatively, this inherent tendency to cluster can be expressed by the clustering coefficient Wat . For a selected vertex of the network, it has edges which we call the nearest neighbours of . In this case, the maximum possible edges among neighbours are = 2. If we use to denote the number of edges that actually exist, the clustering coefficient of vertex can be written as
| (3) |
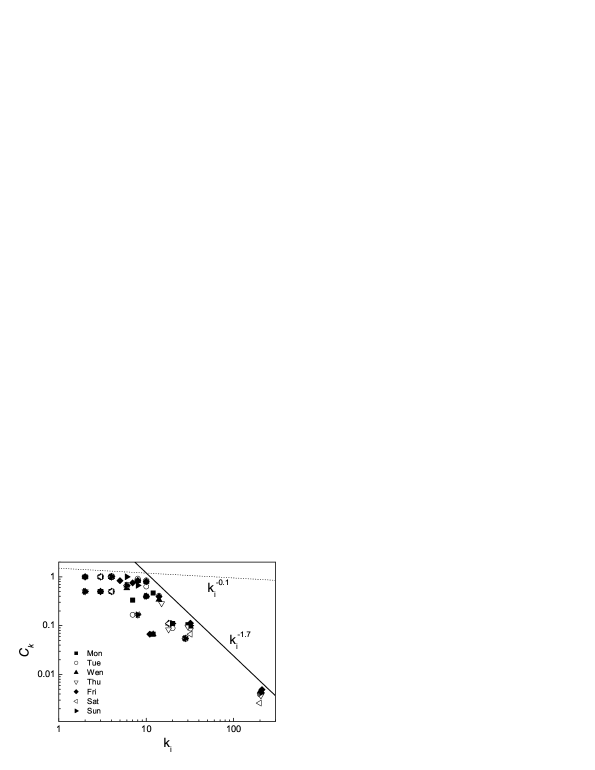
and the clustering coefficient of the entire network is defined as . The clustering coefficient of the Austrian Airline flight network in a week is 0.206. We also calculate on each day (see Table 1). To look for the difference, we complete of our flight network with that of a random graph which has the same and . In such a random graph, the clustering coefficient is where is the connection probability. Thus, in our flight network is much larger than that in a random graph. Fig. 5 shows the scattering plots of the clustering coefficient for un-directional flight network of each day in a week as a function of the vertex degree. Similar to the degree distribution (Fig.2), there are two segments: a nearly flat distribution for small () and a power-law decay with the exponent for . The small- branch corresponds to the majority of airports with a few links to other airports, each such airport has a clustering coefficient close to 1. The high- airports include many large airports, and thus, their neighbors are not necessarily linked to each other, resulting in a smaller . A power-law decay of high- branch indicates that a hierarchical organization Ravasz for larger airports, in contrast to the independent predicted by the scale-free networks as in small- branch.
The average shortest-path length between any two airports in the system can be characterized by so-called ”diameter” in small-world networks BA2 , which is defined as
| (4) |
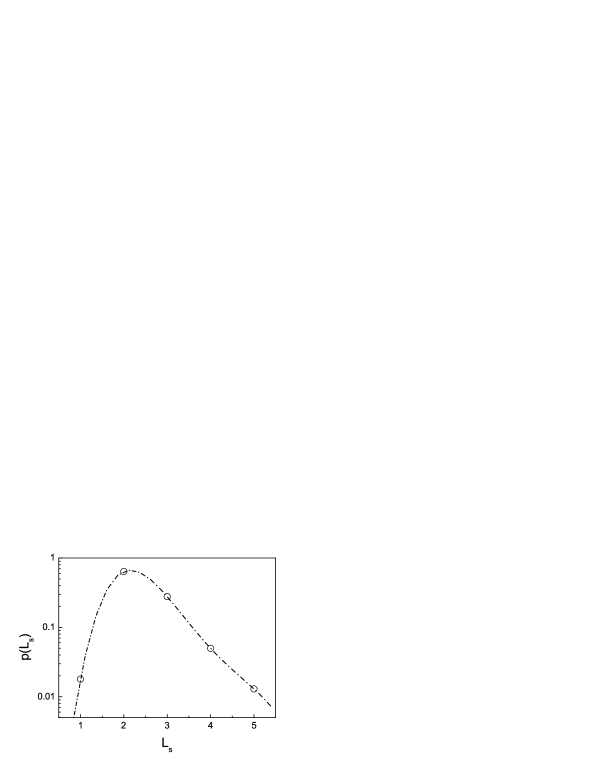
where is the minimum number of edges traversed from vertex to vertex . The diameter of the flight network reflects the average number of least possible connections between any two airports. The corresponding probability distribution of the shortest path lengths of the whole flight network, namely 1, 2, 3, 4 and 5, is shown in Fig. 6, i.e. numerically 0.018, 0.641, 0.278, 0.050 and 0.013, respectively. The line is just fourth order polynomial fit. This implies that from airport to , there will be basically not more than three connections (the shortest-path length of 1 means a direct flight) where the probability is smaller than 10. The diameter of our flight network is = 2.383, which means that on the average there will be 1.383 connections from airport to . Using the same approach, we compare the of our flight network with that of the random graph. The diameter of the random graph is = ln(N)/ln() = 18.67 Koc . In other word, the diameter of our flight network is significantly smaller than the one of the random graph with the same nodes and mean degree.
Many networks show assortative mixing on their degrees, i.e., a preference for high- degree vertices to attach to other high-degree vertices, while others show disassortative mixing high-degree vertices attach to low-degree ones. Quantitatively, the degree-degree correlation coefficient (also called assortative coefficient) can be written as
| (5) |
where and are the degrees of the vertices at the ends of the th edge, with =1,…, M. As Newmann showed, the values of of the social networks have significant assortative mixing. By contrast, the technological and biological networks are all disassortative Newmann . In this work, we also check the coefficient and we list those values of each day in Table 1. As we expected the values are all negative, which means the flight network is disassortative. In other word, the large airports are likely to link to smaller airports. This fact is in agreement with many technological and biological networks Newmann . The value of Saturday shows the largest.
In summary, our analysis demonstrates that the Austrian Airline flight network displays the small-world property: high clustering coefficient and small diameter. The clustering coefficient (0.206) is greatly larger than that of a random network (0.01) with the same and while the diameter (2.383) of the flight network is significantly smaller than the value of the same random network (18.67). The degree distributions for smaller airports show the power-law behavior with an exponent 2.47 for undirected flight networks. Also the flight weight distributions have power-law distributions with exponent of approximately 1.33. Further, the network shows disassortative behavior which indicates that the large airports are likely to link to smaller airports. In addition, the power-law decay behavior of the clustering coefficient against the degree for high- nodes reflects that the large airports reveal the hierarchical organization. In a whole week, the power-law exponents of the degree distribution and the flight weight distribution show different values day-by-day, especially between Monday and Saturday. The smallest exponent for Monday corresponds to the busiest flight transportation day and the largest exponent on Saturday corresponds to the most unoccupied flight transportation day for the Austrian Airline.
The work was partially Supported by NSFC under Grant No. 10610285.
References
- (1) Albert R, Barabási A-L 2002 Rev. Mod. Phys. 74 47.
- (2) Dorogovtsev S N and Mendes J F 2002 Adv. Phys. 51 1079.
- (3) Newman M E J 2003 SIAM Review 45 167.
- (4) Han Ding-Ding, Liu Jin-Gao, Ma Yu-Gang, Cai Xiang-Zhou, Shen Wen-Qing 2004 Chin. Phys. Lett. 21 1855.
- (5) Chi Li-Ping, Wang Ru, Su Hang, Xu Xin-Ping, Zhao Jin-Song, Li Wei, Cai Xu 2003 Chin. Phys. Lett. 20 1393.
- (6) Li Wei and Cai Xu 2004 Phys. Rev. E 69 046106.
- (7) Wang Ru, Cai Xu 2005 Chin. Phys. Lett. 22 2715.
- (8) Zhao Wei, He Hong-Sheng, Lin Zhong-Cai, Yang Kong-Qing 2006 Acta Phys. Sin. (in Chinese) 55 3908.
- (9) Liu Hong-Kun, Zhou Tao 2007 Acta Phys. Sin. (in Chinese) 56 106.
- (10) Xu Xinping, Hu Junhui, Liu Feng, Liu Lianshou 2007 Physica A 374 441.
- (11) Zhang Pei-Pei, He Yue, Zhou Tao, Su Bei-Bei, Chang HUi, Zhou Yue-Ping, Wang Bing-Hong, He Da-Ren 2006 Acta Phys. Sin. (in Chinese) 55 60.
- (12) Pan Zao-Feng, Wang Xiao-Fan 2006 Acta Phys. Sin. (in Chinese) 55 4058.
- (13) Wu An-Cai, Xu Xin-Jian, Wu Zhi-Xi, Wang Ying-Hai 2007 Chin. Phys. Lett. 24 577.
- (14) Luo Jia-Yuan, Ouyang Qi 2004 Chin. Phys. Lett. 21 1703.
- (15) Liu Feng and Xu Xin-Ping 2007 Chin. Phys 16 282.
- (16) Chen Fei, Chen Zeng-Qiang, Yuan Zhu-Zhi 2007 Chin. Phys 16 287.
- (17) Ma Y G 1999 Phys. Rev. Lett. 83 3617; Ma Y G 2000 Chin. Phys. Lett. 17 340.
- (18) Ma Y G, Natowitz J B, Wada R, Hagel K, Wang J, Keutgen T, Majka Z, Murray M, Qin L, Smith P, Alfaro R, Cibor J, Cinausero M, El Masri Y, Fabris D, Fioretto E, Keksis A, Lunardon M, Makeev A, Marie N, Martin E, Martinez-Davalos A, Menchaca-Rocha A, Nebbia G, Prete G, Rizzi V, Ruangma A, Shetty D V, Souliotis G, Staszel P, Veselsky M, Viesti G, Winchester E M, and Yennello S J 2005 Phys. Rev. C 71 054606.
- (19) Barabási A-L, Albert R 1999 Sciences 286 509 .
- (20) Albert R, Jeong H, Barabasi A L 1999 Nature 401 130.
- (21) Erdös P and Rényi S 1959 Publ. Math. (Debrecen) 6 290.
- (22) Watts D J and Strogatz S H 1998 Nature 393 440.
- (23) Kochen K 1989 The Small World 1989 (Norwood: Albex)
- (24) Barrat A, Barthélemy M, Pastor-Satorras R, Vespignani A 2004 Proc. Natl. Acad. Sci. 101 3747.
- (25) Guimera R, Mossa S, Turtschi A, Amaral L A N 2005 Proc. Natl. Acad. Sci. 1021 7794.
- (26) Colizza V, Barrat A, Barthélemy M, Vespignani A 2006 Proc. Natl. Acad. Sci. 103 2015.
- (27) Bolloba B 1981 Siscrete Math. 33 1.
- (28) Ravasz E, Barabási A-L 2003 Phys. Rev. E 67 026112.
- (29) Newmann M E J 2002 Phys. Rev. Lett. 89 208701.