EUDET-Report-2007-01
\subject![[Uncaptioned image]](/html/physics/0703058/assets/x1.png)
EUDET Telescope Geometry and Resolution Studies
Abstract
Construction of EUDET pixel telescope will significantly improve the test beam infrastructure for the ILC vertex detector studies. The telescope, based on the Monolithic Active Pixel Sensors (MAPS), will consist of up to six readout planes and will be initially installed at an electron beam line at DESY. A dedicated study was performed to understand the position measurement in the telescope and optimize its performance by suggesting the best plane setup. The approach based on the analytical track fitting method allows for determination of the expected measurement uncertainty and for comparison of different telescope setups without time consuming event simulation. The proposed method also turns out to be little sensitive to the possible telescope misalignment.
1 Introduction
The goal of the EUDET project [1] is the improvement of infrastructures to enable R&D on detector technologies for ILC with large scale prototypes. The project is supported by the European Union in the Sixth Framework Programme structuring the European Research Area [2]. One of the research activities, aiming at improving the test beam infrastructure for the vertex detector studies, includes construction of a beam telescope based on Monolithic Active Pixel Sensors (MAPS) [3]. The telescope will consist of up to six sensor planes and will be initially installed at a 6 GeV/c electron beam line at DESY. However, the device should be built in such a way that it could later be used at other laboratories, for instance at high energy hadron beam at CERN. To meet all the requirements and provide a universal test environment for a wide variety of different sensor prototypes, the telescope has to be designed very carefully. One of the important issues is the choice of the telescope plane configuration.
The main aim of the presented study was to understand the position measurement in the telescope and optimize its performance by suggesting the best plane setup. A dedicated track fitting method was developed taking into account multiple scattering. Use of analytical approach allowed us to identify main factors determining the measurement error and compare different telescope setups without time consuming MC simulations.
2 Analysis method
2.1 Assumptions
The approach presented in this paper is based on few simplifying assumptions. These assumptions seem to be realistic for the considered telescope parameters.
The most important assumption is that for the angle between the actual particle track and the nominal beam direction is always small. This is fulfilled if the incoming beam has a limited angular spread and if the particle scattering angles in subsequent telescope layers are small. We also assume that the beam is perpendicular to the sensor planes, so that the track length between planes and the effective thickness of the material layer crossed by the particle are the same for all particles and given by telescope geometry. Thicknesses of all material layers are very small compared to the distances between planes and we assume they can be neglected when calculating the particle scattering angle.
The distribution of the scattering angle is assumed to be Gaussian and the expected width of the distribution can be estimated from the formula [4]:
| (1) |
where , and are the momentum, velocity and charge of the incident particle, and is thickness of the scattering medium in radiation lengths. For the telescope planes we use the radiation length of silicon, cm. We also assume that the position measurement errors in all planes are Gaussian and that there are no correlations between the horizontal and vertical position measurements.
With all the above assumptions the particle track reconstruction in the telescope can be separated into two independent problems of track fitting in horizontal and vertical planes.
2.2 Geometry description
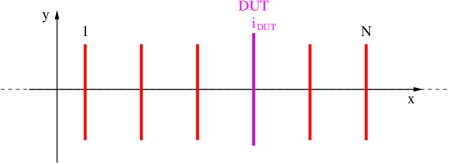
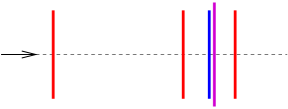
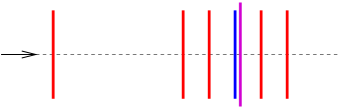
The schematic view of the EUDET beam telescope is presented in Figure 1. We use the right-handed Cartesian coordinate system with the axis pointing in the nominal beam direction and axis pointing up. In the presented analysis we use the following variables to describe the telescope geometry:
-
•
- number of telescope planes; all sensor planes as well as nonactive material layers and included, position of the tested detector plane is denoted by ,
-
•
- position of each plane along the beam direction (),
-
•
- thickness of each plane in radiation lengths,
-
•
- average scattering angle in each plane, calculated from formula (1),
-
•
- position measurement resolution (for sensor planes).
In the following we will assume that the telescope consists only of DUT and active sensor planes () and there is no additional nonactive material, which could affect the performance of the telescope. We also assume that all detector layers are perfectly aligned. The influence of the possible telescope misalignment and the effects expected due to additional material layers in front of and behind DUT (beam windows) will be discussed in the later part of this paper.
2.3 Track fitting
With the expected distances between telescope planes of the order of 10–100 mm and the scattering angles of the order of 0.1 mrad (e.g. for 500 layer and 5 GeV electron beam), the expected track displacement due to scattering can be of the order of few micrometers. It is comparable with the expected position resolution of the telescope sensor layers () and can not be neglected. The track fitting method described below takes it fully into account. Similar approach was previously described in [5].
As mentioned above, track fitting can be considered separately for horizontal and vertical plane (or any two perpendicular planes parallel to the beam axis). Therefor, in the description of the method we will limit ourselves to the two dimensional problem in the horizontal () plane.
The aim of the fit is to determine particle positions in each telescope plane (including DUT), i.e. parameters (, ), from positions measured in telescope planes (, ). The problem can be solved, because we can use additional constraints on the angles of multiple scattering. Contribution of plane to of the fit can be written as:
| (2) |
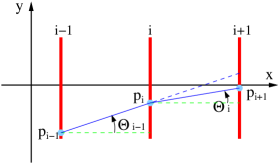
where denotes the angle between the direction perpendicular to the telescope planes (nominal beam direction) and the particle track direction between planes and (see Figure 2). The track angle can be calculated from particle positions in these planes:
The first term in (2) is due to the uncertainty of the position measurement and the second one reflects the expected distribution of the angle of particle multiple scattering in plane . The measurement term drops out for DUT (and other nonactive telescope layers, if considered), whereas the scattering term is missing for the first and the last plane, as the scattering angle can not be determined111 Constraint on the multiple scattering angle in the first plan can be included, if the angular spread of the incoming beam is known and can be approximated by the Gaussian distribution. This additional constrain influences the results only if the angular spread of the incoming beam is comparable or smaller than the expected scattering angles in telescope planes. It was not considered in the presented analysis .
After summing over all telescope layers we get general the following formula for :
where the coefficients and are defined as
Fitting a track implies finding most probable values of particle positions in telescope planes, i.e. finding minimum of . It is equivalent to solving the set of equations:
The advantage of the presented approach is that the derivatives of can be calculated analytically. First derivatives are linear functions of particle positions and the problem can be further reduced to solving a matrix equation:
where:
The general formula for is quite complicated, but the matrix can be calculated analytically. Moreover, all elements of depend only on the assumed telescope geometry and do not depend on the measured particle positions . Therefor the matrix needs to be calculated only once. To solve the equation (i.e. fit the track) we only need to find the inverse matrix:
which can then be used to fit tracks for all collected events. Reconstructed particle position in plane is given by a linear combination of measured positions in all active layers:
| (4) |
Position measurement at DUT, although formally included in the general formula, does not contribute to the results as (same is true for other nonactive telescope layers, if considered).
The diagonal elements of correspond to the expected precision of the particle position reconstruction. The error on the particle position at plane is given by:
Again, it turns out that the uncertainties of reconstructed particle positions depend only on the assumed telescope geometry and do not depend on the measured particle positions. This feature of the proposed analysis method is of great importance, as it allows us to compare the precision of position determination at DUT, , for different telescope geometries and beam energies, without time consuming event generation based on Monte Carlo methods.
3 Simulation results
3.1 Telescope configuration
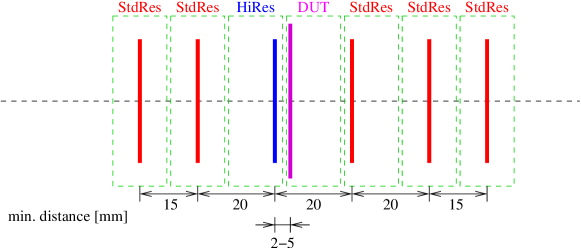
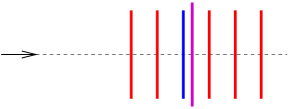
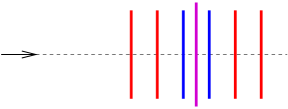
To verify the validity of different assumptions used in the proposed track fitting method, a dedicated simulation study based on Geant 4 has been performed. The telescope configuration used in the simulation is presented in Figure 3.
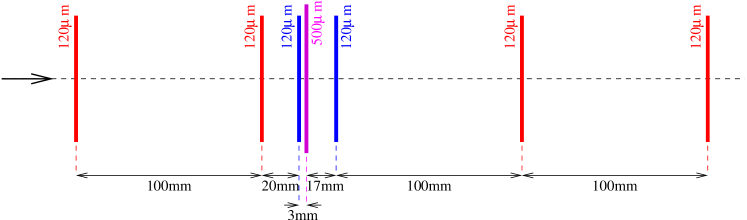
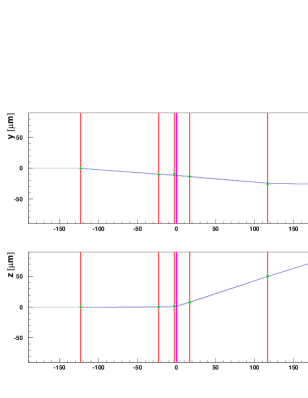
Telescope consists of 7 layers: 6 sensor layers with thickness of 120 and a DUT, 500 thick, placed as a middle layer (indicated in magenta). The first two and the last two sensor planes (indicated in red) are assumed to have the position resolution of (standard sensor planes), whereas for the sensor planes adjacent to DUT (indicated in blue) resolution of is assumed (high-resolution planes). Distances between planes, as indicated in the plot, correspond to the configurations which turned out to result in best particle position determination at DUT. Detector response is simulated by a Gaussian smearing of the particle position with the assumed detector resolution. True particle position at given layer is taken as the mean value of the positions at the entry and exit points, as obtained from simulation. Simulation was performed for two incident beam energies: electron beam of 6 GeV and pion beam of 100 GeV. A sample event from the 6 GeV electron beam simulation is presented in Figure 4.
3.2 Reconstruction results
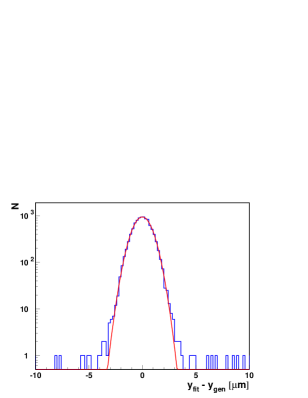
Also shown in Figure 4 is the result of particle track reconstruction with the described method (solid blue line). Reconstructed track follows very closely the ”true” particle trajectory (indicated by dashed line) properly describing particle deflection due to multiple scattering both in DUT and in the sensor layers. The difference between the reconstructed and generated particle position at DUT is presented in Figure 5. As expected, distribution of the position reconstruction error has a Gaussian shape, as indicated by the fitted Gaussian distribution. Only very few events populate non-Gaussian tails, which are probably due to the events with large multiple scattering, not described by the approximate formula (1).
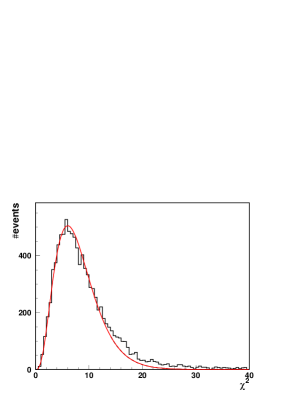
The quality of the track reconstruction is also illustrated in Figure 6. Distribution of the total of the track, calculated as a sum of from fits in the horizontal and vertical plane, is compared with the expected distribution. Results of the simulation are very well described by the distribution expected for 8 degrees of freedom. This is consistent with our expectations, as we fit 14 parameters (particle position in and , in 7 telescope planes) using 12 measurements (from 6 sensor planes) and 10 constraints on multiple scattering (5 inner telescope planes). In the general case, number of degrees of freedom is given by
where is the number of active sensor layers.
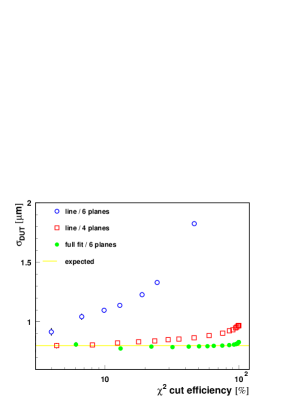
Precision of particle position determination at the DUT plane, as obtained from the Gaussian distribution fit to all simulated events (see Figure 5) is 0.84. However, for few percent of events we observe values larger than expected (see Figure 6). If we reject these events, position reconstruction uncertainty of about 0.81 is obtained, in very good agreement with 0.80 expected from the analytical calculation. The dependence of the obtained position resolution at DUT, , on the fraction of events accepted after cut, is presented in Figure 7. After rejecting of about 10% of events with highest values, telescope position resolution remains flat and agrees very well with the expected precision (indicated by yellow line). For comparison, position resolution at DUT, as obtained from the straight line fit to 6 sensor planes and to 4 inner sensor planes is also shown in Figure 7. Line fit to 4 planes results in much better position determination than the fit to 6 planes. This is because the measurements in the first and the last plane are least correlated with the particle position at DUT due to effects of multiple scattering. Reconstruction method presented in this paper takes these effect into account and allows us to obtain optimum position measurement for 90% of events, whereas for the line fit the corresponding precision could only be reached for about 10% of events with smallest multiple scattering.
3.3 Comparison with analytical error estimates
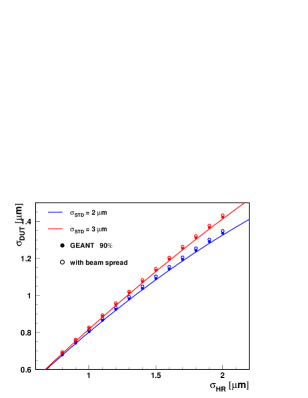
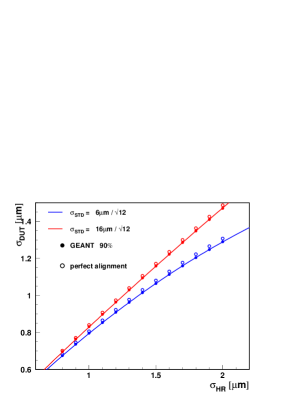
Results presented so far were based on the simulation assuming position measurement resolution of for two sensor planes adjacent to DUT (high-resolution planes) and for the remaining standard sensor planes. To test the validity of analytical approach to position error determination, simulation of detector response was repeated for different values of the assumed sensor plane position resolutions. Shown in Figure 8 is the precision of position determination at DUT, , expected for 6 GeV electron beam, as a function of the position resolution in the high-resolution planes, . Results of the Geant 4 simulation, for 90% of events, i.e. after rejecting 10% of events with the highest values (points) are compared with the resolution expected from the analytical calculations (lines). Standard planes resolution of and is considered. Simulation results agree very well with the model expectations if no angular spread of the incident electron beam is included simulation (filled points). When the angular spread of 0.1 is assumed (open points), precision of position determination obtained from the simulation worsens by 1–2%. This indicates the level of systematic uncertainty of the analytical error estimate due to the simplifying assumptions used in the described method.
Although the method is based on the assumption of the Gaussian position resolution in each plane, this assumption is not crucial for the reliable error estimates. This is demonstrated in figure Figure 9. As before, precision expected from analytical calculation is compared with results of Geant 4 simulation. However, the position measurement error in the standard planes is modeled by the uniform distribution, corresponding to the binary readout option considered for these planes. The error used in analytical calculations is set to of the distribution width, which is given by the sensor pitch of or .
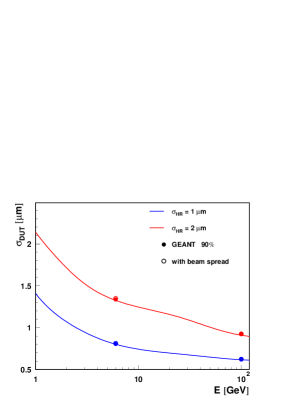
To verify the description of the energy dependence, the Geant 4 simulation was also performed for 100 GeV pion beam. Dependence of the expected position uncertainty at DUT on the incident beam energy is shown in Figure 10. The agreement of analytical error estimates with the uncertainty calculated from the Geant 4 simulation is very good.
4 Telescope configuration studies
As demonstrated in the previous section, presented method gives reliable results for the precision of position measurement at DUT. The position error depends only on the assumed telescope parameters and can be calculated without any event simulation. This allows us to make a quantitative comparison between different telescope configurations. We tried to optimize the telescope setup, by finding telescope geometry which results with the best position determination at DUT. For given number and resolutions of sensor planes, order and distances between planes were varied to find minimum of . If no constraints are put on plane separation, smallest error is always obtained when all distances go to zero. Therefor, to obtain realistic results, one has to take into account constraints which result from the mechanical structure of the telescope.
4.1 Realistic telescope geometry
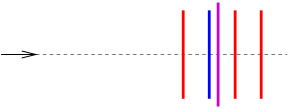
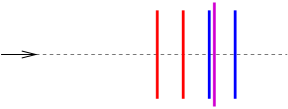
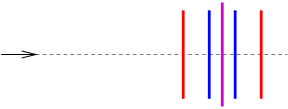
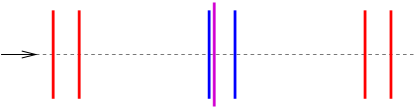
Distances between planes are mainly restricted by the mechanical structure of their support frames. For standard sensor layers the minimum distance between two sensors is expected to be of the order of 15 mm. It is assumed that the telescope should comprise at least one high-resolution plane. This plane could be placed as close as 2–5 mm to DUT. We assume that it will be places in front of DUT222As we do not consider beam energy losses in the telescope planes, same results are obtained if the order of all planes is reversed.. Minimum distance between two planes adjacent to DUT is about 20 mm. Figure 11 shown the schematic view of the telescope with minimum distances between sensor planes indicated. As for the maximum distance, we assume that two subsequent planes should not be separated by more than 100 mm.
The choice of optimum telescope configuration was studied for telescope consisting of 4 or 6 sensor planes (and DUT). Moreover, possibility of having one or two high-resolution sensor planes was considered. General conclusion from all studies is that DUT should always be placed between two sensor planes, and the distance between these two planes should be as short as possible. In most cases, to get the best position measurement separations between other sensor planes should either be equal to the minimum or to the maximum allowed distance between them, depending on the energy, sensor and DUT parameters. High-resolution plane is always the one closest to DUT (we assume that These observation led to the following scheme for the labeling of telescope configurations:
-
•
DUT and two sensor planes close to it are always denoted by –,
-
•
any other sensor plane in front of or behind these 3 planes is denoted by N, if placed at the minimum allowed distance (narrow configuration)
-
•
or by W, if placed at the maximum distance (wide configuration).
All results presented in this section were obtained assuming the thickness of telescope sensors of 120 , both for standard and for high-resolution planes. If not stated otherwise, the resolution of standard sensor planes is assumed to be 2 . For high-resolution sensors the default position determinations uncertainty considered is 1 .
4.2 Results for 1+3 configuration
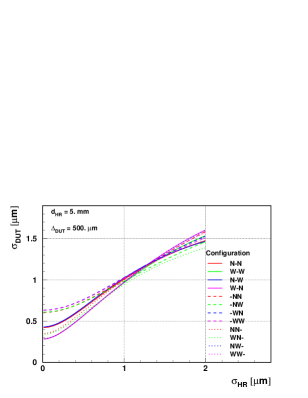
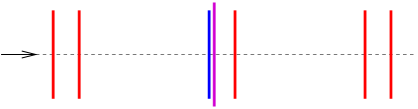
This section describes the results obtained for the telescope consisting of one high-resolution plane (placed in front of DUT) and three standard sensor planes (1+3 configuration). Figure 12 shows the expected precision of position determination at DUT, , as a function of the position resolution in high-resolution plane, , for different telescope geometries, for 6 GeV electron beam. Minimum distance between DUT and high-resolution plane is set to be 5 mm and the DUT thickness assumed is . For the best measurement is obtained in the WN– configuration, i.e. when two standard and a high-resolution plane are placed in front of DUT and only one plane behind it. The configuration scheme is shown in Figure 13 (middle plot).
W–W

WN–
N–N
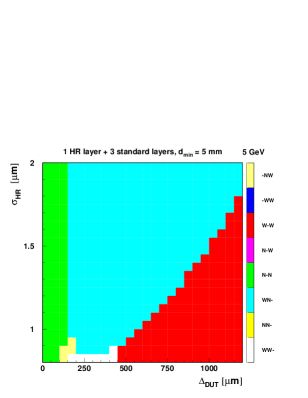
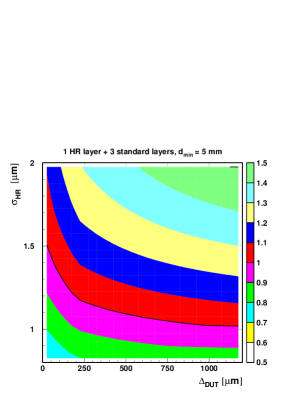
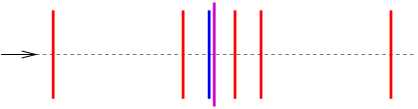
However, this configuration choice is optimal only for the limited range of and , and of the beam energy. This is shown in Figure 14, where the best choice of telescope configuration is shown as a function of the assumed DUT thickness, and the high-resolution plane measurement precision, , for electron beam energy of 5 GeV. For very thin DUT, , when the effects of multiple scattering are small, the best measurement precision can be obtained with N–N configuration. On the other hand, for very thick DUT, when multiple scattering gives dominant contribution to the position uncertainty, and for small values W–W layout turns out to be a preferred choice (for configuration schemes refer to Figure 13).
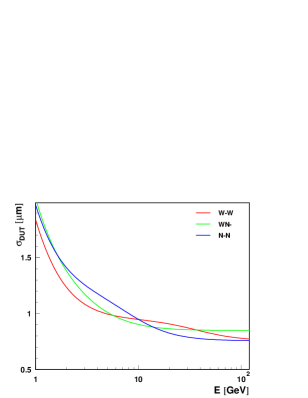
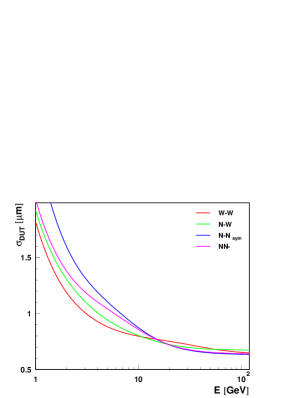
The position uncertainty due to multiple scattering depends on the particle energy. The expected precision of position determination at DUT, , as a function of the beam energy, for the three selected telescope configurations is shown in Figure 15, for the assumed DUT thicknesses of 800 and 300, and the distance between the high-resolution plane and DUT of 5 mm. W–W layout gives the best precision measurement at lowest energies, when the effects of multiple scattering are dominant. Large distances between sensor planes allow for a better estimate of the particle track direction before and after DUT, resulting in better extrapolation of the position measured in the high-resolution plane and in the plane behind DUT to the DUT surface. At high energies influence of multiple scattering is small and the position error at DUT is dominated by the position uncertainties in sensor planes. In this case it is preferable to put all planes as close to each other as possible, and the N–N configuration should be chosen. In addition, there is an intermediate energy range (depending on the assumed value of ) where the WN– configuration results in the best measurement. In the high energy limit the multiple scattering can be neglected and configurations W–W and N–N are expected to give same measurement precision.
m
m
m
m
If the distance between the high-resolution plane and DUT is reduced to 2 mm, expected measurement precision improves, as shown in Figure 16. Significant improvement is observed especially at low energies, where large uncertainty is expected from multiple scattering. Uncertainty in particle direction determination is large, bu smaller distance reduces the error in extrapolating the position measured in the high-resolution plane to the DUT surface.
4.3 Results for 2+2 configuration
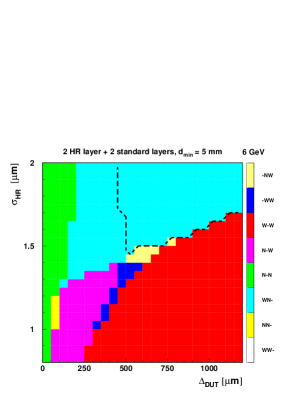
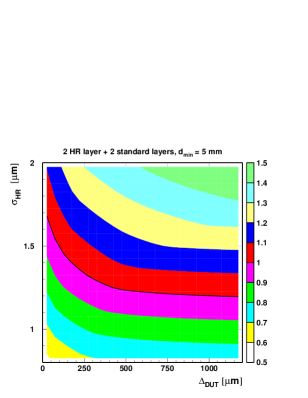
Analysis presented in the previous section was repeated for the telescope consisting of two high-resolution planes and two standard sensor planes (2+2 configuration). The optimal choice of telescope configuration for electron beam energy of 6 GeV, as a function of the assumed DUT thickness, , and the high-resolution plane measurement precision, , is shown in Figure 17. For the high-resolution planes should always be placed in front of and behind DUT, whereas for large and large (the parameter range indicated by dashed line in Figure 17) best measurement is obtained when both planes are put in front of DUT.
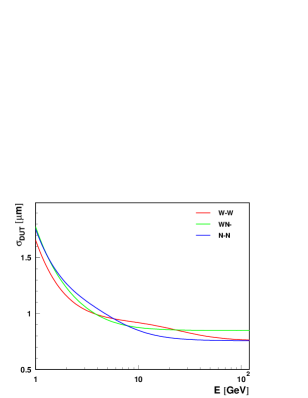
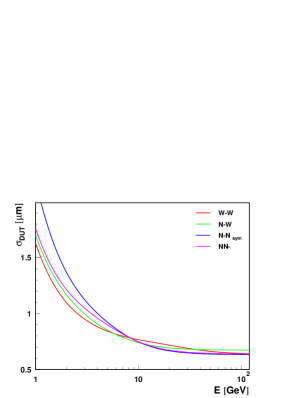
Configurations resulting in the best position measurement, for different beam energies and thicknesses of DUT, assuming high-resolution planes resolution are shown in Figure 18. The expected precision of position determination for these telescope configuration, as a function of the beam energy, is shown in Figure 19, for the DUT thicknesses of 800 and 300, and the distance between the first high-resolution plane and DUT of 5 mm.
The dependence of the optimal configuration choice of the beam energy is similar to the case with one high-resolution plane. At lowest energies, when the effects of multiple scattering are dominant, best measurement is expected with W–W configuration. At highest energies, when effects of the multiple scattering are small, N–N configuration should be chosen. Contrary to the case with one high-resolution plane and to configurations optimal at lower energies, in this case DUT should be placed in the middle between two high-resolution planes.
Including second high-resolution plane significantly improves position resolution. For beam energy of 6 GeV and high-resolution plane resolution expected precision of position determination improves by about 0.1. This is shown in Figure 20 where the position resolution is shown as a function of the assumed DUT thickness, and the high-resolution plane measurement precision, , as obtained in the configuration optimal for given parameter values. Configurations with one and two high-resolution planes are compared. Largest improvement due to second high-resolution plane is expected at highest energies, when multiple scattering can be neglected and the precision is determined by the position measurement errors in telescope sensors (compare Figure 15 and Figure 19).
W–W

N–W

NN–
N–N
m
m
4.4 Results for 1+5 and 2+4 configurations
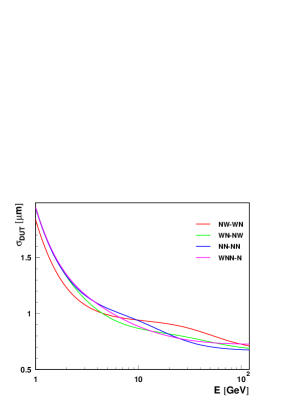
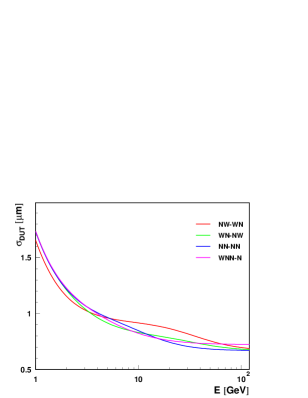
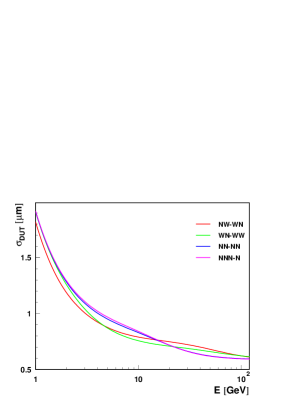
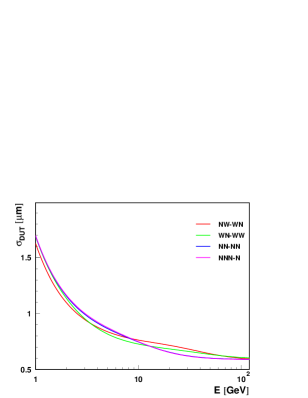
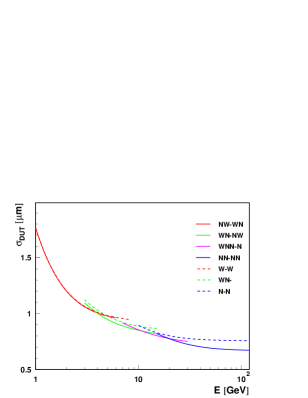
We also considered telescope consisting of 6 sensor planes including one or two high resolution planes (configurations referred to as 1+5 and 2+4). Configurations resulting in the best position measurement, for different beam energies and thicknesses of DUT, assuming high-resolution planes resolution are shown in Figure 21 and Figure 22 respectively.
NW–WN
WN–NW
WNN–N
NN–NN
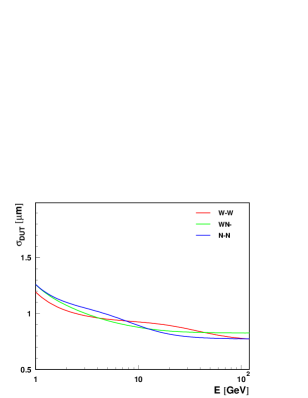
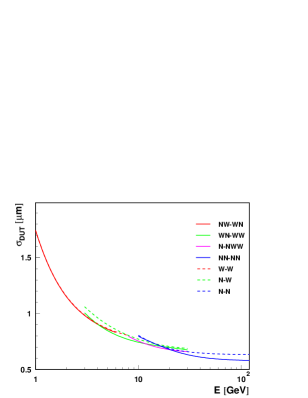
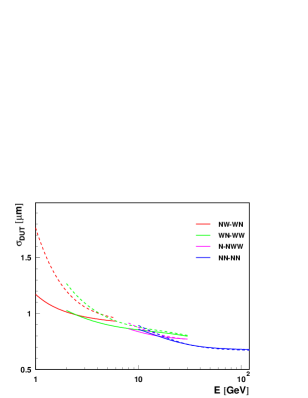
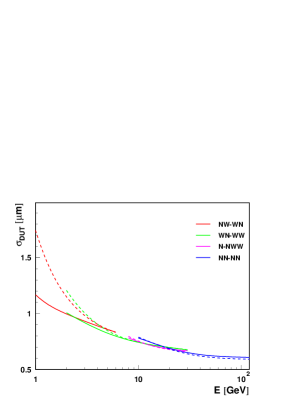
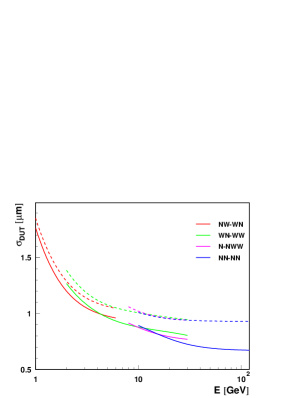
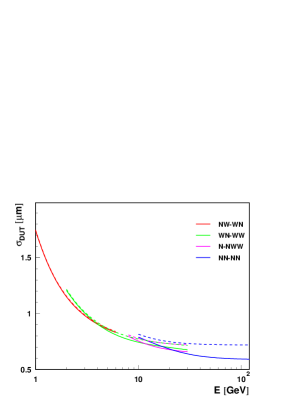
The expected precision of position determination for these configurations, as a function of the beam energy is shown in Figure 23 and Figure 24. DUT thicknesses of 800 and 300 is considered and the distance between the (first) high-resolution plane and the DUT is 5 mm.
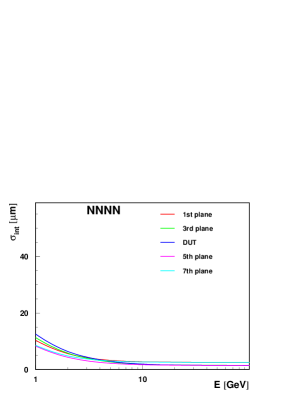
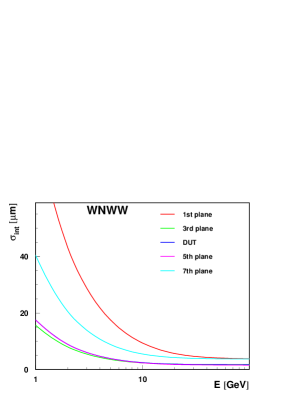
As for 1+3 and 2+2 configurations, the best measurement in the low energy range is expected for the arrangement which provides long ”arms” for precise determination of particle directions before and after DUT. This is required to minimize the error from multiple scattering on the position extrapolation from the sensor planes to DUT. For telescope consisting of six sensor layers it is obtained for the NW–WN configuration. In the intermediate energy range three to five sensor planes should be placed close to DUT. The choice depends on the DUT thickness and differences between different configurations are not large. In the high energy domain the situation is again similar to that for the telescope with four sensor planes. As the position error at DUT is dominated by the position uncertainties in sensor planes it is preferable to put all planes as close to each other as possible, which is denoted as NN–NN configuration. For the NN–NN configuration with two high-resolution planes (2+4) DUT should be placed in the middle between two high-resolution planes, as indicated in Figure 22.
NW–WN
WN–WW

N–NWW

NN–NN
m
m
m
m
4.5 Comparison of different telescope configurations
It is clear that more telescope planes with better position resolution always result in better precision for position determination at DUT. However, it is important to understand which factor results in a significant improvement of telescope performance and which gives only a marginal effect.
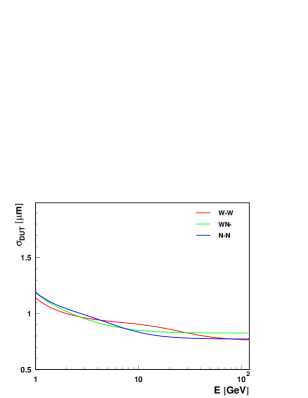
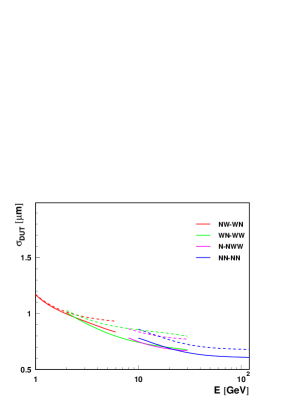
Comparison of the expected position determination precision for telescope with four and six sensor planes is shown in Figure 25. Two additional sensor planes improve position resolution at DUT only for energies above 4 GeV, when more than two planes should be placed close to DUT. The improvement is largest at the highest energies. For lowest energies, when ”wide” configurations are preferred only marginal improvement is observed between W–W and NW–WN configurations.
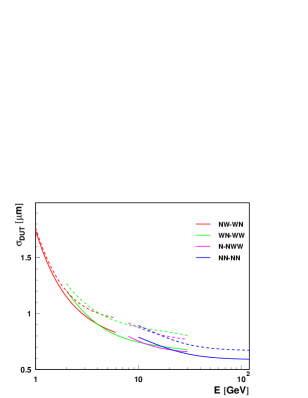
Large improvement, up to about 0.15, is expected due to second high-resolution plane, as shown in Figure 26. Both at the intermediate and at high beam energies precision obtained with two high-resolution sensors is significantly better than with one high-resolution sensor only. In the intermediate energy range, the effect is stronger for the larger distance between DUT and first high-resolution plane. As before, for lowest beam energies, below about 2 GeV, improvement due to second high-resolution plane is marginal. In this energy range the precision is determined by the measurement in the closest telescope plane.
Show in Figure 27 is a comparison of expected position resolution for different distances between the high-resolution plane and DUT. For lowest beam energies minimizing this distance is crucial for the precise position determination. By reducing the distance between first high-resolution plane and DUT from 5 to 2 mm the position uncertainty can be reduced by over 30%. With one high-resolution plane improvement is observed up to energies of about 20 GeV. For highest beam energies configuration with 2 mm distance gives results slightly worse than with 5 mm. This is because more symmetric plane setup is preferred when multiple scattering can be neglected. This is event more visible for configurations with two high-resolution planes. For highest energies best position determination is obtained when DUT is placed in the middle between two high-resolution planes.
One of the considered solutions for standard telescope sensors are the sensors with binary readout. Proposed pitch corresponds to the position resolution of about 5 (see also Section 3.3). Expected precision of position determination at DUT, for standard planes with 2 and 5 resolution, is compared in Figure 28. For telescope with one high-resolution plane, resolution of standard planes have large impact on the expected position reconstruction precision. Effects of up to 30% are expected at high energies. However, if telescope is equipped with two high-resolution planes, no significant loss of resolution is expected below 5 GeV.
5 Telescope alignment studies
All results presented so far were obtained assuming perfect telescope alignment. It could be expected that they remain valid only if the sensor alignment is performed with precision much better than the single plane resolution. Surprisingly, proposed track fitting method turned out to be little sensitive to telescope misalignment.
Simulation results described in Section 3 has been used to verify influence of telescope alignment on the track fitting. Many ’experiments’ were performed by generating random sensor shifts (in the plane perpendicular to the beam direction) according to the assumed alignment accuracy. For each set of plane positions simulated sensor responses were reevaluated and track fit was repeated for every Geant 4 event. Longitudinal position uncertainties should have much smaller effect on the telescope performance and were not considered. Possible plane rotations were also not considered in the presented study.
Shown in Figure 29 are the obtained distributions of position reconstruction error at DUT (the difference between reconstructed and true particle position), for four different sets of telescope plane positions generated assuming alignment uncertainty of 3. For comparison, results obtained assuming perfect telescope alignment are also shown.
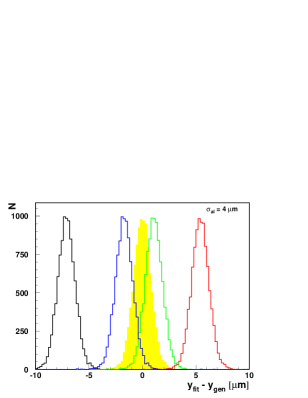
The telescope misalignment results only in the systematic shift in the position determined at DUT. This shift is equivalent to the shift in DUT position. The width of the distribution, which determines the precision of the measurement is unchanged. This follows from the equation (4). Reconstructed position at DUT is given by a linear combination of positions measured in telescope layers, with coefficients (elements of matrix S) depending on the telescope geometry and position resolutions in single planes. Therefor, any constant shift in measured position results in a constant shift in the reconstructed position at DUT.
Although the telescope resolution is not directly affected, alignment uncertainties do influence the track reconstruction. This is because plane misalignment results in large values, not related to the actual measurement. This is illustrated in Figure 30, where distributions for simulated Geant 4 events are shown for four experiments with the assumed alignment uncertainty of 4. For comparison, results obtained assuming perfect telescope alignment are also shown.
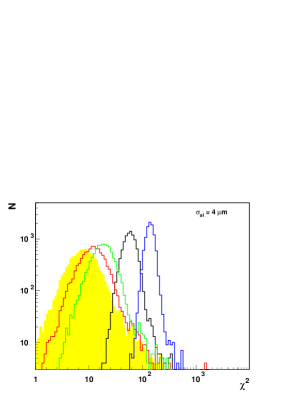
In two of this experiments no event would pass the cut which was imposed to select well fitted events when perfect alignment was assumed (see Section 3). We have to conclude that with large alignment uncertainties cut can no longer be used to remove poorly reconstructed tracks. Therefor, effective telescope resolution can deteriorate slightly. It will also be much more difficult to match hits to the track, if multiple hits are reconstructed in single telescope layer. In order to be able to use as a measure of track quality we should reduce alignment error to the level comparable with position resolution in single telescope planes i.e. few .
Precise telescope alignment, taking into account not only transverse but also longitudinal sensor shifts and rotations, requires dedicated analysis of collected data. However, based on the described track fitting algorithm we can propose a very simple method, which can be used to verify the transverse plane alignment with adequate accuracy.
The expected beam spot size is too large to allow for precise plane positioning. Also the beam direction can not be used as a constraint, due to angular spread of incident beam and multiple scattering in subsequent planes (especially at low energies). Therefor only relative plane positioning is possible. We have to choose two planes and use them as the reference for aligning the remaining sensors.
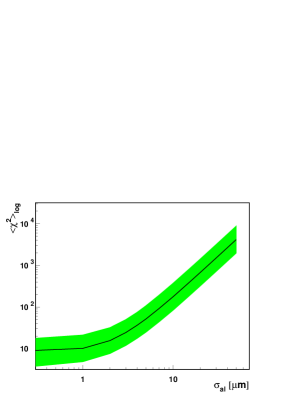
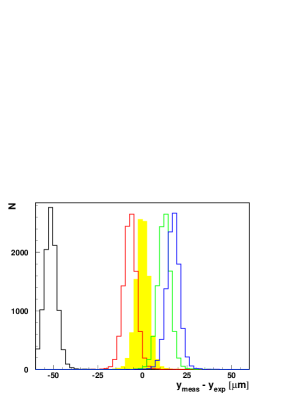
For telescope consisting of seven planes (DUT and six sensors) the best choice is to use second and the last but one plane as a reference. Only for the highest beam energies, when the multiple scattering can be neglected, selecting first and last plane gives slightly better results. Results of multiple Geant 4 simulations with the assumed 10 alignment uncertainty are shown in Figure 32. For each experiment, difference between the particle position measured in the third telescope plane and the expected position (from the fit to the second and last but one plane) has an approximately Gaussian distribution with a width of about 3.6. From this distribution position of the plane can be established with accuracy of the order of already with about 1000 reconstructed particle tracks.
Shown in Figure 33 is the expected precision of particle position determination from the considered fit to two planes, as a function of beam energy. Two telescope configurations are considered, corresponding to smallest (NN-NN) and largest (WN-WW) fit errors. Even for wide telescope configuration and low beam energies, plane alignment with accuracy of the order of 1 should be possible with reasonable event statistics. It is clear that the alignment procedure gives best results for highest beam energy available.
6 Conclusion
The main aim of the presented study was to understand the position measurement in the EUDET pixel telescope and suggest the optimum telescope plane setup, resulting in the best position measurement. Analytical method for particle track fitting with multiple scattering has been developed and verified using Geant 4 simulation. The method gives qualitative improvement as compared to straight line fits, and allows to use all collected events in the analysis analysis. The approach allows for analytical calculation of the expected measurement uncertainty, so the telescope performance could be studied in detail without time-consuming MC simulation.
Telescope performance was studied for setups consisting of four or six readout planes, including one or two high-resolution sensors. For each setup considered, different telescope configurations (corresponding to different distances between planes or different plane order) has been compared. It turned out that the optimum plane configuration is not uniquely defined and depends not only on the telescope parameters but also on the beam energy and the assumed DUT thickness. However, differences between configurations optimal at different parameter ranges are not large. If one configuration has to be chosen, configuration with wide telescope “arms” (W–W or NW–WN) should be used, as it gives much larger gain in resolution at low energies than the loss at higher energies (as compared to other configurations).
It was also confirmed that with appropriate track fitting method configuration with 6 sensor planes always give better position resolution than 4 planes, but the difference is significant only at high energies.
One of the important advantages of the analytical track fitting method is that it is hardly sensitive to telescope misalignment. Transverse displacements of telescope sensors result only in the systematic shift in the reconstructed particle position at DUT, but the position resolution remains unchanged. Therefor, possible small telescope misalignment affects only the track quality estimate based on calculation. For proper selection of good tracks plane alignment with accuracy of few is sufficient. This can be achieved with a simple procedure of relative plane alignment, based on track fitting to two selected planes.
Acknowledgement
This work is partially supported by the Polish Ministry of Science and Higher Education, project number EUDET/217/2006 (2006-2009) and by the Commission of the European Communities under the 6th Framework Programme ”Structuring the European Research Area”, contract number RII3-026126.
References
- [1] More information about the project can be found at the URL http://www.eudet.org/
- [2] More information on the framework programmes of the European Union can be found at the URL http://cordis.europa.eu/
- [3] T. Haas, Nucl.Instrum.Meth.A569:53,2006.
- [4] V.L. Highland, Nucl. Instrum. Methods 129:497, 1975, and Nucl. Instrum. Methods 161:171, 1979; G.R. Lynch and O.I Dahl, Nucl. Instrum. Methods B58:6, 1991.
- [5] G. Lutz, Nucl.Instrum.Meth.A273:349,1988.
- [6] W.Dulinski, private communication.