The influence of anesthetics,
neurotransmitters and antibiotics on the relaxation processes in lipid
membranes
Heiko M. Seeger†, Marie L. Gudmundsson and Thomas
Heimburg∗
The Niels Bohr Institute,
University of Copenhagen, Blegdamsvej 17, 2100 Copenhagen Ø,
Denmark
In the proximity of melting transitions of artificial and
biological membranes fluctuations in enthalpy, area, volume and
concentration are enhanced. This results in domain formation, changes
of the elastic constants, changes in permeability and slowing down of
relaxation processes. In this study we used pressure perturbation
calorimetry to investigate the relaxation time scale after a jump into
the melting transition regime of artificial lipid membranes. This
time corresponds to the characteristic rate of domain growth. The
studies were performed on single-component large unilamellar and
multilamellar vesicle systems with and without the addition of small
molecules such as general anesthetics, neurotransmitters and
antibiotics. These drugs interact with membranes and affect melting
points and profiles. In all systems we found that heat capacity and
relaxation times are related to each other in a simple manner. The
maximum relaxation time depends on the cooperativity of the heat
capacity profile and decreases with a broadening of the transition.
For this reason the influence of a drug on the time scale of domain
formation processes can be understood on the basis of their influence
on the heat capacity profile. This allows estimations of the time
scale of domain formation processes in biological membranes.
keywords: lipid membrane, phase separation,
domain formation, rafts, relaxation, pressure perturbation
calorimetry
abbreviations: DSC,
differential scanning calorimetry; PPC, pressure perturbation
calorimetry; DMPC, 1,2-dimyristoyl-sn-glycero-3-phosphocholine; DPPC,
1,2-dipalmitoyl-sn-glycero-3-phosphocholine; halothane,
3-bromo-2-nchloro-1,1,1-trifluoroethane; serotonin,
5-hydroxytryptamine; MLV, multilamellar vesicle; LUV, large
unilamellar vesicle
∗corresponding author,
theimbu@nbi.dk, http://membranes.nbi.dk
†present address:National Center of CNR-INFM S3, NanoBioLab,
Via G. Campi 213/A, 41100 Modena, Italy
Introduction
Artificial [1, 2, 3] as well biological membranes [1, 4, 5] display melting transitions. In their vicinity fluctuations in lipid area, volume, enthalpy and concentration are enhanced. As a result domains form, the elastic constants are increased [6, 7] and the permeability is higher [8, 9, 10, 11]. A whole variety of molecules like proteins, peptides or other small molecules influence melting transitions. Nowadays biological membranes are seen as being rather heterogenous [12] instead of being homogenous fluids as suggested in the fluid-mosaic model [13]. Heterogeneities of biological membranes due to lipid domain formation have been postulated for many years [14]. In the biology community, however, domain formation has only gained a stronger interest since the discussion about ‘rafts’ [15, 16]. Rafts are thought to be involved into trafficking processes [17]. Domain formation in general is believed to trigger biochemical reaction cascades and to influence enzyme activity [18, 19, 20, 21, 22].
Domains can form as a consequence of melting transitions. Already in the 1970s melting transitions were measured in artificial [2, 3] and in biological membranes [4, 23] using differential scanning calorimetry. The increased fluctuations in the melting regime of membranes are accompanied by changes in the time-scales of the domain formation process. Studies on the kinetics of phase transitions in artificial membranes mainly use temperature and pressure jump techniques [24, 25, 26, 27, 28, 29, 30, 31], but also volume perturbation [32, 33, 34, 35, 36], pH or ion concentration changes [37], ultrasonic measurements [38, 39] and ac-calorimetry [40] were applied. The number of relaxation processes in different studies varies from one to five. Relaxation times in single-lipid membranes were reported to lie in the range from to [41], depending on the experiment and the detection method. Most studies agreed on a slowing down of relaxation processes in the transition regime [24, 26, 38, 27, 28, 41, 33, 31, 39, 34]. It was also pointed out that maximum relaxation times were observed at the transition midpoint. In [31] relaxation processes were connected to macroscopical fluctuations and it was shown that the relaxation times of the cooperative processes and the heat capacity are connected in a simple manner.
In earlier studies, an influence of cholesterol, dibucaine and peptides was found [41, 30, 36, 31], but not systematically investigated. Molecules like general anesthetics, neurotransmitters and antibiotics display a functional role in biological cells. The antibiotic gramicidin A is a hydrophobic, channel-forming peptide [42]. Dimers of this peptide induce channels of an outer diameter of about that is mainly permeable for monovalent cations. Neurotransmitters are molecules which mainly occur in the nerve system, but can also be found in other parts of the body. They influence nerve pulse propagation and are either inhibitory or excitatory. An example of an excitory neurotransmitter is serotonin (5-hydroxytryptamine). Neurotransmitters have been discussed to also act as anesthetics [43]. Anesthesia is the state when pain, consciousness or other sensations are blocked. General anesthetics such as 1-octanol or halothane (2-bromo-2-chloro-1,1,1-trifluoroethane) lead to a reversible complete loss of consciousness and sensation. The action of general anesthetics is still not fully known. Theories favoring an direct influence on protein function are at the moment favored [44, 45, 46], but lipid membrane mediated mechanisms are also discussed. Ueda and Yoshida [47] claim that anesthetics action results from effects on both proteins and lipids and they consider the lipid/water interface. Cantor [48, 49] relates anesthetic function to the influence of anesthetics on the lateral pressure profile of lipid membranes. Heimburg and Jackson [50, 51] attribute anesthetic action to the influence of anesthetics on the lipid membrane state.
Peptides, neurotransmitters and anesthetics all display significant influence on lipid melting transition. This immediately raises questions about these molecules on the macroscopic membrane properties. In this paper, we focussed on the influence of anesthetics, neurotransmitters and antibiotics on the time scales of domain formation processes. This is an extension of a previous study by Grabitz and collaborators [31]. Relaxation processes are related to the cooperative fluctuations. More specifically, it was shown that heat capacity and relaxation times in pure lipid membranes are proportional functions. Here, the study is extended towards lipid systems with the incorporation of drugs. It will be shown that the addition of these molecules does not change the linear relation between heat capacity and relaxation times, but systematically alter the details of the relaxation process. We discuss the biological importance of our findings in relation to the influence of domains on biochemical reaction cascades, enzyme activity, sorting and trafficking in biological membranes.
Materials and Methods
Sample preparation: Lipids were purchased from Avanti Polar Lipids (Birmingham/AL, USA) and used without further purification. All lipid samples were dissolved in a Hepes buffer with EDTA at pH . Samples of multilamellar vesicles (MLVs) were prepared by adding buffer to the lipid powder and stirring the solution above the main phase transition temperature using a magnetic stirrer for at least one hour. During this time the lipid solution was vortexed at least three times. Suspensions of large unilamellar vesicles (LUVs) were prepared using an Avestin extruder system (Avestin Europe GmbH, Mannheim, Germany). Suspensions of MLVs were extruded at using a filter with a pore size of 100nm. DMPC/ neurotransmitter systems were made by adding serotonin (Hydrochloride; Sigma-Aldrich Inc., St. Louis/MO, USA) to the buffer before dissolving the lipids in the buffer/neurotransmitter solution. In the case of DMPC/anesthetics solutions 1-octanol (Sigma-Aldrich Inc., St. Louis/MO, USA) or halothane (2-Bromo-2-chloro-1,1,1-trifluoroethane, Sigma-Aldrich Inc., St. Louis/MO, USA) was added to the already prepared suspension of MLVs. The solution was stirred for another 30 . DMPC/peptide membrane systems were prepared by dissolving the DMPC lipids and gramicidin A as powder in organic solvent (dichloromethane: methanol 2:1). After mixing both solutions the lipid/gramicidin A solution was dried through heating and a light nitrogen or air stream. The sample was kept in a high vacuum desiccator over night. The rest of the preparation equaled the one of preparing suspensions of MLVs.
Calorimetry: Differential scanning calorimetry (DSC) measurements were performed with a VP-DSC from Microcal (Northhampton/MA, USA) using high feedback mode at a scan rate of if not indicated otherwise. A concentration of was used to measure the excess heat capacity profile of a sample directly in the calorimeter cell and determining the transition enthalpy. In other cases sample solutions were filled into self-built pressure cells (see below). In these cases concentrations of either or were prepared. The capillary volume was not exactly known, but with the knowledge of the transition enthalpy we could determine absolute excess heat capacity values. Heat capacity profiles of DMPC/gramicidin A mixtures were determined with scan rates of . Due to hysteresis effects the scan rate has an influence on the temperature of the maximum heat capacity. Curves were corrected correspondingly. Sample solutions and buffer solutions were degassed for at least before the calorimetric experiments to avoid measurement artifacts arising from possibly evolving gas bubbles.
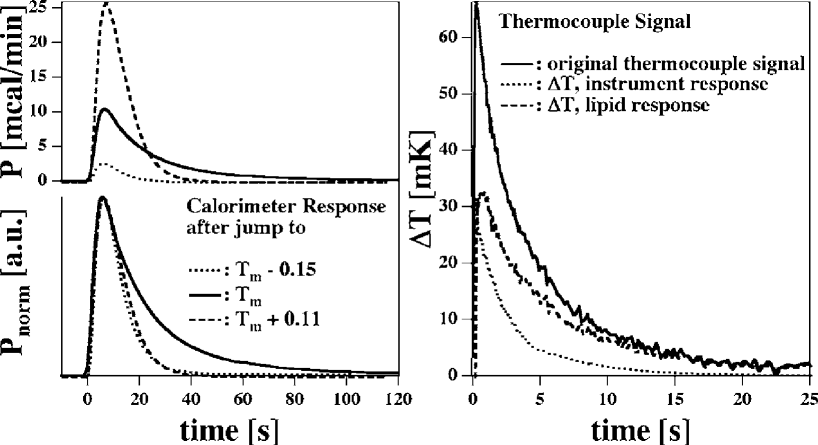
Pressure perturbation calorimetry: The same calorimeter was used for pressure perturbation calorimetry (PPC) experiments in the isothermal mode of the calorimeter. Measurements on solutions of MLVs were performed as previously described [31]. The sample solution was filled into a self-built pressure capillary which can hold pressures up to . This capillary was inserted into the sample cell of the calorimeter. The melting transition regime shifts upon addition of hydrostatic pressure by about 1K/40bar (see [52] and [7] with citations therein). This is used to perturb the system. Pressure is controlled through addition or release of high pressure nitrogen by opening and closing manual or solenoid pressure valves (Nova Swiss, Effretikon, Switzerland). The change of pressure occurs on a time scale of around . Changing the pressure on the lipid dispersions by and an appropriate choice of temperature allowed to jump to different points of the phase coexistence regime where domains started to form. Jumps into the transition regime were either from below the transition (; negative pressure jump) or from above the transition (; positive pressure jump)e. In the first case the signal is endothermic, while in the other case it is exothermic. After a pressure change the calorimeter needs to compensate the heat absorption or release to keep the sample temperature constant. This response contains information about the relaxation times of the domain formation process. Representative calorimetric responses after negative pressure jumps () are shown in the left panel of fig. 1 (top). The curves are results after jumps to different points of the transition defined by different sample temperatures. The area below the curves, i.e. the total heat absorption of the lipid membranes during the equilibration process increases the further one jumps through the transition (here: increasing temperature). The normalized signals show that the relaxation process occurs on different time scales (fig. 1, bottom). A sample cell containing buffer solution also results in a characteristic response. This is the response function of the instrument. The observed calorimetric signal from the equilibration process is the convolution of the real signal (called the “sample response”) with the instrument response function. The response after a pressure jump always contained one small component that contain the perturbation of the pressure cell itself and small contributions from lipid membrane processes faster than the resolution of the instrument. The dominant part of the signal consists of a single exponentially decaying heat absorption or release from the lipid membranes after a perturbation. Faster relaxation processes only contribute to a minor degree to the overall signal (see discussion concerning Fig. 6). The above method allows a time resolution of about .
The relaxation times of lipid dispersions are related to the heat capacity. Broader melting profiles display smaller heat capacity values in the transition. Under these conditions faster relaxation processes are found (Grabitz2002) for which the resolution of may not be good enough. For this reason, a refined experimental setup with increased time resolution was used especially for measurements on LUV dispersion that display melting peaks that are about 10 times broader than the MLV transitions. We only performed positive pressure jumps. The pressure release or addition was controlled by two computer controlled solenoid valves (Nova Swiss, Effretikon, Switzerland) and the time scale of the pressure relaxation was faster than . The pressure cell consisted of two capillaries instead of only one. A K-thermocouple with a grounded hot junction of a diameter of (Thermocoax, Stapelfeld, Germany) was put into the sample capillary of the pressure cell. Relaxation times were determined from a direct measurement of changes in temperature of the sample solution after the pressure jump. The thermocouple signal was amplified by a Nanovolt Preamp Model 1801 (Keithley Instruments Inc., Cleveland/OH, USA) and recorded by a Keithley Multimeter 2001 (Keithley Instruments Inc., Cleveland/OH, USA).
As in the case analyzing the calorimeter response the total temperature change is seen as a convolution of the “instrument response” and the “sample response”. This is displayed in the right panel of fig. 1. The total temperature change (solid curve) after a positive pressure jump can be divided into a change due to the “instrument response” (dotted curve) and the “lipid response” (dashed curve). The latter one is again modeled by a convolution of a single exponentially decaying heat release of the lipid membrane and the instrument response. For details we refer to [31, 53]. The contribution from the sample cell (only filled with water) was subtracted from the total temperature change and only the remaining signal was analyzed.
Pressure perturbation calorimetry experiments were always conducted on a few successive days. Melting profiles were controlled after each measuring day. During these days heat capacity curves sometimes broadened slightly or shifted towards higher or lower temperatures. The shift could be easily corrected later. Below it will become obvious that a broadening of the curve means that relaxation times are influenced. The broadening, however, was small so that the determination of relaxation times was in the range of experimental error.
Theory
In an earlier paper from our laboratory a theory of the relaxation times of lipids in the melting regime was derived on the grounds of non-equilibrium thermodynamics [31]. This theory made use of the experimental fact that enthalpy, volume and area are proportional functions in this temperature regime. Therefore, perturbation of the lipid samples by temperature, bulk or lateral pressure results in the same relaxation process. It was found that one expects a proportional relation between relaxation time and excess heat capacity.
The theory is based on the assumption that the distribution of enthalpy states at a given temperature can be described by a Gaussian distribution. This is correct when the system is a continuous transition that is neither of first order nature nor at a critical point:
| (1) |
where is the enthalpy, is the mean enthalpy and is the variance. The Gibb’s free energy depends logarithmical on this distribution [54]: . Using this one finds that the entropy can be approximated as a harmonic potential:
| (2) |
where is the gas constant.
Throughout a melting transition changes in area, volume and enthalpy are proportional and, therefore, one only finds one independent fluctuation given by . The thermodynamic force driving the lipid sample back to equilibrium (after a perturbation) is given by , and the flux of heat by . This is in fact the observable in our calorimetric experiments. According to Onsager [55, 56] the flux is proportional to the thermodynamics force. Therefore
| (3) |
using the phenomenological constant L. This leads to a simple differential equation that is solved by an exponential decay
| (4) |
introducing the relaxation time . Using the identity (fluctuation theorem) one arrives at
| (5) |
where is the temperature and is a phenomenological constant. The constant L has to be obtained from experiments. For the details of the derivation we refer to [31]. Note, however, that in the cited paper a factor of was omitted in the derivation so that an unit error occurred. This, however, does not change the message of the previous paper that relaxation times and heat capacity are proportional functions.
Results
The non-equilibrium thermodynamics theory briefly outlined above predicts a proportionality between heat capacity and relaxation times for the cooperative processes with large excess heat capacity. Important for this prediction is the cooperative nature of the process rather than the chemical composition of the membrane. In [31] it is shown for different one component lipid systems (MLV and LUV) and a DMPC/cholesterol mixture (MLV) that one finds a linear relationship between heat capacity and relaxation times in pressure perturbation calorimetry. Maximum relaxation times are up to about a minute and they are decreased by the addition of cholesterol in a manner closely related to the effect of cholesterol on the heat capacity profile. In the present study we extended the range of the membrane systems. In particular, we investigated the influence of small drugs on domain formation processes and the related relaxation times. For this it was necessary to improve the time resolution of our calorimetric relaxation measurements. The latter part is important for large unilamellar membrane systems that display smaller heat capacities and broader transitions than multilamellar preparations.
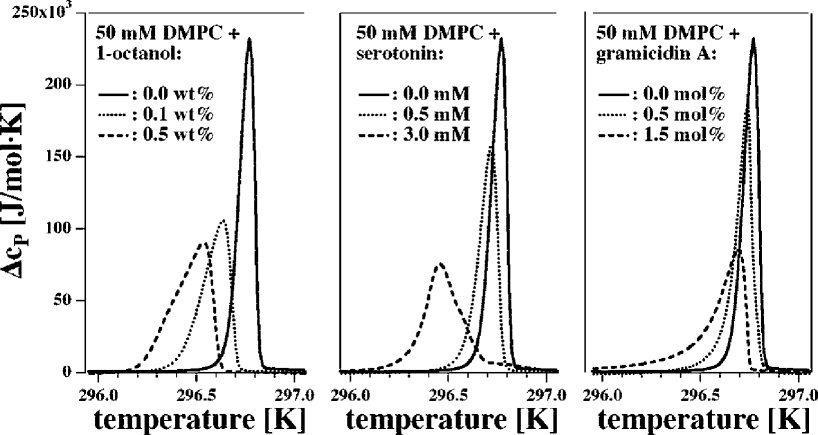
First, we determined the influence of molecules such as general anesthetics, neurotransmitters and antibiotics on the melting behavior of lipid membranes by differential scanning calorimetry. In fig. 2 the heat capacity profiles of multilamellar DMPC vesicles with different concentrations of 1-octanol (left panel), serotonin (center panel) and gramicidin A (right panel) are displayed. The transition enthalpy of these systems was determined to be . The general finding is that the addition of the respective molecules broadened the transition profile and shifted it to lower temperatures. The total melting enthalpy remains unaltered. In the following we wanted to understand in which way relaxation processes were influenced in the respective systems.
In fig. 3 heat capacity profiles and relaxation times of a DMPC (MLV) solution are displayed. The heat capacity curve shown is the same as in fig. 2. Relaxation times were determined from measurements using the same lipid dispersion as for the DSC scans. The melting transition profile of lipid membranes with increased pressure was shifted to higher temperatures, whereas the shape of the profile was not influenced. Therefore, the relaxation time profile obtained from positive pressure jumps were temperature corrected with (open squares). Results from negative pressure jumps are given by open circles. The time resolution of the setup is indicated by a dashed line. Relaxation times faster than this experimental response time cannot be determined accurately.
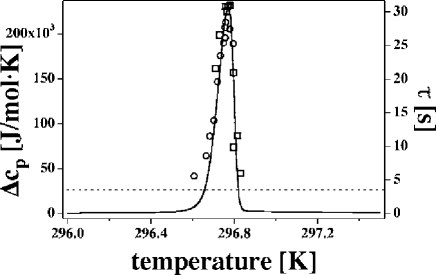
Comparison of heat capacity and relaxation times shows the linear relation of these two functions. In the proximity of the melting transition relaxation processes slows down. The maximum relaxation time measured is about . With a maximum heat capacity value of and the temperature at the transition midpoint of we found a phenomenological constant (see eq. 5) of . The previous experiment was performed while recording the heat compensation of the calorimeter (with a time resolution of about 4 seconds). Performing experiments on a new suspension of DMPC (MLV) and evaluating the temperature change with the thermocouple inserted into the pressure cell (with a time resolution of about 0.3 seconds) after a positive pressure jump of yielded a phenomenological constant of . Both phenomenological constants obtained agree within error with each other. This demonstrates that our two different setups record the same time scales.
In the following we investigated in which way other small molecules and peptides influence the relaxation behavior of lipid membranes. Therefore, we performed experiments adding different concentrations of the anesthetic 1-octanol, the neurotransmitter serotonin and the antibiotic gramicidin A to the DMPC lipid membranes. As seen in fig. 2 these molecules broadened the melting transition regime and shifted it to lower temperatures. This has also an influence on the relaxation behavior of the lipid membranes. In fig. 4 measurements on the three different systems are displayed. Heat capacity profiles are taken from fig. 2. Results were obtained from analyzing the calorimetric response after jumps of . Results from negative and positive pressure jumps are not indicated by different symbols. The dashed line always indicates the time resolution of the setup. Both heat capacity and relaxation time scale of the different panels are different. In all cases we found a proportionality between heat capacity and relaxation times. Phenomenological constants were calculated to be (DMPC plus wt % 1-octanol), (DMPC plus mM serotonin) and (DMPC plus mM gramicidin A), i.e. within error L is independent of the system. Note that deviations close to 3-4 seconds are most likely a consequence of the finite time resolution of the experiment.
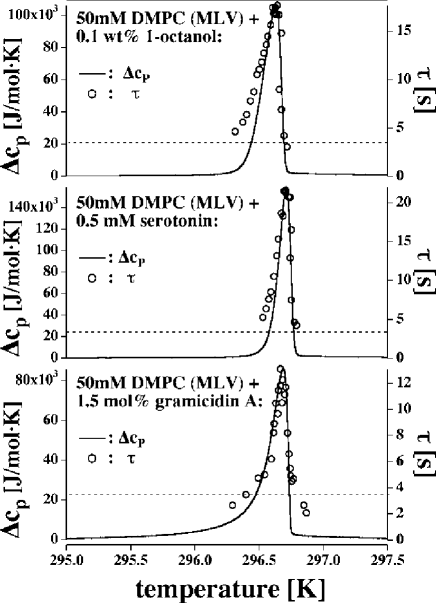
A series of PPC experiments were performed using different concentrations of the respective molecules (data not shown). The maximum relaxation times obtained and the phenomenological constants determined are displayed in table 1. As it is seen in fig. 2 the addition of the chosen small drugs led to a broadening of the heat capacity curves and to a decrease in the maximum heat capacity value. The maximum relaxation time was influenced in the same way as is the maximum heat capacity value. The whole relaxation time profile behaves the same as does the heat capacity curve. The addition of molecules alter the relaxation behavior of lipid domain formation in a systematic way.
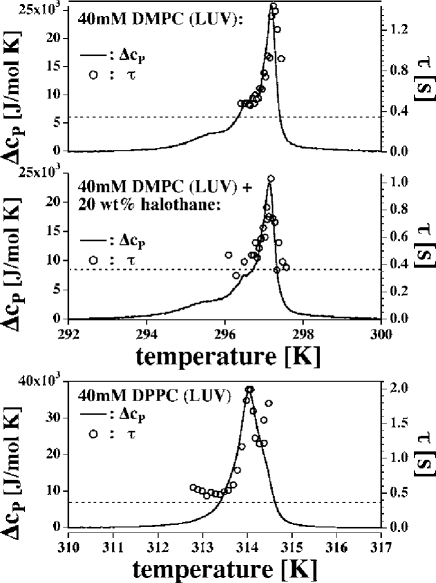
Further experiments were conducted on solutions with large unilamellar vesicles. We investigated LUVs of DMPC lipids with and without addition of the anesthetics halothane. We also studied LUVs of DPPC. The respective heat capacity values and relaxation times are plotted in fig. 5. Relaxation times were obtained using a thermocouple inserted into the pressure cell using positive pressure jumps. The dashed line represents the time resolution of the setup. In all cases we found again that heat capacity and relaxation times are proportional to each other. Halothane has a similar effect on the melting behavior as the anesthetic octanol. It broadened and shifted the heat capacity curve to lower temperatures. The maximum relaxation time was again decreased compared to that of the DMPC LUVs without halothane. The phenomenological constants for the LUV systems are somewhat higher than those of the MLVs (see table 5). The phenomenological constants obtained from measurements on MLVs suggest that there is a constant independent of the lipid membrane composition. The same is true for LUVs, while we calculated different phenomenological constants for MLVs and LUVs. From our results we calculated averaged phenomenological constants of (MLVs) and (LUVs). The reason for this is unknown. One can speculate on whether relaxation processes are influenced by volume changes of the vesicles in the case of LUV or by bilayer-bilayer interactions in the case of MLV.
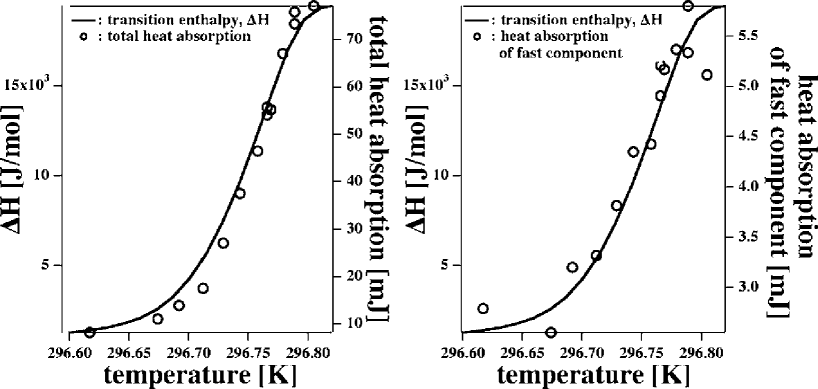
In the literature up to five relaxation processes in the time range from to were reported for one lipid component systems [41]. In this study we assumed only one relaxation time, which describes domain formation processes. In order to test whether there are contributions from faster relaxation processes we analyzed the heat absorption after negative pressure jumps as a function of temperature in comparison to the transition enthalpy obtained from scanning calorimetry. The transition enthalpy of the DMPC (MLV) solution (see the heat capacity profile in fig. 2) is shown as a solid curve in the left and right panel of fig. 6. The total heat absorption is displayed in the left panel of fig. 6. It is proportional to the transition enthalpy. All relaxation data contained contributions of a fast component with a time scale corresponding to the instrument response time. The heat absorption due to this component also showed a proportionality to the transition enthalpy (right panel of fig. 6). This means that at least one faster relaxation process is present which occurs on a time scale faster than our experimental time resolution. Analyzing all measurements we found that the contribution of faster relaxation processes is lower than of the total heat absorption. Using the thermocouple signal as a detection method we did not detect faster relaxation processes.
| Lipid Membrane System | ||
|---|---|---|
| DMPC (MLV) | ||
| + 1-octanol (MLV) | ||
| + 1-octanol (MLV) | ||
| + serotonin (MLV) | ||
| + serotonin (MLV) | ||
| + gramicidin A (MLV) | ||
| + gramicidin A (MLV) | ||
| DMPC (MLV) | ||
| DMPC (LUV) | ||
| + halothane (LUV) | ||
| DPPC (LUV) |
In total we can state that domain formation processes are related to fluctuations in enthalpy at large excess heat capacities. Relaxation times and heat capacity are linear functions (within error). This linear relation is still true in the presence of drugs. However, the temperature dependence of both heat capacity and relaxation times are altered by drugs in a simple systematic manner. Fast relaxation processes contribute less than 10% to the overall heat. Thus, they probably do not represent the fluctuations in domain size linked to the lipid chain state.
Discussion
The melting of lipid membranes is a cooperative event involving many lipid molecules. Within the melting transition one finds domain formation, but also changes in the elastic constants. If pressure, temperature or any other relevant intensive thermodynamic variable is slightly changed, the lipid system changes its state and domains grow or shrink while absorbing or releasing significant amounts of heat. Thus, the domain formation process can be followed by monitoring the heat change. If we talk about relaxation times within the lipid melting transitions we therefore basically refer to the time scale of domain growth. These processes have been studied by some groups before using calorimetry [33, 34, 35, 36, 31]. One typically finds slow relaxation in transitions. This phenomenon is known as ‘critical slowing-down’.
Studies of relaxation processes in artificial membranes by use of pressure perturbation calorimetry have been performed by our group before [31]. We used the same and a refined version of the setup as described in [31] to extend the previously published studies. Relaxation processes in LUVs and the influence of small drugs on the relaxation behavior of lipid domain formation in LUVs and MLVs were investigated. The typical time scales of domain formation processes are related to cooperative fluctuations in enthalpy and in all systems we found a proportionality between heat capacity and relaxation times. The relaxation processes depend on the final state rather than on the initial state. A remarkable finding is that the drugs used modulate the time-scale of domain formation processes in a similar manner as they influence the heat capacity profiles. They tend to broaden both heat capacity profiles and relaxation time profiles. After addition of anesthetics, neurotransmitters and antibiotics the maximum relaxation time is decreased in the same way as is the maximum heat capacity value . Therefore, these drugs alter static and kinetic aspects of domain formation.
Our findings support the theoretical prediction from Grabitz et al. [31] that heat capacity and relaxation time display a linear relation not only for pure lipid membranes, but also for membrane mixtures and mixtures with drugs that associate with membranes. The proportional constant between relaxation time and heat capacity takes the form , where L is an phenomenological coefficient originating from Onsager’s phenomenological equations. We calculated average phenomenological constants to be for MLVs and for LUVs made of DMPC and DPPC. The constant L is different for MLV and LUV by about a factor of 2.5. Surprisingly, however, the addition of drugs does not change the phenomenological constant for a given vesicular system even though they have significant influence on the heat capacity profiles. With measurements on suspensions of multilamellar DMPC vesicles we obtained phenomenological constants of and using the two different detection methods. They agree within error. Thus, the difference in result does not seem to be related to the method of detection. We do not know the origin the difference between MLV and LUV. However, MLV display much more cooperative transitions because of coupling between adjacent membranes. The fluctuations therefore contain a coupling in the third dimension that might cause small differences in the relaxation behavior. The difference may also be related to the change of vesicle size while changing the lipid membrane state and area. This may involve permeation of water into the vesicles.
Anesthetics, neurotransmitters and antibiotics influence the melting behavior of lipid membranes. The anesthetic octanol shifts profiles to lower temperatures. Long chain alcohols (with chain length larger than 10) shift them to higher temperatures [57]. The latter ones do not display anesthetic potency. Other anesthetics like halothane (this study and unpublished data) or methoxyflurane [58] also lead to a decrease of the melting temperature. It has been stated that clinically relevant concentrations show effects on the shift of melting temperatures [58]. The effective potency of an anesthetic is correlated to its ability to deplete melting transition temperatures [59]. Serotonin possibly also acts as an anesthetic [43] and influences the phase melting transition. This has also been shown for other neurotransmitters, like GABA (-aminobutyric acid), dopamine, caffeine and fluoxetin [60]. The interactions with peptides or proteins and other small molecules like anesthetics and neurotransmitters influence the domain structuring of lipid membranes in the phase melting transition regime [61]. All these molecules influence relaxation processes in a systematical way.
In previous studies kinetic aspects of melting transitions in artificial single-component lipid membranes have been studied with a whole variety of different techniques. This study, however, is the first one systematically investigating the effects of various small drugs on relaxation processes in single lipid membranes and relating it to the enhancement of fluctuations in the transition regime. Van Osdol and co-workers [36] studied the effect of the anesthetics dibucaine on relaxation processes. They claimed that even though dibucaine clearly shows an influence on the melting behavior only a small alteration of relaxation processes has been found. This finding does not agree with ours, where we have found that the drugs influence relaxation processes similar to their influence on the heat capacity.
In other studies relaxation times faster than the ones we measured and up to five relaxation processes were reported [24, 25, 26, 28, 29, 62, 41, 38, 39]. Different spectroscopic detection methods were used. Previously, it has been discussed that some of the experiments might have problems with a well-defined temperature, due to the necessity of having windows for the detection. These might act as heat sinks [31]. In favor of longer relaxation times are estimations using ac-calorimetry [40]. The authors found relaxation times faster than (MLV of DMPC) and (MLV of DPPC). They, however, did not give relaxation times in dependence of temperature. As mentioned, relaxation processes have been reported from the to minute regime. One reason might lie in an inaccurate temperature control in many optical methods. However, another reason, which seems likely to us is that the different detection methods probe different relaxation processes. In [41] the different relaxation times where assigned to relaxation processes reflecting chain properties like the formation of kinks, free rotations of headgroups or the formation of complex rotational isomers and to macroscopical properties, i.e. the formation of clusters. Our study does not exclude the existence of several faster relaxation processes, but the focus was only on one relaxation process, namely the formation of domains which is responsible for most of the heat absorption. We found evidence that there is at least one faster relaxation process which has a minor contribution to the total heat absorption (less than 10%). Most previous studies agreed on a slowing down of relaxation processes in the melting transition regime [24, 26, 38, 27, 28, 41, 33, 31, 39, 34].
Biological membranes also display melting transitions [4, 23]. From the knowledge of the phenomenological constant and the excess heat capacity profile were estimated relaxation times in the melting transition regime of biological membranes [31]. The authors used a DSC measurement of bovine lung surfactant from Ebel et al. [7] and a phenomenological constant similar to the one for DMPC and DPPC MLV vesicles. They estimated that relaxation times in biological membranes would lie in a time regime of up to in the transition regime. We have calculated two different phenomenological constants for MLVs and LUVs but the order of magnitude is unaffected. The time regime of these domain formation processes is in a regime which seems to be important in biology. These relaxation times do not only give the typical time scales of domain formation processes, but also the life time of domains. Domains are subject to fluctuations [61] and the smaller they are the shorter their life time. Very broad melting profiles typically result in small domains. In the ongoing discussion on ’rafts’ this may be of some relevance. Their size is thought to be smaller than 100 [16] and therefore should they display short life times. Additional to their small size the short life time may make it difficult to really detect them.
Domain formation processes in general have been argued to be important in the control of biochemical reaction cascades in biological membranes [18, 19, 20, 21, 22]. Since drugs like anesthetics, neurotransmitters and antibiotics also alter the lateral membrane structure and relaxation times they might show an indirect action on enzymatic processes. For several enzymes it has been shown that the existence of domains is necessary for their function [63, 64, 65, 66, 67, 68, 69]. In the case of phospholipase is was stated that the magnitude of fluctuations determines the activity of the enzyme [70]. It may be easier for the phospholipase to reach the target site at the lipid when the fluctuations are large. The kinetics of lateral membrane structure might generally act as a control of biochemical reactions and their time scales.
The action of general anesthetics is still not fully understood. Many
groups presently favor a picture where anesthetics directly influence
the function of proteins [44, 45, 46]. Theories about the action of general
anesthetics mediated by the lipid membrane are put forward by several
other groups [48, 49, 50, 51]. The later models are in our opinion
more convincing because the action of anesthetics is known to be
linearly related to their solubility in lipid membranes, including the
noble gas Xenon that is inert and therefore unlikely to have specific
interactions with macromolecules. Thinking about lipid-mediated
anesthesia, a possible implication of our findings might be related to
ion permeation through lipid bilayers. The predicted relaxation time
of biological membranes in the several 10 ms range is just the typical
time scale of the opening and closing of ion channel proteins.
Recently, several groups started to argue that the lipid environment
has a direct influence on the channel opening statistics
[71, 72, 73]. For this reason
anesthetics and neurotransmitters may display an indirect influence on
these proteins via their action on the lipid membrane. This implies
that the channel lifetimes may be coupled to the relaxation time
scales of the lipid membranes, in particular since they are obviously
of right order. It was also reported that permeation through pure
lipid bilayers in the absence of proteins is enhanced in the melting
transition regime and reaches a maximum at a temperature of maximum
heat capacity. This finding was related to the magnitude of
fluctuations [8, 9, 10]. Measurements on black lipid membranes in the
melting transition regime yielded characteristic fluctuations of the
transmembrane ion currents
[74, 75, 76]. No such
currents were found for lipid membranes at temperatures well above or
below the transition midpoint temperature of one component lipid
membranes [75]. The life times of
these lipid pores within the phase transition regime were found to be
as long as several seconds, in agreement with the relaxation time
scales found by us.
In this study we have shown that relaxation times of domain formation
processes in simple model systems are proportional to the excess heat
capacity. Relaxation processes slow down in the melting regime.
Several drugs studied by us broaden the melting transition profiles
and shift them to lower temperatures. This influences the relaxation
behavior in a simple manner. This is presumably true for all drugs,
peptides and proteins influencing the melting behavior of lipid
membranes. Clearly, the free energy of membranes includes the
chemical potentials of all membrane associated molecules and it is
therefore just a consequence of thermodynamics that the functions of
states change in a coherent manner due to the change in one of these
variables. This is likely to be of great importance for the general
understanding of the function of biological membranes.
Acknowledgments
HM.S. was supported by the Deutsche Forschungsgemeinschaft (DFG; grant HE1829/11-1).
References
- [1] Steim, J. M., M. E. Tourtellotte, K. C. Reinert, R. N. McElhaney, and R. L. Rader. 1969. Calorimetric evidence for the liquid-crystalline state of lipids in a biomembrane. Proc. Natl. Acad. Sci. USA 63:104.
- [2] Chapman, D. 1971. Liquid crystalline properties of phospholipids and biological membranes. Symp. Faraday Soc. 5:163–174.
- [3] Hinz, H.-J., and J. M. Sturtevant. 1972. Calorimetric studies of dilute aqueous suspensions of bilayers formed from synthetic l--lecithins. J. Biol. Chem. 247:6071–6075.
- [4] Melchior, D. L., and J. M. Steim. 1976. Thermotropic transitions in biomembranes. Ann. Rev. Biophys. Bioeng. 5:205–238.
- [5] Heimburg, T., and A. D. Jackson. 2005. On soliton propagation in biomembranes and nerves. Proc. Natl. Acad. Sci. USA 102:9790–9795.
- [6] Heimburg, T. 1998. Mechanical aspects of membrane thermodynamics. estimation of the mechanical properties of lipid membranes close to the chain melting transition from calorimetry. Biochim. Biophys. Acta 1415:147–162.
- [7] Ebel, H., P. Grabitz, and T. Heimburg. 2001. Enthalpy and volume changes in lipid membranes. I. The proportionality of heat and volume changes in the lipid melting transition and its implication for the elastic constants. J. Phys. Chem. B 105:7353–7360.
- [8] Papahadjopoulos, D., K. Jacobsen, S. Nir, and T. Isac. 1973. Phase transition in phospholipid vesicles. Fluoresence polarization and permeability measurements conerning the effect of temperature and cholesterol. Biochim. Biophys. Acta 311:330–348.
- [9] Nagle, J. F., and H. Scott. 1978. Lateral compressibility of lipid mono- and bilayers. Theory of membrane permeability. Biochim. Biophys. Acta 513:236–243.
- [10] Cruzeiro-Hansson, L., and O. G. Mouritsen. 1988. Passive ion permeability of lipid membranes modelled via lipid-domain interfacial area. Biochim. Biophys. Acta 944:63–72.
- [11] Antonov, V. F., A. A. Anosov, V. P. Norik, and E. Y. Smirnova. 2005. Soft perforation of planar bilayer lipid membranes of dipalmitoylphosphatidylcholine at the temperature of the phase transition from the liquid crystalline to gel state. Eur. Biophys. J. 34:155–162.
- [12] Jacobson, K., E. D. Sheets, and R. Simson. 1995. Revisiting the fluid mosaic model of membranes. Science 268:1441–1442.
- [13] Singer, S., and G. L. Nicolson. 1972. The fluid mosaic model of the structure of cell membranes. Science 175:720–731.
- [14] Sackmann, E., 1984. Biological Membranes, Academic Press, chapter Physical Basis of Trigger Processes and Membrane Structure, 105–143.
- [15] Brown, D., and E. London. 1998. Functions of lipid rafts in biological membranes. ARCDB 14:111–136.
- [16] Simons, K., and W. L. Vaz. 2004. Model systems, lipid rafts, and cell membranes. ARBMS 33:269–295.
- [17] Helms, J. B., and C. Zurzolo. 2004. Lipids as targeting signals: Lipid rafts and intracellular trafficking. Traffic 5:247–254.
- [18] Melo, E. C., I. M. Lourtie, M. B. Sankram, and T. E. Thompson. 1992. Effects of domain connection and disconnection on the yields of in-plane bimolecular reactions in membranes. Biophys. J. 63:1506–1512.
- [19] Vaz, W. L., and P. F. F. Almeida. 1993. Phase topology and percolation in multi-phase lipid bilayers: Is the biological membrane a domain mosaic? Curr. Opin. in Struct. Biol. 3:482–488.
- [20] Thompson, T., M. Sankram, R. Biltonen, D. Marsh, and W. Vaz. 1995. Effects of domain structure on in-plane reactions and interactions. Mol. Membr. Biol. 12:157–162.
- [21] Hinderliter, A., R. L. Biltonen, and P. F. Almeida. 2004. Lipid modulation of protein-induced membrane domains as a mechanism for controlling signal transduction. Biochemistry 43:7102–7110.
- [22] Salinas, D. G., M. D. L. Feunte, and J. G. Reyes. 2005. Changes of enzyme activity in lipid signaling phathways related to substrate reordering. Biophys. J. 89:885–894.
- [23] Jackson, M. B., and J. M. Sturtevant. 1977. Studies of the lipid phase transitions of Escherichia coli by high sensitivity differential scanning calorimetery. J. Biol. Chem. 252:4749–4751.
- [24] Träuble, H. 1971. Phasenumwandlungen in Lipiden. Mögliche Schaltprozesse in Biologischen Membranen. Naturwissenschaften 58:277–284.
- [25] Tsong, T. Y. 1974. Kinetics of the crystalline-liquid crystalline phase transition of dimyristoyl l--lecithin bilayers. Proc. Natl. Acad. Sci. USA 1974:2684–2688.
- [26] Tsong, T. Y., and M. I. Kanehisa. 1977. Relaxation phenomena in aqueous dispersions of synthetic lecithins. Biophys. Chem. 16:2674–2680.
- [27] Gruenewald, B., A. Blume, and F. Watanabe. 1980. Kinetic investigations on the phase transition of phospholipid bilayers. Biochim. Biophys. Acta 597:41–52.
- [28] Elamrani, K., and A. Blume. 1983. Phase transition kinetics of phosphatidic acid bilayers. A pressure jump relaxation study. Biochemistry 22:3305–3311.
- [29] Holzwarth, J. F., and F. Rys. 1984. Beobachtung einer kritischen Trübung und Verlangsamung am Hauptphasenübergang von Phospholipid-Membranen, bestimmt mit der Laser-Temperatursprungmethode. Prog. Coll. Pol. Sci. 69:109–112.
- [30] Blume, A., and M. Hillmann. 1986. Dimyristoylphosphatidic acid/cholesterol bilayers. Thermodynamic properties and kinetics of the phase transition as studied by the pressure jump relaxation technique. Eur. Biophys. J. 13:343–353.
- [31] Grabitz, P., V. P. Ivanova, and T. Heimburg. 2002. Relaxation kinetics of lipid membranes and its relation to the heat capacity. Biophys. J. 82:299–309.
- [32] Johnson, M. L., T. C. Winter, and R. L. Biltonen. 1983. The measurement of the kinetics of lipid phase transitions: A volume perturbation kinetic calorimeter. Analyt. Biochem. 128:1–6.
- [33] van Osdol, W. W., R. L. Biltonen, and M. L. Johnson. 1989. Measuring the kinetics of membrane phase transition. J. Bioener. Biophys. Methods 20:1–46.
- [34] van Osdol, W. W., M. L. Johnson, Q. Ye, and R. L. Biltonen. 1991. Relaxation dynamics of the gel to liquid crystalline transition of phosphatidylcholine bilayers .effects of chainlength and vesicle size. Biophys. J. 59:775–785.
- [35] van Osdol, W. W., O. L. Mayorga, and E. Freire. 1991. Multifrequency calorimetry of the folding/unfolding transition of cytochrome c. Biophys. J. 59:48–54.
- [36] van Osdol, W. W., Q. Ye, M. L. Johnson, Q. Ye, and R. L. Biltonen. 1992. Effects of the anesthetic dibucaine on the kinetics of the gel-liquid crystalline transition of dipalmitoylphosphatidylcholine multilamellar vesicles. Biophys. J. 63:1011–1017.
- [37] Strehlow, U., and F. Jähnig. 1981. Electrostatic interactions at charged lipid membranes. Kinetics of the electrostatically triggered phase transition. Biochim. Biophys. Acta 641:301–310.
- [38] Mitaku, S., and T. Date. 1982. Anomalies of nanosecond ultrasonic relaxation in the lipid bilayer transition. Biochim. Biophys. Acta 688:411–421.
- [39] Halstenberg, S., W. Schrader, P. Das, J. Bhattacharjee, and U. Kaatze. 2003. Critical fluctuations in the domain structure of lipid membranes. J. Chem. Phys. 118:5683–5691.
- [40] Yao, H., H. Nagano, Y. Kawase, and K. Ema. 1994. Slow relaxation process in the main phase transition of phosphatidylcholines studied with heat capacity spectroscopy. I. Multilamellar vesicles. Biochim. Biophys. Acta 1212:73–79.
- [41] Holzwarth, J. F., 1989. The Enzyme Catalysis Process: Energetics, Mechanism and Dynamics, Plenum Publishing Group, chapter Structure and Dynamics of Phospholipid Membranes From Nanoseconds to Seconds, 383–411.
- [42] Gennis, R. B., 1989. Biomembranes. Molecular Structure and Function. Springer.
- [43] Cantor, R. S. 2003. Receptor desensitization by neurotransmitters in membranes: Are neurotransmitters the endogenous anesthetics? Biochemistry 42:11891–11897.
- [44] Franks, N., and W. Lieb. 1994. Molecular and cellular mechanisms of general anaesthesia. Nature 367:607–614.
- [45] Krasowski, M., and N. Harrison. 1999. General anesthetic action on ligand-gated ion channels. Cell. Mol. Life Sc. 55:1278–1303.
- [46] Bovill, J. G. 2000. Mechanisms of anaesthesia: Time to say farewell to the Meyer-Overton rule. Curr. Opin. Anaesth. 13:433–436.
- [47] Ueda, I., and T. Yoshida. 1999. Hydration of lipid membranes and the action mechanisms of anesthetics and alcohols. Chem. Phys. Lip. 101:65–79.
- [48] Cantor, R. S. 1997. The lateral pressure profile in membranes: A physical mechanism of general anesthesia. Biochemistry 36:2339–2344.
- [49] Cantor, R. S. 2001. Breaking the Meyer-Overton rule: Predicted effects of varying stiffness and interfacial activity on the intrinsic potency of anesthetics. Biophys. J. 80:2284–2297.
- [50] Heimburg, T., and A. D. Jackson. 2007. On the action potential as a propagating density pulse and the role of anesthetics. Biophys. Rev. Lett. 2007, in print (arXiv:physics/0610117) .
- [51] Heimburg, T., and A. D. Jackson. 2007. The thermodynamics of general anesthesia. Biophys. J., in print (arXiv:physics/0510106) .
- [52] Mountcastle, D., R. L. Biltonen, and M. Halsey. 1978. Effect of anesthetics and pressure on the thermotropic behavior of multilamellar dipalmitoylphosphatidylcholine liposomes. Proc. Natl. Acad. Sci. USA 75:4906–4910.
- [53] Seeger, H. M., 2006. Kinetics of Domain Formation Processes in Lipid Membranes. Ph.D. thesis, University of Göttingen.
- [54] Lee, J., and J. Kosterlitz. 1991. Finite-size scaling and Monte Carlo simulations of first-order phase transitions. Phys. Rev. B 43:3265–3277.
- [55] Onsager, L. 1931. Reciprocal relations in irreversible processes. I. Phys. Rev. 37:405–426.
- [56] Onsager, L. 1931. Reciprocal relations in irreversible processes. II. Phys. Rev. 38:2265–2279.
- [57] Tamura, K., Y. Kaminoh, H. Kamaya, and I. Ueda. 1991. High pressure antagonism of alcohol effects on the main phase-transition temperature of phospholipid membranes: Biphasic response. Biochim. Biophys. Acta 1066:219–224.
- [58] Trudell, J. R., D. Payan, J. Chin, and E. Cohen. 1975. The antagonistic effect of an inhalation anesthetic and high pressure on the phase diagram of mixed dipalmitoyl-dimyristoylphosphatidylcholine bilayers. Proc. Natl. Acad. Sci. USA 72:210–213.
- [59] Kharakoz, D. P. 2001. Phase-transition driven synaptic exocytosis: A hypothesis and its physiological and evolutionary implications. Bioscience Rep. 21:801–830.
- [60] Pollakowski, D., 2003. Thermodynamische und Strukturelle Untersuchungen an künstlichen und biologischen Membranen. Grundlegende Eigenschaften und der Einfluss kleiner Moleküle. Master’s thesis, University of Göttingen.
- [61] Seeger, H. M., M. Fidorra, and T. Heimburg. 2005. Domain size and fluctuations at domain interfaces in lipid mixtures. Macro. Symposia 219:85–96.
- [62] Genz, A., and J. F. Holzwarth. 1986. Dynamic fluorescence measurements on the main phase transition of dipalmytoylphosphatidylcholine vesicles. Eur. Biophys. J. 13:323–330.
- [63] Kamp, J. A. F. O. D., J. D. Gier, and L. V. Deenen. 1974. Hydrolysis of phosphatidylcholine liposomes by pancreatic phospholipase A2 at the phase transition temperature. Biochim. Biophys. Acta 345:253–256.
- [64] Kamp, J. A. F. O. D., M. T. Kauerz, and L. V. Deenen. 1975. Action of pancreatic phopsholipase A2 on phosphatidylcholine bilayers in different physical states. Biochim. Biophys. Acta 406:169–177.
- [65] Gabriel, N. E., N. V. Agman, and M. F. Roberts. 1987. Enzymatic hydrolysis of short-chain leithin/long-chain phospholipid unilamellar vesicles: Sensitivity of phospholipases to matrix phase state. Biochemistry 26:7409–7418.
- [66] Lichtenberg, D., G. Romero, M. Menashe, and R. L. Biltonen. 1986. Hydrolysis of dipalmytoylphosphatidylcholine large unilamellar vesicles by porcine pancreatic phospholipase A2. J. Biol. Chem. 261:5334–5340.
- [67] Burack, W. R., and R. L. Biltonen. 1994. Lipid bilayer heterogenities and modulation of phospholipase A2 activity. Chem. Phys. Lip. 73:209–222.
- [68] Bolen, E. J., and J. J. Sando. 1992. Effect of phospholipid unsaturation on protein kinase C activation. Biochemistry 31:5945–5951.
- [69] Dibble, A. R. G., A. K. Hinderliter, J. Sando, and R. L. Biltonen. 1996. Lipid lateral heterogeneity in phosphatidylcholine/phosphatidylserine/diacylglycerol vesicles and its influence on protein kinase C activation. Biophys. J. 71:1877–1890.
- [70] Biltonen, R. L. 1990. A statistical thermodynamic view of cooperative structural changes in phospholipid bilayer membranes: Their potential role in biological function. J. Chem. Thermodynamics 22:1–19.
- [71] Turnheim, K., J. Gruber, C. Wachter, and V. Ruiz-Gutierrez. 1999. Membrane phospholipid composition affects function of potassium channels from rabbit colon epithelium. Am. J. Physiol. Cell Physiol. 277:83–90.
- [72] Cannon, B., M. Hermansson, S. Györke, P. Somerharju, and J. A. Virtanen. 2003. Regulation of calcium channel activity by lipid domain formation in planar lipid bilayers. Biophys. J. 85:933–942.
- [73] Schmidt, D., Q.-X. Jiang, and R. MacKinnon. 2006. Phospholipids and the origin of cationic gating charges in voltage sensors. Nature 444:775–779.
- [74] Antonov, V., V. Petrov, A. Molnar, D. Predvoditelev, and A. Ivanov. 1980. The appearance of single-ion channels in unmodified lipid bilayer membranes at the phase transition temperature. Nature 283:585–586.
- [75] Antonov, V. F., A. A. Anosov, V. P. Norik, and E. Y. Smirnova. 2005. Soft perforation of planar bilayer lipid membranes of dipalmitoylphosphatidylcholine at the temperature of the phase transition from the liquid crystalline to the gel state. Eur. Biophys. J. 34:155–162.
- [76] Kaufmann, K., W. Hanke, and A. Corcia, 1989. Ion Channels. Ion Channel Fluctuation in Pure Lipid Bilayer Membranes: Control by Voltage. http://membranes.nbi.dk/Kaufmann/pdf/Kaufmann_book3_ed.pdf. Caruaru.