Modeling the selective partitioning of cations into negatively charged nanopores in water
Abstract
Partitioning and transport of water and small solutes into and through nanopores is important to a variety of chemical and biological processes and applications. Here we study water structure in negatively charged model cylindrical [carbon nanotube (CNT)-like] nanopores as well as the partitioning of positive ions of increasing size (, , and ) into the pore interior using extensive molecular dynamics simulations. Despite the simplicity of the simulation system – containing a short CNT-like nanopore in water carrying a uniformly distributed charge of surrounded by () cations, making the overall system charge-neutral – the results provide new and useful insights on both the pore hydration and ion partitioning. For , that is, for a neutral nanopore, water molecules partition into the pore and form single-file hydrogen-bonded wire spanning the pore length. With increasing , water molecules enter the pore from both ends with preferred orientations, resulting in a mutual repulsion between oriented waters at the pore center, and creating a cavity-like low density region at the center. For low negative charge densities on the pore, the driving force for partitioning of positive ions into the pore is weak, and no partitioning is observed. Increasing the pore charge gradually leads to partitioning of positive ions into the pore. Interestingly, over a range of intermediate negative charge densities, nanopores display both thermodynamic as well as kinetic selectivity toward partitioning of the larger and ions into their interior over the smaller ions. Specifically, the driving force is in the order , and and ions enter the pore much more rapidly than ions. At higher charge densities, the driving force for partitioning increases for all cations – it is highest for ions, and becomes similar for and ions. The variation of thermodynamic driving force and the average partitioning time with the pore charge density together suggest the presence of free energy barriers in the partitioning process. We discuss the role of ion hydration in the bulk and in the pore interior as well as of the pore hydration in determining the barrier heights for ion partitioning and the observed thermodynamic and kinetic selectivity.
I Introduction
Understanding thermodynamics and kinetics of partitioning of small molecules into nanoscopic pores or confined spaces of molecular dimensions is important to a wide range of chemical and biological processes and applications Sholl and Johnson (2006); Hummer et al. (2001); Eijkel and van den Berg (2005); Holt et al. (2006). The pores of interest can be smooth cylindrical (carbon nanotube-like) Ajayan and Iijima (1993) or slit-pores (between flat surfaces) Gelb et al. (1999), or may have complex geometries as observed in biological pores Murata et al. (2000); Doyle et al. (1998), in activated carbon, and in other nanoporous materials Raman et al. (1996). When exposed to solution, such materials can selectively extract and/or allow transport of specific solute molecules into and through their pores, depending on the pore-solvent, pore-solute, and solute-solvent interactions. Successful bottom-up design of such selective systems can be aided by fundamental understanding of the interplay of these interactions in idealized model systems. Molecular dynamics simulations are an excellent tool to build and simulate such model systems aimed at fumdamental understanding.
Here we are interested in partitioning of simple spherically symmetric ionic solutes into interior of charged hollow cylindrical pores of well defined dimensions in the nanometer range. Such a model system is relevant not only to electrostatically driven molecular separations or nanofluidic applications, but also to development of energy storage devices, such as carbon supercapacitors, that use ion adsorption on the surface of highly porous materials to store charge. A recent experimental study by Chmiola et al. Chmiola et al. (2006) shows that carbide-derived carbon materials with pore sizes from 0.6 to 2.25 nm when used as a negative electrode, can partition tetraethylammonium cations (0.68 nm in diameter) into the pore. The closer approach of partially dehydrated cations to the nanoporous electrode surface leads to significantly enhanced capacitance of these materials.
Our simulation system contains a nanopore (modeled by a carbon nanotube-like cylindrical pore) in water carrying a uniformly distributed charge of surrounded by () cations (either , , or ), making the overall system charge-neutral. We perform extensive nonequilibrium simulations focused on the kinetics of partitioning, which show that negatively charged nanopores can be selective toward partitioning of the larger and ions and can exclude the smaller ions over a range of nanopore charge densities. We complement those simulations with equilibrium free energy calculations of ion hydration in bulk water and in the hydrated nanopore interior. These calculations along with analysis of ion hydration shell fluctuations highlight the role of free energy barriers as well as equilibrium free energy of partitioning which together are expected to govern the rate of ion transport through selective pores.
II Simulation Details
Simulations of ion partitioning into nanopores: We used a piece of (5,5) armchair carbon nanotube (CNT)-like pore comprising 100 carbons [with the pore diameter (i.e., C-C distance) of 6.7 Å and length 11 Å] as a model cylindrical pore. A total charge of (where is the magnitude of electronic charge) was distributed uniformly on the pore atoms, such that each atom carries a charge of -. The nanopore was placed in a solution containing 500 explicit water molecules and cations, thus, making the overall system electrically neutral. Note that our goal is not to model specifically a CNT, but use its cylindrical geometry as a model for a cylindrical pore. A realistic model of CNT would need to consider the chemistry of rim atoms, non-uniform distribution of charges (in case of charged nanotubes) Keblinski et al. (2002), etc.
The present systems contain cations, but no explicit anions (the pore with its charge acts as a large anion). In realistic systems, anions (e.g., chloride ions) will be present in the salt solution. For , we simulated the present system with excess salt (i.e., with additional few pairs of NaCl, KCl, or CsCl) ions. The results on partitioning of cations in this system were similar to the ones reported here, suggesting that the trends on partitioning reported here will be unaffected.
Simulations were performed using AMBER6.0 Pearlman et al. (1995), using TIP3P Jorgensen et al. (1983) model of water, and Lennard Jonesium (LJ) description of carbon (atom type CA) Pearlman et al. (1995); Kalra et al. (2004). Ions were represented as LJ spheres with ion charge placed at the center Straatsma and Berendsen (1988): Å, kJ/mol, Å, kJ/mol, and Å, kJ/mol. Ion-water and ion-carbon LJ interactions were calculated using Lorentz-Berthelot mixing rules Allen and Tildesley (1987). Periodic boundary conditions were applied and the particle mesh Ewald method Darden et al. (1993) was used to calculate the electrostatic interactions with a grid spacing of 1 Å. Temperature and pressure were maintained at 300 K and 1 atm, respectively, using the Berendsen method Berendsen et al. (1984). A time step of 1 fs was used in all the simulations.
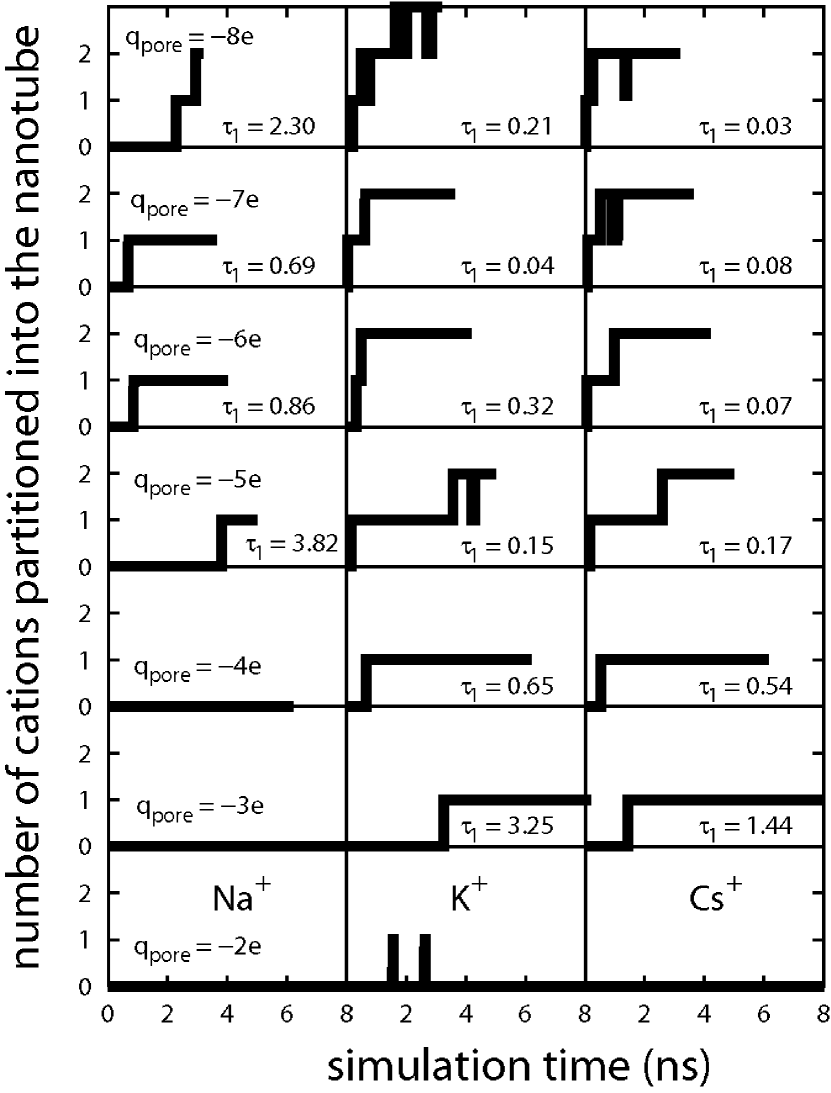
Selective partitioning of cations into nanopores: A given system contains a carbon nanotube-like pore carrying a total charge of , water, and cations. We monitored the number of cations partitioned into the nanopore as a function of time for different values of (see Figure 1). Separate simulations were performed for through in steps of , for each cation. At the beginning of each production run (marked ), each cation in the system was at least 9 Å away from the atoms of the model nanopore. To obtain an estimate of the partitioning time (or the first passage time for partitioning), each simulation was run for a sufficiently long time. For lower charge densities on the nanopore, the electrostatic driving force is low, and extended simulations of neutral and near neutral () nanopores show that ions are excluded from the pore interior, consistent with previous studies Kalra et al. (2003); Peter and Hummer (2005); Mao et al. (1999). For higher charge densities on the pore, not only is the electrostatic driving force higher, but the ion concentration outside the tube is slightly higher as well (by the way the system is constructed), which likely further increases the driving force. Thus, with increasing we expect ions to partition into the pore, with the time required for partitioning decreasing with the pore charge density. Correspondingly, for simulations were performed for 24/ nanoseconds each.
III Results and Discussion
Kinetics of ion partitioning: Figure 1 shows the number of cations partitioned into the pore for various charge states of the pore observed in different nonequilibrium simulation runs. For , the charge density on the nanopore is sufficiently small and none of the ions partitions into the pore over the timescale of 12 ns. It is only for we observe partitioning of one ion into the pore in the specific set of runs shown in Figure 1. In contrast, and ions partition into the pore for . At higher values of , we observe partitioning of the second and third (in case of ) cation into the charged nanopore. To obtain more quantitative estimates of the kinetics of partitioning, we performed 10 independent nonequilibrium simulations for each ion type starting with different initial configuration for . Each of these simulations were run until the first cation partitions well into the pore, which for was longer than 25-30 ns each for several runs with ions. We define as the waiting time for the first cation to partition into the nanopore. Table 1 lists average, , and standard deviation, of the waiting time distribution obtained from 10 simulations. Although a larger number of simulations may be needed to obtain more accurate estimates of waiting time distributions, trends in our data are already clear and interesting. For example, for , ion takes 25 times longer to partition into the pore (18 ns) compared to that for and ions (0.7-0.8 ns). As the charge on the nanopore is increased, partitioning of occurs over shorter timescales, and correspondingly, the values for both and ions are small and decrease somewhat further. Thus, from kinetic perspective, over a range of charge densities, the nanopore is selective toward partitioning of the larger ions and over the smaller ion , and increasing the driving force significantly (i.e., increasing ) appears to decrease that selectivity somewhat. To understand the ion partitioning at a more fundamental level, we investigate below the structural and thermodynamic aspects of the partitioning process.
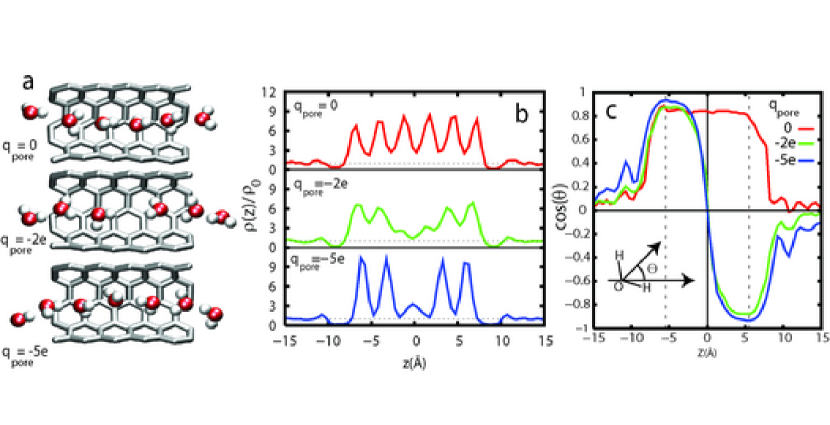
Water structure in neutral and charged pores: Filling and emptying transitions of water into neutral nanotubes have been studied previously Hummer et al. (2001); Waghe et al. (2002). For the carbon-water LJ parameters used here, water molecules partition into the tube and form a single-file hydrogen bonded wire, in which each water molecule donates and accepts one hydrogen bond to and from its neighbors on the left and right (Figure 2a). The length of the tube is such that only four water molecules completely fit inside the tube. However, the hydrogen-bonding interactions of the boundary water molecules with those inside the tube are sufficiently strong. As a result, one water molecule on each side of the tube also maintains its position and orientation consistent with those in the tube. Correspondingly, the water density profile along the tube axis shows six clearly defined peaks (Figure 2b).
Water molecules in the hydrogen-bonded wire have one of their OH bond vectors aligned approximately with the pore axis and pointing in the positive direction. Properties of such hydrogen bonded wires have been studied especially for their ability to transport protons at fast rates Dellago et al. (2003). The dipole vector OM of each water molecule makes an angle of 35 degrees with the pore axis [] (Figure 2c). We note that the mirror image of the chain with all OH vectors pointing in the negative direction is equally likely due to two-fold symmetry Waghe et al. (2002).
The effects of charging the nanopore on the structure of water inside the pore are interesting. For , that is, when the charge on each carbon is , water molecules enter the pore with both of their hydrogen atoms pointing inward and the HOH planes roughly parallel to the pore axis (Figure 2a) Waghe et al. (2002). As the chains from the two ends meet at the center, there is significant electrostatic repulsion between them. As a result, water density is depressed at the center of the pore as indicated by the significant reduction in the heights of the two central peaks (Figure 2b). Water is effectively expelled from that region, creating a molecular scale void or a cavity. This expulsion in similar to that observed recently in simulations of charged plates in water Vaitheeswaran et al. (2005). The other peaks are also less well defined. As the charge on the nanopore is increased, the stronger water-nanopore interactions lead to a partial filling of the internal cavity. In the interior of these charged nanopores, water molecules flip the orientation as we traverse the pore from left to right as indicated by the profile (Figure 2c). A similar change in orientation of water molecules is observed in the aquaporin protein channel, which has positively charged regions at the opening and the exit to block transport of protons Murata et al. (2000); Tajkhorshid et al. (2002).
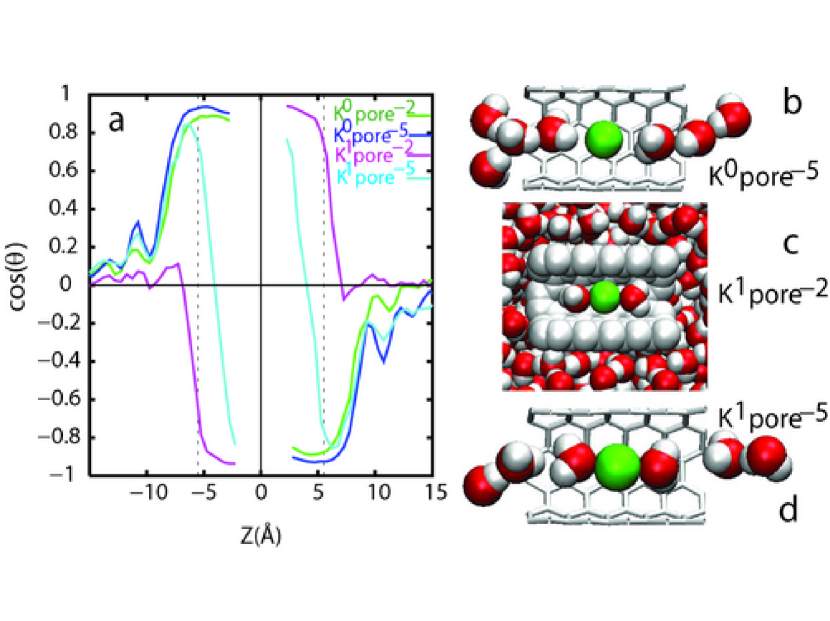
The low density region at the center of a charged pore is only a few angstroms wide and presents an ideal location for cations partitioned into the pore. The lower water density in the cation sized region ensures lower repulsive interactions without the loss of attractive interactions with vicinal waters. Indeed, analysis of density distribution of cations confirms that the most favorable position for the partitioned cations is at the pore center. The cation-water electrostatic interactions are strong and affect orientations of the vicinal waters. Figure 3 shows the effects of competitive water-water, water-nanopore, and water-cation interactions on water orientations. When the charge on the cation at the pore center is turned off, e.g., for Pore-2e case, water orientations are dictated solely by the water-nanopore electrostatic interactions. However, when the charge on the potassium ion is turned on, i.e., for the Pore-2e case, the water-potassium interactions dominate and flip the orientations of two vicinal water molecules such that their oxygens point toward the ion. Interestingly, the repulsion between these two water molecules in ion’s shell and others located at the pore ends leads to a low density area at the pore entry (see Figure 3c). When the nanopore charge is increased to , the water-nanopore interactions become comparable to water-potassium interactions, and only the two water molecules vicinal to the ion point their oxygens toward the ion, and the pore entry region gets filled again (Figure 3d).
Thermodynamics of ion partitioning: The free energy of ion transfer from bulk water to nanopore interior quantifies the thermodynamic driving force for ion partitioning. The excess free energy of hydration, , can be divided into two parts: , where is the excess chemical potential of hydration of electrically neutral LJ solutes, and is the free energy of charging that solute to its final charge state ( here). We used test particle insertions Widom (1963, 1982) of neutral LJ solutes in bulk water and at the center of a charged hydrated nanopore to obtain the contribution. As described previously in detail Hummer et al. (1996); Garde et al. (1998), calculation of the was done using the cumulant expansion method which requires two simulations, one in the uncharged and another in the fully charged state of the solute in bulk water as well as in the nanopore interior. Such calculations were performed for all three cations for nanopore charge of , , and . For reference, we also calculated and contributions in a system containing a charged nanopore in vacuum, in the absence of water molecules. Comparison of these values to those in the hydrated nanopore systems provides insights into the role of water in ion solvation, especially in the confining pore interior region.
Table 2 lists values and for , , and ions in bulk water, in the hydrated nanopore interior, and at the center of nanopore in vacuum for different charge states of the nanopore. In bulk water, the is smallest (i.e., most favorable) for ion, and increases with the ion size. This is expected because the is dominated by repulsive interactions (or the cavity formation process). Compared to that in bulk water, value in the interior of the hydrated nanopore with charge is smaller for ion (expected), somewhat higher for ion, and almost doubles of the ion (unexpected). This is surprising because we expect that the presence of a low density region in the hydrated nanopore will reduce, and not increase the value for all ions. The trends become clear, however, when we consider calculated for ions in a nanopore in vacuum. They indicate that the interior pore of the (5,5) nanopore used here is small; it is large enough to accommodate ion comfortably, but overlaps slightly with the ion, and significantly with the ion.
The advantage arising from the presence of a cavity at the center of the hydrated nanopores becomes clear when we compare the sum of in bulk water and in bare nanopore to that in hydrated nanopore. For all ions, that value in hydrated nanopores is smaller than the sum of bulk water and bare nanopore values. Only for the highest charge density on the nanopore, the two approach each other as the central cavity gets gradually filled with water. Thus, based on differences between in bulk water and in the hydrated nanopore, we would expect the hydrated nanopore interior to be most favorable for the smallest ion and least favorable for the largest ion. This is contrary to the kinetic behavior observed in Figure 1. To understand the role of electrostatic interactions and of hydration, below we focus on differences in contribution for the three ions.
Table 2 shows that in bulk water phase, is large and negative (i.e., favorable) for all ions. It is most favorable for ion, equal to -420 kJ/mol, and decreases in magnitude as the ion size increases, consistent with previous calculations Rajamani et al. (2004). In vacuum, the electrostatic interaction between cations and the negatively charged nanopore is highly favorable and is almost identical for all ions. Minor differences in the energy values in vacuum arise due to slight differences in the location of ions. Ions are placed at their most probable locations obtained from ion partitioning data in the hydrated charged nanopores. The charging free energy of ions in the hydrated charged nanopores is also large and negative. However, its magnitude is smaller than that in vacuum calculations. In the charged and hydrated nanopore, water molecules from either side point their hydrogen atoms toward the center. Charging of a neutral LJ solute located at the center to charge partially reorients those water molecules to more favorable ion-water configurations. This effect can be viewed as “competitive solvation”, where the cation and the pore both compete for the same water molecules for their solvation. As a result, although the net value of for ion solvation is negative, it is smaller in magnitude compared to that inside the nanopore in vacuum. Sodium ion, with its small size, and higher charge density is able to fit in, as well as orient vicinal water molecules in the pore such that the overall reduction (compared to that in vacuum) is smaller compared to that for potassium and cesium ions.
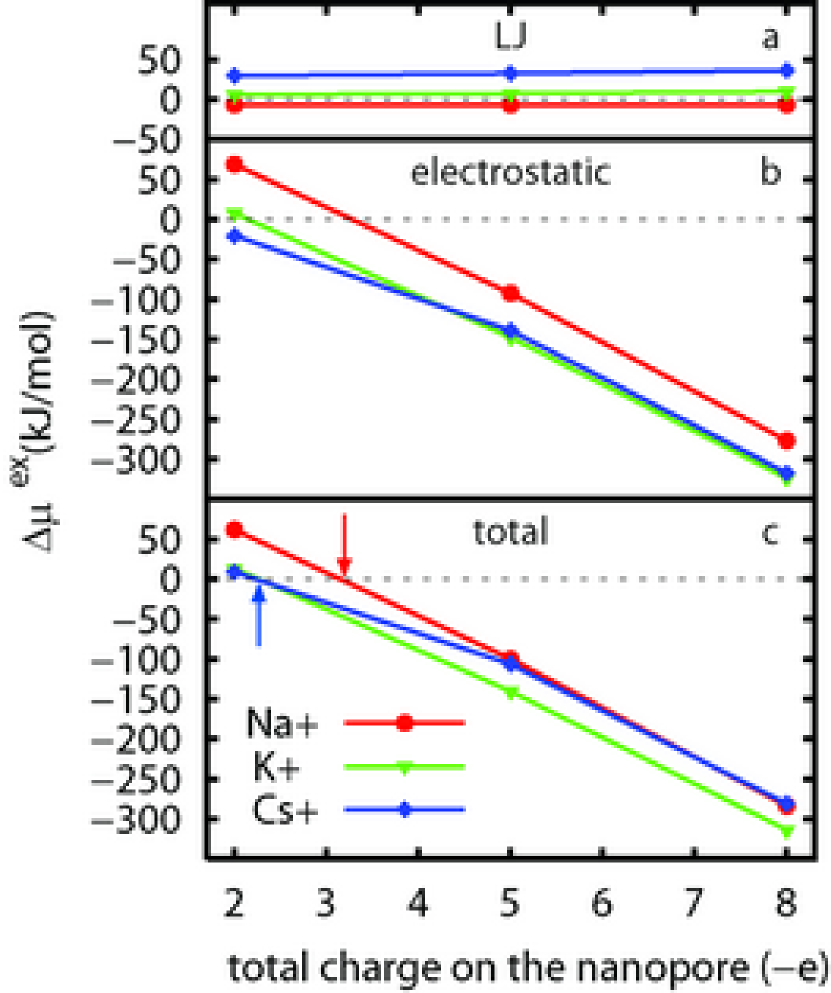
The sum, , determines the overall driving force for ion partitioning into the pore. The difference of ion hydration free energy in the hydrated nanopore interior and in bulk water is the water-to-nanopore transfer free energy, and is listed in Table 3 as well as shown in Figure 4 for different charge states of the nanopore. For , the transfer free energy for all ions is positive (unfavorable) consistent with the observation from Figure 1 that none of the ions partitions into the pore over 12 ns timescale. For and ions, the electrostatic contribution is unfavorable; that is, the overall ion-water-nanopore interactions do not compensate for the loss of ion-water interactions in the bulk water. In contrast, for ion, it is the contribution that is unfavorable as expected from the somewhat larger size of that ion relative to the nanopore internal diameter.
Increasing the charge density on the nanopore increases the strength of cation-nanopore interactions, making the pore interior increasingly favorable for all three cations. At a sufficiently high value of nanopore charge (e.g., ), the ion-nanopore electrostatic interactions are large and negative for all ions indicating that it is thermodynamically favorable for all three types of ions to partition into the pore. The free energy varies approximately linearly with the nanopore charge, and the threshold value of charge at which the transfer free energy changes from positive to negative can be estimated from Figure 4. That threshold charge value is near for and ions, and somewhat larger () for the ion. That is for nanopore charge of slightly larger than , partitioning of and ions will be quite favorable, whereas that of ion unfavorable, providing a significant thermodynamic selectivity for partitioning of those larger ions over the smaller ion. At high nanopore charge densities, although partitioning of all ions into the nanopore is favorable, the ions appears to benefit from its optimal size (compared to the nanopore diameter) and corresponding hydration free energy in water. The balance of LJ and electrostatic interactions for ion in bulk water and in the nanopore interior are such that its partitioning is most favored at higher nanopore charge densities.
Based on the large thermodynamic driving force at charge densities greater than , we would expect partitioning of all three ions into the charged nanopores. Corresponding average partitioning times are listed in Table 1. It is clear that the timescale for partitioning of ions for is significantly larger than that for and ions, which partition over subnanosecond timescales. The expected partitioning of in pores with total charge of would take even longer time, well beyond the scope of present simulations. Thus, the thermodynamic and kinetic data suggest the existence of a free energy barrier for the ion partitioning process, the height of which is different for different ions. Below we discuss possible physical origins of that barrier.
Possible origins of the free energy barrier based on the dehydration of ions: The diameter of the nanopore is small, just sufficient to accommodate the cations. As seen in Figure 3, only two water molecules are available for direct hydration of ions partitioned into the pore. In contrast, the number of water molecules in the hydration shell of cations in bulk water is larger, approximately 5.3, 7, and 8, for , K +, and ions, respectively, consistent with previous simulation and experimental studies Carrillo-Tripp et al. (2003); Rempe and Pratt (2001); Driesner et al. (1998); Ohtaki (2001). Ions thus undergo significant dehydration as they partition into the nanopore. As the ion approaches the end of the nanopore from outside, the ion-nanopore interactions partially compensate for the loss of ion-water interactions. One would require numerous simulations of the partitioning process or apply a combination of methods such as the transition path sampling Bolhuis et al. (2002) and umbrella sampling Torrie and Valleau (1977); Kumar et al. (1992) to obtain detailed structural insights into the transition state, the appropriate reaction path, and the free energy along that path. We have not performed that analysis here. However, monitoring fluctuations of the number of hydration shell water molecules for cations in bulk water provides qualitative insights into the origin of the free energy barrier.
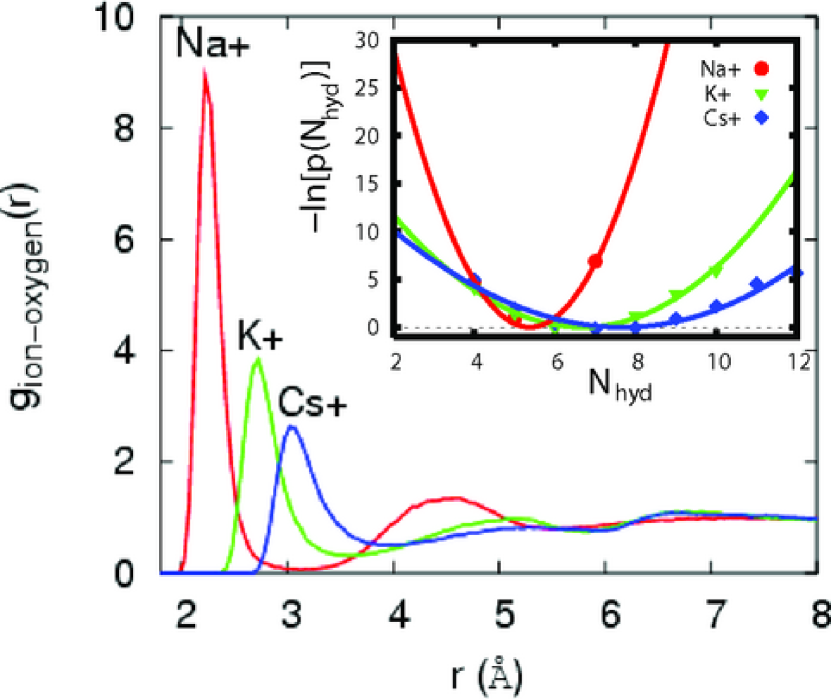
Figure 5 shows the potential of mean force, -ln, obtained from probability, , of observing , number of water molecules in the hydration shell of three different cations. fluctuates between 4 and 7 for ion, with an average value of 5.3. The hydration shells of and display higher fluctuations, with ranging between 4 to 10 for and 4 to 12 for , respectively. The trends in these fluctuations are consistent with ion-water radial distribution functions shown in Figure 5, which show tighter binding of water molecules to compared to that for the larger or ions. The hydration number of 2 as required in the nanopore interior is never observed spontaneously in simulations in bulk water, as the free energy of such dehydration is rather high. However, the estimated value of free energy for in bulk water, approximately equal to 10 for , 11 for , and over 25 for ion is consistent with the significantly slower partitioning of compared to and ions. Despite this consistency, it is important to note that the dehydration free energies do not equal the free energy barrier for partitioning of these ions. The favorable ion-nanopore interactions assist the dehydration of cations, therefore reducing the barrier height. This is supported by the fact that the kinetic selectivity decreases with the increasing of the nanopore charge density. It will be interesting to investigate the exact nature of the barrier and especially the role of water structure at the pore opening in future simulation studies.
IV Conclusions
Nanoporous materials with well defined pore sizes can provide excellent means to extract or separate small solutes based on steric or shape effect alone Jirage et al. (1997); Keffer et al. (1996); Heyden et al. (2002); Ayappa (1998); Adhangale and Keffer (2002). However, solvent can play an important role through differential solvation of solutes in the bulk and in the pore interior thereby providing selective partitioning of specific solutes of interest from a mixture of similarly-sized solutes. We studied the partitioning of cations , and ions from bulk water into negatively charged model cylindrical pores with increasing pore charge density using MD simulations. Neutral and near neutral nanopores exclude ions from their interior. However, over a certain range of negative charge density on the pore, the nanopores display selectivity toward partitioning of the larger cations and over that for the smaller ion. Nonequilibrium kinetic simulations show that the partitioning is significantly slower for compared to that for and ions, especially for lower charge densities on the pore. Thermodynamic and kinetic observations collectively suggest the presence of a barrier for partitioning of cations into the nanopore interior. Such a barrier is expected to slow down the flow rates of ions through nanopores. We found that trends in free energy of dehydration of ions in bulk water are consistent with the partitioning kinetics.
Although our studies here are focused on a CNT-like model pore, the
results are relevant to studies of carbon nanotubes focused on solute
partitioning and transport Hummer et al. (2001); Kalra et al. (2003); Waghe et al. (2002); Skoulidas et al. (2002); Sholl and Johnson (2006); Park et al. (2006); Liu et al. (2006); Dzubiella and Hansen (2005) and to complementary
theoretical analyzes Piasecki et al. (2004); Berezhkovskii and Hummer (2002); Chou (2004); Carrillo-Tripp
et al. (2004); Daiguji et al. (2004); Thompson (2003); Ramirez et al. (2003). Previous studies of neutral hydrated carbon nanotubes
show that water flows through their greasy interior in a frictionless
manner and the flow rate is limited by the entry and exit barriers
Kalra et al. (2003). The low density region at the center of charged
nanopores observed here would present an internal barrier for water
transport. It will be interesting to explore to what extent such
internal barriers will affect the flow rates of water through
nanopores. More broadly, manipulating the balance of various
interactions through design of nanosystems and functionalization
Martin et al. (2001); Mitchell et al. (2002); Majumder et al. (2005) provides a
mechanism for selective partitioning, separation, or transport of
solutes of interest from a mixture of molecules of similar size and
shape. Lastly, the partitioning of cations into negatively charged
pores of subnanometer dimensions is qualitatively consistent with the
picture emerging from experimental studies of carbon supercapacitors
Chmiola et al. (2006). Simulation studies of more realistic
systems along these lines may aid better design of high energy storage
devices.
ACKNOWLEDGMENTS: SG gratefully acknowledges partial financial support of the NSF (CAREER and NSEC) grants, as well as the NIH RECCR grant. LY thanks hospitality of the Chemical and Biological Engineering Department at RPI during the Katrina disaster.
References
- Sholl and Johnson (2006) D. S. Sholl and J. K. Johnson, Science 312, 1003 (2006).
- Hummer et al. (2001) G. Hummer, J. C. Rasaiah, and J. P. Noworyta, Nature 414, 188 (2001).
- Eijkel and van den Berg (2005) J. C. T. Eijkel and A. van den Berg, Microfluidics and Nanofluidics 1, 249 (2005).
- Holt et al. (2006) J. K. Holt, H. G. Park, Y. M. Wang, M. Stadermann, A. B. Artyukhin, C. P. Grigoropoulous, A. Noy, and O. Bakajin, Science 312, 1034 (2006).
- Ajayan and Iijima (1993) P. M. Ajayan and S. Iijima, Nature 361, 333 (1993).
- Gelb et al. (1999) L. D. Gelb, K. E. Gubbins, R. Radhakrishnan, , and M. Sliwinska-Bartkowiak, Reports on Progress in Physics 62, 1573 (1999).
- Murata et al. (2000) K. Murata, K. Mitsuoka, T. Hirai, T. Walz, P. Agre, J. B. Heymann, A. Engel, and Y. Fujiyoshi, Nature 407, 599 (2000).
- Doyle et al. (1998) D. A. Doyle, J. M. Cabral, R. A. Pfuetzner, A. L. Kuo, J. M. Gulbis, S. L. Cohen, B. T. Chait, and R. MacKinnon, Science 280, 69 (1998).
- Raman et al. (1996) N. K. Raman, M. T. Anderson, and C. J. Brinker, Chemistry of Materials 8, 1682 (1996).
- Chmiola et al. (2006) J. Chmiola, G. Yushin, Y. Gogotsi, C. Portet, P. Simon, , and P. L. Taberna, Science 313, 1760 (2006).
- Keblinski et al. (2002) P. Keblinski, S. K. Nayak, P. Zapol, and P. M. Ajayan, Phys. Rev. Lett. 89, 255503 (2002).
- Pearlman et al. (1995) D. A. Pearlman, D. A. Case, J. W. Caldwell, W. S. Ross, T. E. Cheatham, S. Debolt, D. Ferguson, G. Seibel, and P. Kollman, Comput. Phys. Commun. 91, 1 (1995).
- Jorgensen et al. (1983) W. L. Jorgensen, J. Chandrashekhar, J. D. Madura, R. W. Impey, and M. L. Klein, J. Chem. Phys. 79, 926 (1983).
- Kalra et al. (2004) A. Kalra, G. Hummer, and S. Garde, J. Phys. Chem. B 108, 544 (2004).
- Straatsma and Berendsen (1988) T. P. Straatsma and H. J. C. Berendsen, J. Chem. Phys. 89, 5876 (1988).
- Allen and Tildesley (1987) M. P. Allen and D. J. Tildesley, Computer simulation of liquids (Clarendon press, Oxford UK, 1987).
- Darden et al. (1993) T. Darden, D. York, and L. Pedersen, J. Chem. Phys. 98, 10089 (1993).
- Berendsen et al. (1984) H. J. C. Berendsen, J. P. M. Postma, W. F. van Gunsteren, A. DiNola, and J. R. Haak, J. Chem. Phys 81, 3684 (1984).
- Kalra et al. (2003) A. Kalra, S. Garde, and G. Hummer, Proc. Natl. Acad. Sci. U.S.A 100, 10175 (2003).
- Peter and Hummer (2005) C. Peter and G. Hummer, Biophys. J. 89, 2222 (2005).
- Mao et al. (1999) Z. G. Mao, A. Garg, and S. B. Sinnott, Nanotechnology 10, 273 (1999).
- Waghe et al. (2002) A. Waghe, J. C. Rasaiah, and G. Hummer, J. Chem. Phys. 117, 10789 (2002).
- Dellago et al. (2003) C. Dellago, M. M. Naor, and G. Hummer, Phys. Rev. Lett. 90, 105902 (2003).
- Vaitheeswaran et al. (2005) S. Vaitheeswaran, H. Yin, and J.C.Rasaiah, J. Phys. Chem. B 109, 6625 (2005).
- Tajkhorshid et al. (2002) E. Tajkhorshid, P. Nollert, M. O. Jensen, L. J. W. Miercke, J. O’Connell, R. M. Stroud, and K. Schulten, Science 296, 525 (2002).
- Widom (1963) B. Widom, J. of Chem. Phys. 39, 2808 (1963).
- Widom (1982) B. Widom, J. Phys. Chem. 86, 869 (1982).
- Hummer et al. (1996) G. Hummer, L. R. Pratt, and A. E. Garcia, J. Phys. Chem. 100, 1206 (1996).
- Garde et al. (1998) S. Garde, G. Hummer, and M. E. Paulaitis, J. Chem. Phys. 108, 1552 (1998).
- Rajamani et al. (2004) S. Rajamani, T. Ghosh, and S. Garde, J. Chem. Phys. 120, 4457 (2004).
- Carrillo-Tripp et al. (2003) M. Carrillo-Tripp, H. Saint-Martin, and I. Ortega-Blake, J. Chem. Phys. 118, 7062 (2003).
- Rempe and Pratt (2001) S. B. Rempe and L. R. Pratt, Fluid Phase Equilib. 183, 121 (2001).
- Driesner et al. (1998) T. Driesner, T. M. Seward, and I. G. Tironi, Geochim. Cosmochim. Acta 62, 3095 (1998).
- Ohtaki (2001) H. Ohtaki, Mon. Chem. 132, 1237 (2001).
- Bolhuis et al. (2002) P. G. Bolhuis, D. Chandler, C. Dellago, and P. L. Geissler, Ann. Rev. of Phys. Chem. 53, 291 (2002).
- Torrie and Valleau (1977) G. M. Torrie and J. P. Valleau, Journal of Computational Physics 23, 187 (1977).
- Kumar et al. (1992) S. Kumar, D. Bouzida, R. H. Swendsen, P. A. Kollman, and J. M. Rosenberg, Journal of Computational Chemistry 13, 1011 (1992).
- Jirage et al. (1997) K. B. Jirage, J. C. Hulteen, and C. R. Martin, Science 278, 655 (1997).
- Keffer et al. (1996) D. Keffer, H. T. Davis, and A. V. McCormick, J. Phys. Chem. 100, 638 (1996).
- Heyden et al. (2002) A. Heyden, T. Duren, and F. J. Keil, Chem. Eng. Sci. 57, 2439 (2002).
- Ayappa (1998) K. G. Ayappa, Chem. Phys. Lett. 282, 59 (1998).
- Adhangale and Keffer (2002) P. Adhangale and D. Keffer, Langmuir 18, 10455 (2002).
- Skoulidas et al. (2002) A. I. Skoulidas, D. M. Ackerman, J. K. Johnson, and D. S. Sholl, Phys. Rev. Lett. 89, 185901 (2002).
- Park et al. (2006) J. H. Park, S. B. Sinnott, and N. R. Aluru, Nanotechnology 17, 895 (2006).
- Dzubiella and Hansen (2005) J. Dzubiella and J. P. Hansen, J. Chem. Phys. 122, 234706 (2005).
- Liu et al. (2006) H. M. Liu, S. Murad, and C. J. Jameson, J. Chem. Phys. 125, 084713 (2006).
- Piasecki et al. (2004) J. Piasecki, R. J. Allen, and J. P. Hansen, Phys. Rev. E. 70, 021105 (2004).
- Berezhkovskii and Hummer (2002) A. Berezhkovskii and G. Hummer, Phys. Rev. Lett. 89, 064503 (2002).
- Chou (2004) T. Chou, Biophys. J. 86, 2827 (2004).
- Carrillo-Tripp et al. (2004) M. Carrillo-Tripp, H. Saint-Martin, and I. Ortega-Blake, Phys. Rev. Lett. 93, 168104 (2004).
- Daiguji et al. (2004) H. Daiguji, P. Yang, and A. Majumdar, Nano Lett. 4, 137 (2004).
- Thompson (2003) A. P. Thompson, J. Chem. Phys. 119, 7503 (2003).
- Ramirez et al. (2003) P. Ramirez, S. Mafe, A. Alcaraz, and J. Cervera, J. Phys. Chem. B 107, 13178 (2003).
- Martin et al. (2001) C. R. Martin, M. Nishizawa, K. Jirage, M. S. Kang, and S. B. Lee, Adv. Mater. 13, 1351 (2001).
- Mitchell et al. (2002) D. T. Mitchell, S. B. Lee, L. Trofin, N. C. Li, T. K. Nevanen, H. Soderlund, and C. R. Martin, J. Am. Chem. Soc. 124, 11864 (2002).
- Majumder et al. (2005) M. Majumder, N. Chopra, R. Andrews, and B. J. Hinds, Nature 438, 44 (2005).
| nanopore () | nanopore () | nanopore () | ||||
|---|---|---|---|---|---|---|
| 17.46 | 11.79 | 3.09 | 2.06 | 0.92 | 0.65 | |
| 0.66 | 0.50 | 0.72 | 0.52 | 0.14 | 0.04 | |
| 0.78 | 0.41 | 0.36 | 0.18 | 0.34 | 0.34 | |
| bulk water | nanopore (-2e) | nanopore (-5e) | nanopore (-8e) | ||||||||||
| 8.9 | -420.1 | -411.2 | 1.9 | -351.3 | -349.4 | 1.8 | -512.7 | -510.9 | 2.0 | -696.9 | -694.9 | ||
| 22.3 | -306.9 | -284.5 | 28.2 | -299.3 | -271.1 | 29.7 | -454.6 | -424.9 | 32.1 | -630.3 | -598.3 | ||
| 29.0 | -259.7 | -230.7 | 58.4 | -280.1 | -221.7 | 61.5 | -398.6 | -337.1 | 65.2 | -576.9 | -511.7 | ||
| in nanopore in vacuum | -4.8 | -442.1 | -446.9 | -4.8 | -1017.4 | -1022.2 | -4.8 | -1592.1 | -1596.9 | ||||
| in nanopore in vacuum | 15.1 | -441.3 | -426.2 | 15.1 | -1014.3 | -999.2 | 15.1 | -1588.6 | -1573.5 | ||||
| in nanopore in vacuum | 43.0 | -440.9 | -397.9 | 43.0 | -1014.4 | -971.4 | 43.0 | -1587.3 | -1544.3 | ||||
| nanopore (-2e) | nanopore (-5e) | nanopore (-8e) | |||||||
|---|---|---|---|---|---|---|---|---|---|
| -7.0 | 68.8 | 61.8 | -7.1 | -92.6 | -99.7 | -6.9 | -276.8 | -283.7 | |
| 5.9 | 7.6 | 13.5 | 7.4 | -147.7 | -140.3 | 9.8 | -323.4 | -313.6 | |
| 29.4 | -20.4 | 9.0 | 32.5 | -138.9 | -106.4 | 36.2 | -317.2 | -281.0 | |