On the origin of the Epps effect
Abstract
The Epps effect, the decrease of correlations between stock returns for short time windows, was traced back to the trading asynchronicity and to the occasional lead-lag relation between the prices. We study pairs of stocks where the latter is negligible and confirm the importance of asynchronicity but point out that alone these aspects are insufficient to give account for the whole effect.
1 ISI Foundation - Viale S. Severo, 65 - I-10133 Torino, Italy
2 Department of Theoretical Physics, Budapest University of Technology and Economics - Budafoki út. 8. H-1111 Budapest, Hungary
3 Laboratory of Computational Engineering, Helsinki University of Technology - P.O.Box 9203, FI-02015, Finland
1 Introduction
1979 T. W. Epps reported empirical results showing that stock return correlations decrease as the sampling frequency increases [1]. Later this phenomenon has been found in several studies of different stock markets [2, 3] and of foreign exchange markets [4, 5]. Since the most important factors in classical portfolio management are the correlations between the individual assets, the understanding and the accurate description of these correlations on all time scales are of major importance.
Considerable effort has been devoted to uncover the relationship of the correlation coefficient and the sampling frequency [6, 7, 8, 9, 10, 11]. So far the studies have revealed two factors causing the Epps effect. The first one is the lead-lag effect [12, 13, 14] between the stock returns, which can occur for pairs of stocks of very different capitalization and/or for some functional dependencies between them. In this case the maximum of the time-dependent correlation function is at non zero time lag resulting in increasing correlations as the sampling time scale gets in the same order of magnitude as the characteristic lag (typically of the order of minutes) [3, 6]. However, in a recent study [14] we showed that through the years this effect becomes less important since the characteristic lag shrinks, signalizing an increasing market efficiency.
The second, more important factor is the asynchronicity of trading [6, 7, 11, 15]. Empirical results showed that taking into account only synchronous price ticks the Epps effect is reduced, i.e., the measured correlations increase. It is natural to assume that, for a given sampling frequency, increasing trading activity should enhance synchronicity, leading to a weaker Epps effect. Indeed, using Monte Carlo experiments, an inverse relation was found between trading activity and the correlation drop [6].
The aim of the present communication is to investigate empirically the role of the trading activity on the Epps effect. We find that in contrast to the simulations, the empirical data do not scale in the expected way indicating that a further, possibly human factor is also at play.
2 Methodology
In our analysis we used the Trade and Quote (TAQ) Database of the New York Stock Exchange (NYSE) for the period of 4.1.1993 to 31.12.2003, containing tick-by-tick data. To avoid the problems occurring from splits in the prices of stocks, which cause large logarithmic return values in the time series, we applied a filtering procedure. In high-frequency data, we omitted returns larger than 5% of the current price of the stock. This retains all logarithmic returns caused by simple changes in prices but excludes splits which are usually half or one third of the price. We computed correlations for each day separately and averaged over the set of days, this way avoiding large overnight returns and trades out of the market opening hours.
We computed the logarithmic returns of stock prices:
| (1) |
where stands for the price of stock A at time . The time dependent correlation function of stocks A and B is defined by
| (2) |
The notion stands for the moving time average over the considered period:
| (3) |
where time is measured in seconds and T is the time span of the data.
is the standard deviation of the return series:
| (4) |
For pairs of stocks with a lead–lag effect the function has a peak at non-zero .
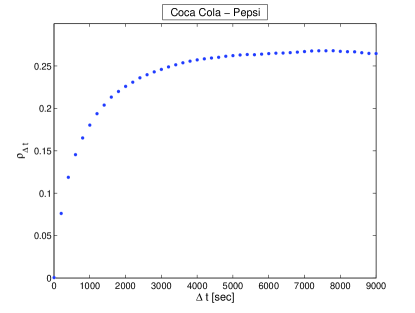
The equal-time correlation coefficient is: .In our notations the Epps effect means that decreases as decreases (see Figure 1).The prices are defined as being constant between two consecutive trades (previous tick estimator), thus the time scale of the sampling can be chosen arbitrarily.
3 Results
In order to separate the different origins of the Epps effect we consider only pairs of stocks where the lead–lag effect is neglible, i.e., for which the price changes are highly correlated with the peak position of of Eq. 2 being at . Good candidates are the pairs Coca-Cola Company (KO) / PepsiCo, Inc. (PEP), Caterpillar Inc. (CAT) / Deere & Company (DE), Wal-Mart Stores, Inc. (WMT) / Sprint Nextel Corporation (S), etc. We shall illustrate our findings on the example of KO/PEP but the other pairs show similar behaviour.
In Figure 1 we show the correlation coefficient as a function of the sampling time scale for the whole period, 1993–2003.One can see that the correlations increase as the sampling frequency decreases. The growth is very fast in the beginning but several hours are needed for the correlation to reach its asymptotic value.
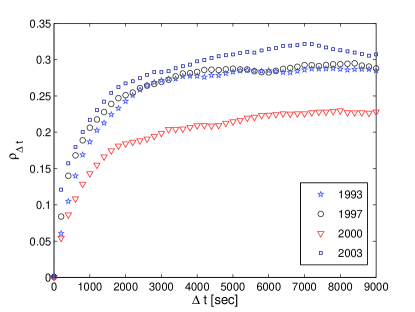
To study the trading frequency dependence of the correlation drop we computed the Epps-curve separately for different years. Figure 2 shows the correlation coefficient as a function of the sampling time scale for the years 1993, 1997, 2000 and 2003.
As it is known, correlations are not constant through the years. Apart from a growing trend, being a sign of growing efficiency [14], there are fluctuations which depend on the whole market. For example in crash periods the complete market is moving together. We have to take this into account and try to extract the effect of changing asymptotic correlations from the phenomenon studied. In order to do this, we scaled the curves with their asymptotic value: The latter was defined as the mean of the correlation coefficients for the sampling time scales seconds through seconds, and the correlations were divided by this value. Figure 3 shows the scaled curves for the years 1993, 1997, 2000 and 2003.
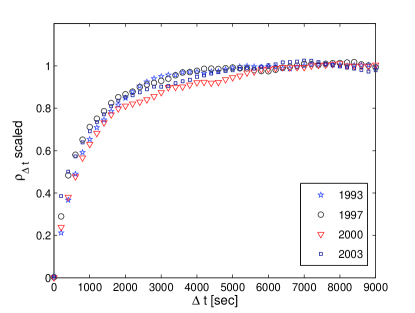
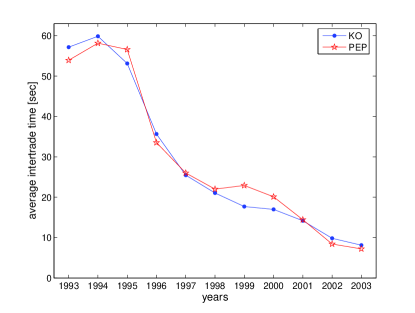
Knowing that the trading activity almost monotonically grew in the period studied (as it can be seen in Figure 4), one would expect the diminution of the Epps effect, and thus much weaker decrease of the correlations as sampling frequency is increased. However, after scaling with the asymptotic correlation value, the curves give a reasonable data collapse and no systematic trend can be seen. Surprisingly, increasing the trading frequency by a factor of does not lead to a measurable reduction of the characteristic time of the Epps effect.
These observations show that the effect of asynchronicity in trading is more complex than it is usually understood and can not be solely discussed through the trading activity. The characteristic time of the Epps effect seems to be independent of the trading frequency, indicating another, possibly human time scale being also at play. This assumption, together with an analytic treatment of the Epps effect and with Monte Carlo experiments will be investigated in a forthcoming paper [16], which is based on a relation between equal time and time lagged correlations. A similar approach was used in [17].
Acknowledgments
Support by OTKA T049238 is acknowledged.
References
- [1] T.W. Epps, Journal of the American Statistical Association 74, 291-298 (1979)
- [2] G. Bonanno, F. Lillo, R.N. Mantegna, Quantitative Finance 1, 1-9 (2001)
- [3] A. Zebedee, A closer look at co-movements among stock returns, San Diego State University, working paper (2001)
- [4] M. Lundin, M. Dacorogna, U. A. Müller, Correlation of high-frequency financial time series. In P. Lequeux (Ed.),Financial Markets Tick by Tick. Wiley & Sons.
- [5] J. Muthuswamy, S. Sarkar, A. Low, E. Terry, Journal of Futures Markets 21(2), 127-144 (2001)
- [6] R. Renò, International Journal of Theoretical and Applied Finance 6(1), 87-102 (2003)
- [7] O. V. Precup, G. Iori, Physica A 344, 252-256 (2004)
- [8] O. V. Precup, G. Iori, European Journal of Finance (2006).
- [9] T. Mizuno, S. Kurihara, M. Takayasu, H. Takayasu, cond-mat/0303306 (March 2003)
- [10] J. Kwapień, S. Drożdż, J. Speth, Physica A 337, 231-242 (2004)
- [11] L. Zhang, Estimating Covariation: Epps Effect, Microstructure Noise working paper (2006)
- [12] A. Lo, A. C. MacKinlay, Rev. Finance Stud 3, 175-205 (1990)
- [13] L. Kullmann, J. Kertész, K. Kaski, Phys. Rev. E 66, 026125 (2002)
- [14] B. Tóth, J. Kertész, Physica A 360 505-515 (2006)
- [15] A. Lo, A. C. MacKinlay, Journal of Econometrics 45, 181-211 (1990)
- [16] B. Tóth, J. Kertész, in preparation
- [17] M. Potters, J.-P. Bouchaud, L. Laloux, Acta Physica Polonica B, 36, 9, (2005)