Vacuum Predictions and Measurements for an Internal Pellet Target
Abstract
Measurements with low Z targets at internal experiments typically imply a gas load which deteriorates the ring vacuum. Future experiments need reliable estimates for the expected vacuum conditions in order to design detectors closely surrounding the interaction area.
We present a method for the calculation of the resulting vacuum of such a complex system using a Pellet Target. In order to test the method, a vacuum system with diagnostic tools has been set up and a Pellet Target was operated under realistic conditions. The results for the absolute vacuum agree within factors of two with the expected pressures.
keywords:
Internal Target , Pellet Target , Evaporation , Vacuum Measurement , Vacuum PredictionPACS:
29.25.Pj , 29.20.Dh , 68.03.Fg,
,
††thanks: Current address: Department of Physics & Astronomy,
University of Glasgow,
Glasgow, G12 8QQ, Scotland, UK.
,
,
,
,
and
1 Introduction
Modern storage rings need a high vacuum throughout the whole ring to maintain the requirements on beam precision and lifetime. Internal experiments covering acceptance have typically little space for vacuum pumps close to the interaction point. This is, however, the region where a high gas load is introduced if windowless Gas, Cluster, or Pellet Targets are used. When planning a new experimental facility the dimensions of the vacuum system have to be adjusted such that an acceptable pressure is reached inside the ring. In order to do this, it is crucial to have the means to predict the vacuum taking the geometry and gas load by the target into account.
In this paper we present a method to calculate the vacuum in such a system and compare it with measurements of the vacuum in a dedicated test stand. The measurements and calculations were done using a vacuum system which is similar to the one anticipated for the future PANDA experiment [1] and a Pellet Target as the source of gas.
A Pellet Target consists of micro-spheres (about 30m in diameter) of frozen gas called “pellets”. Typically, hydrogen, deuterium, or noble gases are used. The pellets travel with speeds of 50 to 100 metres per second and a spread of about 1 mrad. Thus the production can be metres away from the interaction point. Such a target was used at the CELSIUS/WASA experiment and is currently in operation at COSY [2, 3]. A copy of the generator of this target was set up as a testing facility at The Svedberg Laboratory (TSL), Uppsala, Sweden. The Pellet-Test Station (PTS) has been equipped with a full vacuum system in order to perform the measurements discussed below.
2 Experimental Set-Up
The Pellet-Test Station (PTS) is a fully operational target which has been built to test and further develop the Pellet Target at CELSIUS/WASA. It is a completely independent system and the pellet generator is largely a copy of the WASA target. The details of the pellet generation can be found in Refs. [2]. The basic principle is that gas, e.g. hydrogen, is liquefied in a first stage and small droplets are formed by vibrations with 50 to 100 kHz. These are then injected into vacuum which causes freezing. The point of vacuum injection is often referred to as the point of production, and we set our scale to it. To avoid large tails of the distribution of the pellet stream and to define the width at the interaction point, a skimmer is used at some point on the pellets’ path. Typically rates of several thousand pellets per second are reached for a total width of the stream of about 2 mm at an interaction point about 2 m below the vacuum injection.
The PTS differs by the following items from the original WASA target [2]:
-
•
The cold head has been improved, leading to lower vibrations, faster pumping, better temperature and vacuum control.
-
•
The construction has been redesigned in order to allow for better access and faster exchange of parts on the generator, while keeping compatibility with the WASA system.
-
•
A new vacuum system has been added, which is designed to simulate the interaction region of PANDA vacuum-wise. It allows vacuum measurements at five points and visual observation of the pellets on two levels. Here cameras, counters and a line-scan camera have been installed [4].
A side view of the system is sketched in Fig. 1 and important parts and their distance to the production are listed in Table 1. The pellet-generation system is mounted on top of a block, which contains 4 turbo-molecular pumps with a pumping speed of 2800 l/s each. It should be noted that all the pumping speeds given in this document refer to the respective values for hydrogen, as this is the gas we consider here. During operation the pressure in the block is typically mbar.
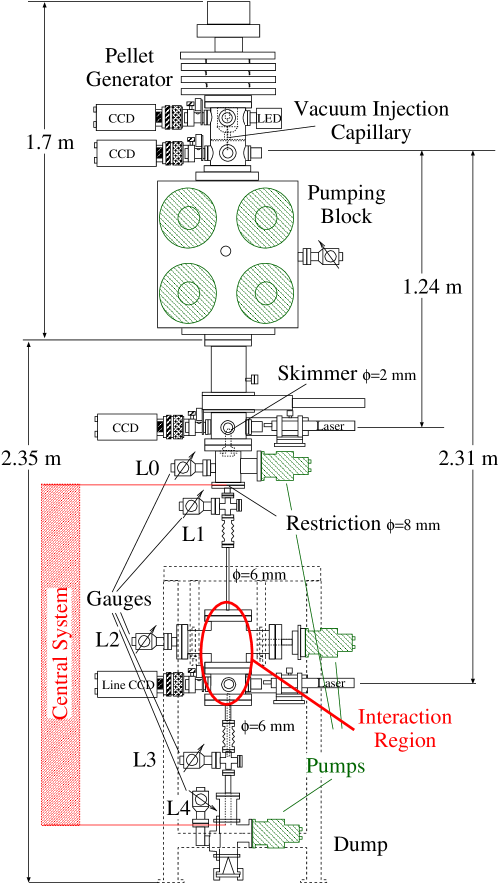
The skimmer, a cone with a hole of 2 mm that cuts the tails of the pellet distribution, is positioned below the Pumping Block. The upper observation chamber holding this skimmer is used to align the pellet stream such that a large fraction of the pellets pass through it. A side effect of such a skimmer is that some pellets are deflected only slightly when hitting the rim or inner surface. These continue with the stream and may produce large gas loads, where the system is narrow and difficult to pump. In order to remove these, a second restriction of 8 mm diameter is placed 27 cm below the skimmer. To pump the gas away, the chamber between is equipped with a turbo-molecular pump with 150 l/s and a vacuum gauge of Pirani type (L0).
When installing such a system at a large experimental set-up, the skimmer would be placed much further up, e.g. in the middle of the Pumping Block. In this case much more space would be available for detectors while leaving the properties of the pellet stream unchanged.111This is because the diameter of the skimmer can be changed accordingly. Studies with several skimmer sizes have confirmed the expected geometric relation without significant distortion.
Below this point the components which simulate the vacuum system inside a future detector follow. It is referred to as the Central System in the following. This corresponds also to the part which has been modelled for the calculations discussed in Section 3. There are two feed lines and an Interaction Region. The feed lines have a inner diameter of 6 mm close to the interaction region to simulate a typical experimental situation. Inside these lines, vacuum gauges (L1 and L3) are installed to study the vacuum gradient and systematics. At each of the three central measurement levels (L1, L2, and L3) we have placed two vacuum gauges: one Pirani and one Penning type. Thus a vacuum range from atmospheric pressure down to well below mbar is covered. The gauges have been calibrated and all values given in the following refer to hydrogen. The uncertainty of any vacuum measurement is estimated to be 25%.
The Interaction Region cannot be pumped effectively through the narrow pellet-feed lines. Moreover, assuming a moderate pumping speed at the region itself, gas from the pellets is streaming into the Interaction Region rather than being pumped away. This is because the gas load from the pellets is occurring all along their vertical path, i.e. mostly inside the feed pipes. Both calculations and measurements confirm that, indeed, the vacuum in the Interaction Region can be improved using thinner rather than wider feed pipes. Also a moderate prolongation of these pipes would not lead to a significant change of vacuum properties.
In an experimental set-up the beam pipe would intersect in the Interaction Region. Instead we accommodate two vacuum gauges (L2), a turbo-molecular pump, and an observation house at this place. The pump (150 l/s) is throttled by a conductance-limiting pipe such that theoretically a pumping speed of 47 l/s should be reached.222In Section 3 we will see that this value is almost reached. Thus we expect to reproduce the pumping speed foreseen at PANDA. The observation house is used to observe the concentration of pellets. We use a mm mm laser and two independent counters at this place to determine the count rate and distribution of pellets [1, 4]. One counter uses light reflected to angles of about 7∘, which is focused by a lens-aperture system into a photo-multiplier. A CCD line-scan camera records light reflected to 90∘. The rates recorded with both systems agree to within 10% and we use the first system for the following analysis.
The Pellet Dump is placed at the bottom. A cone reflects pellets to the sides to minimise the risk of a re-entry into the feed pipe. A turbo-molecular pump with 210 l/s pumping speed is mounted on one side and a Pirani gauge (L4) monitors the vacuum. The system lacks an active pellet-capturing mechanism (as e.g. active charcoal under cryogenic conditions) and therefore backflow of vaporized hydrogen gas is inevitable. Furthermore, it cannot be excluded that some bouncing pellets will find their way back upwards into the pipe system. If this happens, even a very small fraction will affect the vacuum at L3 significantly.
| Component | Vertical position cm |
| End of Vacuum-Injection Capillary | 0 |
| Skimmer mm, observation windows | 124 |
| Pirani gauge (L0), 150 l/s pump | 143 |
| Restriction: mm | 151 |
| Pirani and Penning gauges (L1) | 157 |
| Narrow pipe: mm | 168 to 208 |
| Pirani and Penning gauges (L2), 150 l/s pump | 213 |
| Observation windows | 231 |
| Narrow pipe: mm | 238 to 251 |
| Pirani and Penning gauges (L3) | 261 |
| Dump, Pirani gauge (L4), 210 l/s pump | 297 to 319 |
3 Vacuum Calculations
To understand theoretically the vacuum in our system we use the following input, which is described in greater detail below.
-
1.
From the knowledge of the rate, size, and temperature of the pellets their gas load can be calculated [5].
-
2.
The conductances of the central system can be modeled using a one-dimensional approach based on Kirchoff-like rules for non-trivial pipe-systems in the regime of molecular flow.
-
3.
We have experimentally obtained the pumping speeds at three positions of the system.
In order to determine the gas load on the system from the outgassing pellets, item (1), we use the method in Ref. [5] where a Helmholtz equation is solved in spherical coordinates. First we consider the mass loss per individual pellet and time
| (1) |
Here, is the solid-vapour saturation pressure from Ref. [6] and is the specific gas constant of hydrogen. We neglect the pressure of the surrounding vacuum as it is much smaller than in most cases. With this assumption we tend to overestimate the gas load only at very high rates. The surface area is calculated from the pellet diameter, which was determined to be on average m. This is significantly larger than during typical pellet-target operation due to the use of a 50% larger nozzle than at WASA. In Ref. [5] the emissivity, which affects the equilibrium temperature and mass loss, is an unknown parameter and was set to . In order to account for that uncertainty, we attribute a 40% error to the mass loss.
The total gas load to the system per second and per metre of travel is
| (2) |
where m/s is the experimentally determined average pellet speed. The errors from the emissivity and the speed of the pellets dominate the total uncertainty of 50%.
To describe effectively the conductance, item (2), we limit ourselves to the relatively simple central system and consider an effective pumping speed for that system for the final analysis. A one-dimensional model based on Kirchoff-like rules can be used to describe a vacuum system with pipes of known conductance. For a pipe of circular cross section of diameter the conductance is calculated using the method from Ref. [7], in which a characteristic conductance of an element is where refers to the aperture and for hydrogen gas at 298 K. The transmission probability for a given pipe length has two extreme cases: in the limit when (aperture) equals 1, and for the other extreme case, when (long pipe), the probability is . Both limits, as well as intermediate cases, are well described by the general-case probability
| (3) |
We use this approach and VAKLOOP [8] to model our central system between the 8 mm Restriction and the end of feed pipe in the Dump, i.e. between 151 cm and 297 cm from the Production Point (see shaded area in Figure 1). For the calculation we assign three effective pumping speeds to the system, one at each end ( and ), and one at 213 cm (), where we have our throttled pump simulating the interaction region of PANDA.
To obtain these effective pumping speeds, item (3), we have used the system itself and injected a known amount of gas. A thermal mass flow meter (Vögtlin, 2–100 mln/min) calibrated for hydrogen was used. The error of 16% given by the manufacturer is shown as a band in Figure 2. The procedure has been performed for two gas loads and at three different positions (L1, L2, and L3 levels). Thus 18 experimental points for the vacuum have been obtained, which were used in a single iterative approach with the three pumping speeds as parameters (see Figure 2).
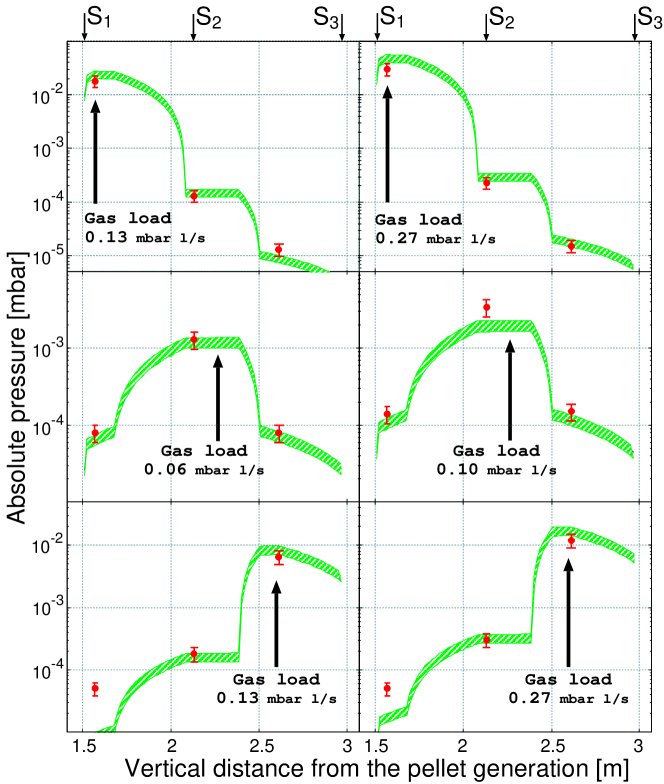
Though the absolute pressures vary by more than three orders of magnitude, the values are described well within two of the errors. The set of effective pumping speeds that reproduce the experimental observations in Figure 2 was found to be l/s, l/s, and l/s. From the geometry alone it is difficult to calculate the pumping speeds for and , because the system is complicated and the pumps are perpendicular to the openings. Using a significantly simplified geometry, values are obtained which are factors 5 and 3 higher than obtained from the fit, respectively. The value can be calculated with much less ambiguity as the geometry is rather simple. It is also the crucial value for the vacuum measurements described in the following section. The resulting value of l/s agrees within 20% with the result of l/s from the measurements. This shows that the calculations have to be restricted to geometrically rather simple arrangements. We use the measured l/s as respective pumping speeds at the three levels in the following. The uncertainty for these values is discussed in the next section.
4 Results of the Vacuum Measurements
The vacuum measurements were performed with the set-up described in Section 2, where we assign a 25% error to the vacuum measurements. We used the pellet counter with the photo-multiplier tube to measure the pellet rate. Here we have to assume an error of about 20%. We scanned a range from a few hundred to almost 5000 pellets per second while observing the pressure at all gauges. The pressure follows a linear relation at all levels, as expected (see linear fit in Figure 3).
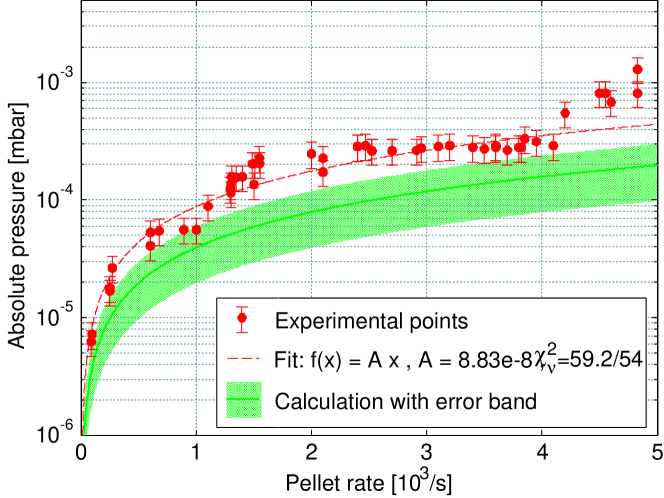
At the Interaction Region (L2 gauge) the pressure increases to a few times mbar when pellet rates of 4000/sec are reached (see points with error bars in Figure 3). As already shown the gas load from the pellets is proportional to their surface and thus quadratically increasing with pellet size. As the pellets were 50% larger than at typical pellet target operation, we would expect the vacuum to always stay below mbar with “normal” sized pellets. Nevertheless, this clearly shows that the gas load is of concern if only low pumping speeds, as foreseen at PANDA, can be reached at the interaction point.
The solid and dotted lines in Figure 3 show the calculated vacuum for the corresponding rate and their uncertainty, respectively. The calculation has been done as described in Section 3 considering the errors for the mass loss and speed of the pellets. Note that the uncertainty in pellet rate of 20% is not shown in the figure. The calculations agree within two but systematically underestimate the pressures reached. For L1 the values agree within errors, while close to the dump at L3 the calculations fail to describe the measured pressure. These effects can be explained by a contamination from bouncing pellets, that add to the gas load. In the Interaction chamber this is less likely. Thus we conclude that systematic errors may be slightly larger than anticipated. This may be attributed to the uncertainties from the pumping speeds, which were not taken into account. A 30% overestimation of the pumping speeds determined by the method in Section 3 would be sufficient to reach full agreement within errors.
5 Conclusions
We have reported on the gas load that is expected when pellets are used as an internal target. We have presented a method to calculate the vacuum when such a target is operated. In order to check the results of these calculations, measurements of the vacuum under realistic conditions were performed at the Pellet-Test Station. The set-up was equipped with a dedicated system, which was calibrated in terms of pumping speed. The observed vacuum shows what has to be expected at a future experiment with low pumping speed at the interaction point. The results of the calculations seem to lie systematically too low, but are within factors of two in agreement with the experiment.
In conclusion, a vacuum of about mbar has to be expected when operating a pellet target with only 40 l/s pumping speed at the interaction point. The model describes the vacuum resulting from the operation of a pellet target in a complex system within factors of two. This is especially remarkable as absolute values are calculated and the measurements cover more than one order in magnitude in vacuum and count rate. Thus we expect that the vacuum for other configurations may be predicted using that method within similar accuracy. This may be a very useful tool for the design of the vacuum systems of future experiments, like PANDA.
Acknowledgements
We would like to thank all the staff at The Svedberg Laboratory (TSL) for their help with all kind of odds and ends, especially Kjell Fransson and the workshop personnel. Acknowledged are also Ingela Nyström and Bo Nordin (Centre of Image Analysis, Uppsala University) for help with the image-analysis on the pellets. Also we thank C. Wilkin (University College, London) for reviewing the document. One of us (Ö.N.) also wish to thank the financial support from GSI, Darmstadt, Germany. This work was supported by the European Community-Research Infrastructure Activity within the FP6 programme “Structuring the European Research Area” (Hadron Physics, RII-CT-2004-506078).
References
-
[1]
PANDA Collaboration, Technical Progress Report (2005);
K. T. Brinkmann et al. Nucl. Phys. News 16 (2006) 15. -
[2]
B. Trostell, Nucl. Instr. and Meth. A 362 (1995) 41;
C. Ekström et al., Nucl. Instr. and Meth. A 371 (1996) 572;
C. Ekström et al., Phys. Scripta T99 (2002) 169. - [3] M. Wolke et al, Proceedings of the Second Symposium on Threshold Meson Production in pp and pd Interaction, Jülich, Vol 21, (2004) 314.
- [4] Ö. Nordhage et al., Nucl. Instr. and Meth. A 568 (2006) 561.
- [5] Ö. Nordhage et al., Nucl. Instr. and Meth. A 546 (2005) 391.
- [6] P. C. Souers, Hydrogen Properties for Fusion Energy, (University of California Press, Ltd., 1986).
- [7] K. Jousten (Hrsg), Wutz Handbuch Vakuumtechnik, Friedr. Vieweg & Sohn Verlag (GWV Fachverlage GmbH, Wiesbaden, 2004).
- [8] V. Ziemann, Vacuum tracking, SLAC-PUB-5962, 1993.