\runtitleCADe of microcalcification clusters in a pan-European database of mammograms \runauthorA. Retico
A scalable Computer-Aided Detection system for microcalcification cluster identification in a pan-European distributed database of mammograms
Abstract
A computer-aided detection (CADe) system for microcalcification cluster identification in mammograms has been developed in the framework of the EU-founded MammoGrid project. The CADe software is mainly based on wavelet transforms and artificial neural networks. It is able to identify microcalcifications in different kinds of mammograms (i.e. acquired with different machines and settings, digitized with different pitch and bit depth or direct digital ones). The CADe can be remotely run from GRID-connected acquisition and annotation stations, supporting clinicians from geographically distant locations in the interpretation of mammographic data. We report the FROC analyses of the CADe system performances on three different dataset of mammograms, i.e. images of the CALMA INFN-founded database collected in the Italian National screening program, the MIAS database and the so-far collected MammoGrid images. The sensitivity values of 88% at a rate of 2.15 false positive findings per image (FP/im), 88% with 2.18 FP/im and 87% with 5.7 FP/im have been obtained on the CALMA, MIAS and MammoGrid database respectively.
Keywords: Computer Aided Detection, Mammography, Wavelets, Neural Networks, GRID applications.
1 Introduction
The EU-founded MammoGrid project [1] is currently collecting an European-distributed database of mammograms with the aim of applying the GRID technologies to support the early detection of breast cancer. GRID is an emerging resource-sharing model that provides a distributed infrastructure of interconnected computing and storage elements [2]. A GRID-based architecture would allow the resource sharing and the co-working between radiologists throughout the European Union. In this framework, epidemiological studies, tele-education of young health-care professionals, advanced image analysis and tele-diagnostic support (with and without computer-aided detection) would be enabled.
In the image processing field, we have developed and implemented in a GRID-compliant acquisition and annotation station a computer-aided detection (CADe) system able to identify microcalcifications in different kinds of mammograms (i.e. acquired with different machines and settings, digitized with different pitch and bit depth or direct digital ones).
This paper is structured as follows: the detection scheme is illustrated in sec. 2, sec. 3 describes the database the MammoGrid Collaboration is collecting, whereas the tests carried out on different datasets of mammograms and the preliminary results obtained on a set of MammoGrid images are discussed in sec. 4.
2 Description of the CADe system
The CADe procedure we realized is mainly based on wavelet transforms and artificial neural networks. Both these techniques have been successfully used in similar image processing applications [3, 4, 5]. Our CADe system indicates one or more suspicious areas of a mammogram where microcalcification clusters are possibly located, according to the following schema:
-
•
INPUT: digital or digitized mammogram;
-
•
Pre-processing: a) identification of the breast skin line and segmentation of the breast region with respect to the background; b) application of the wavelet-based filter in order to enhance the microcalcifications;
-
•
Feature extraction: a) decomposition of the breast region in several pixel-wide partially-overlapping sub-images to be processed each at a time; b) automatic extraction of the features characterizing each sub-image;
-
•
Classification: assigning each processed sub-image either to the class of microcalcification clusters or to that of normal tissue;
-
•
OUTPUT: merging the contiguous or partially overlapping sub-images and visualization of the final output by drawing the contours of the suspicious areas on the original image.
2.1 Pre-processing of the mammograms
The pre-processing procedure aims to enhance the signals revealing the presence of microcalcifications, while suppressing the complex and noisy non-pathological breast tissue. A mammogram is usually dominated by the low-frequency information, whereas the microcalcifications appear as high-frequency contributions. A particular of a mammographic image and its decomposition according to the 2-D multi-resolution analysis are illustrated in fig. 1.
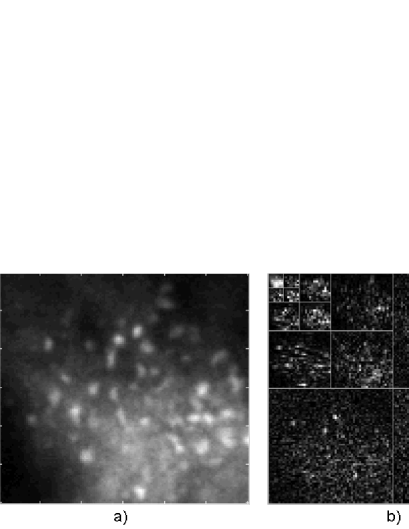
It is worth noticing that microcalcifications show some evident features at some specific scales, while they are almost negligible at other scales. The use of the wavelet transform allows for a separation of the more important high-resolution components of the mammogram from the less important low-resolution ones.
Once the breast skin line is identified, the breast region is processed by the wavelet-based filter, according to the following main steps: identification of the family of wavelets and the level up to which the decomposition has to be performed in order to highlight the interesting details; manipulation of the wavelet coefficients (i.e. suppression of the coefficients encoding the low-frequency contributions and enhancement of those encoding the contributions of interesting details); inverse wavelet transform. By properly thresholding the wavelet coefficients at each level of the decomposition, an enhancement of the microcalcification with respect to surrounding normal tissue can be achieved in the synthesized image. In order to achieve this result, the wavelet basis, the level up to which the decomposition have to be performed and the thresholding rules to be applied to the wavelet coefficients have to be accurately set. All these choices and parameters are application dependent. The size of the pixel pitch and the dynamical range of the gray level intensities characterizing the mammograms are the most important parameters to be taken into account.
2.2 Feature extraction
In order to extract from a mammogram the features to be submitted to the classifier, small regions of a mammogram are analyzed each at a time. The choice of fragmenting the mammogram in small sub-images is finalized both to reduce the amount of data to be analyzed at the same time and to facilitate the localization of the lesions possibly present on a mammogram. The size of the sub-images has been chosen according to the basic rule of considering the smallest squared area matching the typical size of a small microcalcification cluster. Being the size of a single microcalcification rarely greater than 1 mm, and the mean distance between two microcalcifications belonging to the same cluster generally smaller than 5 mm, we assume a square with a 5 mm side to be large enough to accommodate a small cluster. This sub-image size is appropriate to discriminate an isolated microcalcification (which is not considered to be a pathological sign) from a group of microcalcifications close together. The length of the square side in pixel units is obviously determined by the pixel pitch of the digitizer or of the direct digital device. Let us assume that our choice for the length of the square side corresponds to pixels. In order to avoid the accidental missing of a microcalcification cluster happening to be at the interface between two contiguous sub-images, we use the technique of the partially overlapping sub-images, i.e. we let the mask for selecting the sub-image to be analyzed move through the mammogram by half of the side length ( pixels) at each horizontal and vertical step. In this way each region of a mammogram is analyzed more than once with respect to different neighboring regions.
Each pixel-wide sub-image extracted from the filtered mammogram is processed by an auto-associative neural network, used to perform an automatic extraction of the relevant features of the sub-image. Implementing an auto-associative neural network is a neural-based method for performing an unsupervised feature extraction [6, 7, 8, 9]. This step has been introduced in the CAD scheme to reduce the dimensionality of the amount of data (the gray level intensity values of the pixels of each sub-image) to be classified by the system. The architecture of the network we use is a bottle-neck one (see fig. 2), consisting of three layers of input, hidden (where ) and output neurons respectively.
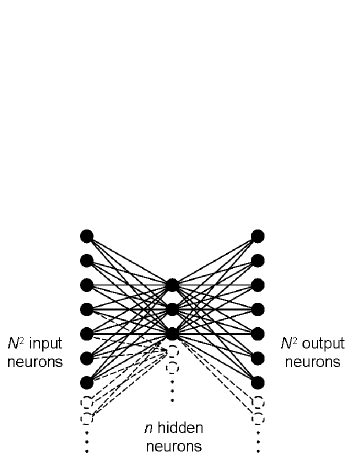
This neural network is trained to reproduce in output the input values. The overall activation of the nodes of the bottle-neck layer summarize the relevant features of the examined sub-image. The more the pixel-wide sub-image obtained as output is close to the original sub-image provided as input, the more the activation potentials of the hidden neurons are supposed to accommodate the information contained in the original sub-image.
It is worth noticing that the implementation of an auto-associative neural network at this stage of the CAD scheme allows for a strong compression of the parameters representing each sub-image () to be passed to the following step of the analysis.
2.3 Classification
We use the features extracted by the auto-associative neural network to assign each sub-image to either the class of sub-images containing microcalcification clusters or the class of those consisting only of normal breast tissue. A standard three-layer feed-forward neural network has been chosen to perform the classification of the features extracted from each sub-image. The general architecture characterizing this net consists in inputs, hidden and two output neurons, and the supervised training phase is based on the back-propagation algorithm.
3 The MammoGrid distributed database
One of the main goals of the EU-founded MammoGrid project is the realization of a GRID-enabled European database of mammogram, with the aim of supporting the collaboration among clinicians from different locations in the analysis of mammographic data. Mammograms in the DICOM [10] format are collected through the MammoGrid acquisition and annotation workstations installed in the participating hospitals. Standardized images are stored into the GRID-connected database. The image standardization is realized by the Standard-Mammogram-Form (SMF) algorithm [11] developed by the Mirada Solutions CompanyTM, a partner of the MammoGrid project. The SMF provides a normalized representation of the mammogram, i.e. independent of the data source and of the acquisition technical parameters (as mAs, kVp and breast thickness).
4 Tests and results
As the amount of mammograms collected at present in the MammoGrid database is too small for properly training the neural networks used in the characterization and classification procedures of our CADe, we used a larger dataset of mammograms for developing the system, then we evaluated its performances on the MammoGrid database.
The dataset used for training and testing the CADe was extracted from the fully annotated CALMA database [15, 16] and it consists of 375 mammograms containing microcalcification clusters and 610 normal mammograms, digitized with a pixel pitch of 85 m and a dynamical range of 12 bit per pixel.
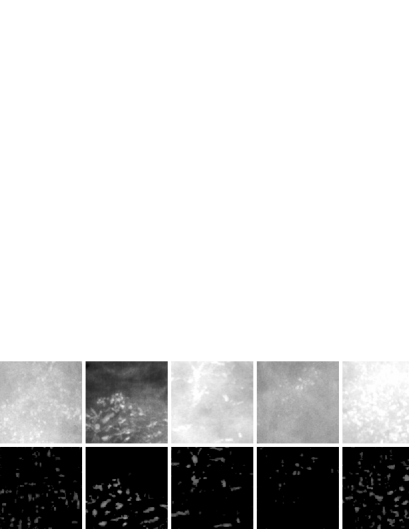
To perform the multi-resolution analysis we considered the Daubechies family of wavelet [12], in particular we used the db mother wavelet. As shown in fig. 1, each sub-image is decomposed up to the forth level. We found out that the resolution level 1 mainly shows the high-frequency noise included in the mammogram, whereas the levels 2, 3 and 4 contain the high-frequency components related to the presence of microcalcifications. Levels greater than 4 exhibited a strong correlation with larger structures possibly present in the normal breast tissue constituting the background. In order to enhance microcalcifications, the approximation coefficients at level 4 and the detail coefficients at the first level were neglected. By contrast, the statistical analysis of the distributions of the remaining detail coefficients lead us to keep into account for the synthesis procedure only those coefficients whose values exceed , where is the standard deviation of the coefficient distribution at that level. Some examples of the performance of the filter on mammographic images containing microcalcification clusters are shown in fig. 3.
The training and testing of the auto-associative neural network has been performed on a dataset of 149 mammograms containing microcalcification clusters and 299 normal mammograms. The best performances were achieved with the following network architecture: 3600 input, 80 hidden and 3600 output neurons. It corresponds to analyzing 6060 pixel-wide regions of mammograms each at a time. This size of the analyzing window is large enough to distinguish clusters from isolated microcalcifications since it approximately corresponds to a physical region of 55 mm2.
The dataset used for the supervised training of the feed-forward neural classifier is constituted by 156 mammograms with microcalcification clusters and 241 normal mammograms. The standard back-propagation algorithm was implemented and the best performance were achieved with 10 neurons in the hidden layer.
The CADe performances were globally evaluated on a test set of 140 images (70 with microcalcification clusters and 70 normal images) in terms of the free-response operating characteristic (FROC) analysis [13] (see fig. 4). The FROC curve is obtained by plotting the sensitivity of the system versus the number of false-positive detection per image (FP/im), while the decision threshold of the classifier is varied. In particular, as shown in the figure, a sensitivity value of 88% is obtained at a rate of 2.15 FP/im.
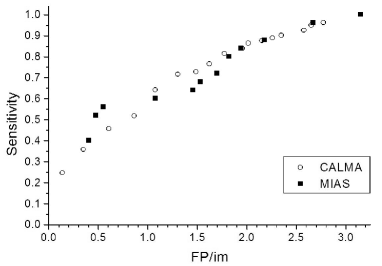
In order to test the generalization capability of the system, we evaluated the CADe performances on the public available MIAS database [14]. Being the MIAS mammograms characterized by a different pixel pitch (50 m instead of 85 m) and a less deep dynamical range (8 bit per pixel instead of 12) with respect to the CALMA mammograms, we had to define a tuning procedure for adapting the CADe system to the database we used for this test. A scaling of the wavelet-analysis parameters (sum of four neighboring pixels, matching of the dynamical ranges, wavelet decomposition up to the third level) allows the CADe filter to generate very similar pre-processed images. The remaining steps of the analysis, i.e. the characterization and the classification of the sub-images, have been directly imported from the CALMA CADe neural software. The performances the rescaled CADe achieves on the images of the MIAS database have been evaluated on a set of 42 mammograms (20 with microcalcification clusters and 22 normal) and shown in fig. 4. As can be noticed, a sensitivity value of 88% is obtained at a rate of 2.18 FP/im. The strong similarity in the trends of the FROC curves obtained on the CALMA and on the MIAS databases demonstrate the good generalization capability of the CADe system we developed.
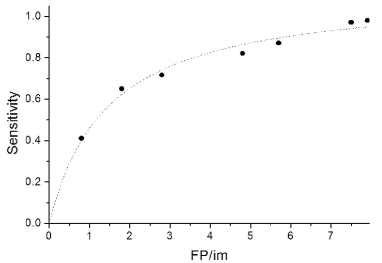
According to the MammoGrid project work-flow [1], the CADe algorithm has to run on mammograms previously processed by the SMF software [11]. The SMF mammograms are characterized by a different pixel pitch (100 m instead of 85 m) and a different effective dynamical range (16 bit per pixel instead of 12) with respect to the CALMA mammograms. The wavelet-analysis parameters have been rescaled to run the CADe analysis on these images. A test has been performed on a set of 130 mammograms with microcalcification clusters belonging to 57 patients: 46 of them have been collected and digitized at the University Hospital of Udine (IT), whereas the remaining 11 were acquired by the full-field digital mammography system GE Senographe 2000D at the Torino Hospital (IT); all have been stored in the MammoGrid database by means of the MammoGrid acquisition station installed at the University Hospital of Udine (IT). The preliminary evaluation of the CADe performances in terms of the FROC analysis is shown in fig. 5. In this case a sensitivity value of 87% is obtained at a rate of 5.7 FP/im.
5 Conclusions
We reported in this paper the details of the analysis and the results our CADe system for microcalcification cluster detection achieves on mammograms collected in different hospitals and acquired with different methods. In particular, wavelet transforms have been implemented in the pre-processing step, in order to enhance the microcalcifications with respect to the complex and noisy patterns provided by the non-pathological breast tissue. This pre-processing method can be tuned on databases characterized by different pixel pitch or different dynamical range. The features to be used in the classification step are automatically extracted by means of an auto-associative neural network and then analyzed by a feed-forward neural network.
The CADe system we developed and tested on both the CALMA and the MIAS databases has been adapted to the MammoGrid SMF images by re-scaling the wavelet-filter parameters. The main advantage the scaling procedure provides is that the rescaled CADe can be run even on small databases not allowing for a proper training of a neural decision-making system to be carried out. The preliminary results obtained on the so-far collected MammoGrid database are encouraging. Once the planned increase in the population of the database is realized, a complete test of the CADe performance on the pan-European MammoGrid database would be carried out.
References
- [1] The Information Societies Technology project: MammoGrid - A European federated mammogram database implemented on a GRID infrastructure. EU Contract IST-2001-37614.
- [2] I. Foster and C. Kesselman, The Grid: Blueprint for a New Computing Infrastructure. Morgan Kaufmann publishers, 1998. ISBN 1558604758.
- [3] W.B. Richardson, Applying wavelets to mammograms, IEEE Eng. Med. Biol. Mag. 14 (1995) pp 551–560.
- [4] H. Yoshida, R.M. Nishikawa, M.L. Giger, R.A. Schmidt, Acad. Radiol. 3(8) (1996) 621.
- [5] M.J. Lado, P.G. Tahoces, A.J. Mendez, M.Souto, J.J. Vidal, Med. Phys. 26(7) (1999) 1294.
- [6] M.A. Kramer, AIChE J. 37 (1991) 233.
- [7] M.A. Kramer, Comput. Chem. Eng. 16 (1992) 313.
- [8] J.A. Leonard and M.A. Kramer, IEEE Expert 8 (1993) 44.
- [9] D.R. Kuespert and T.J. McAvoy, Chem. Eng. Comm. 130 (1994) 251.
- [10] Digital Imaging and Communications in Medicine (DICOM). See http://medical.nema.org/
- [11] Standard Mammogram Form (SMF), Mirada SolutionsTM. See http://www.mirada-solutions.com/smf.htm.
- [12] I. Daubechies, Ten Lectures on Wavelets, SIAM Philadelphia 1992.
- [13] D. Chakraborty, Radiology 174(3) (1990) 873.
- [14] J. Suckling, J. Parker, D. Dance, S. Astley, I. Hutt, C. Boggis, I. Ricketts, E. Stamatakis, N. Cerneaz, S. Kok, P. Taylor, D. Betal, J. Savage, Excerpta Medica ICS 1069 (1994) 375 (mias@sv1.smb.man.ac.uk).
- [15] U. Bottigli, P. Delogu, M.E. Fantacci, F. Fauci, B. Golosio, A. Lauria, R. Palmiero, G. Raso, S. Stumbo, S. Tangaro, Proc. SPIE 4684 (2002) 1301.
- [16] R. Bellotti, et al., Proc. IEEE Nucl. Science Symp. (2004) N33-173.