Self-diffusion on Si(001) mono-hydride surfaces revisited: The role of adatom clustering
Abstract
First-principles total-energy calculations of the H/Si(001)-2x1 surfaces reveals a dual diffusion process for the Si adatoms: single along the dimer row while pairing up across the row. The calculated diffusion barrier along the dimer row is 1.1 eV, which is, however, too small to account for the hydrogen-induced growth disruption seen by experiments. Instead, we find that the adatom diffusion, in the presence of H, leads to the formation of immobile fourfold-ring Si tetramers which are difficult to break. This could explain the adverse effects of H on Si homoepitaxy.
pacs:
68.35.Fx, 68.35.Bs, 68.55.-aSilicon diffusion on Si(001) surface has attracted tremendous interestbrocks ; yama ; swart ; lee1 ; boro due to its importance in silicon single crystal growth. Hydrogen adsorbed Si(001) surface is the typical starting template for both high temperature and low temperature growth of silicon devices, latter of which is of particular importance for nanostructure growthTucker . A recent experimentTromp shows that with one monolayer (ML) coverage of hydrogen the silicon growth disrupts at low temperature (C), which can be resumed at a much higher temperature. This new phenomenon stimulates a great deal of research interest on the Si mono-hydride surfacevasek ; ogit ; Ohno ; Oshiyama ; hong ; smil ; lee . Currently, there are three possible explanations to this phenomenon. The first oneTromp , which is based on the experimental evidence, attributes the interruption of epitaxy growth to the formation of Si dihydrides on the surface. The second oneogit , which is based on first-principles calculations, suggests that hydrogen atoms hardly segregate from the surface, hence disrupting the growth. The third oneOhno ; Oshiyama ; lee , also based on first-principles calculations, suggests that hydrogen can spontaneously segregate from the surface. However, regarding the growth disruption, the calculations differ considerably: while Refs.Oshiyama ; lee suggest low barriers implying no disruption, Ref.Ohno predicts disruption due to large barriers. Growth disruption is also related to the surface roughness caused by the hydrogen adsorptionAdams , but the explanation to the roughness varies. In the first explanation the roughness is caused by higher-order hydrides, as supported by a first-principles calculationrebo , which can be overcome at about 200∘C.
In this paper, we perform a first-principles total-energy calculation on this problem. We predict that Si adatoms diffuse in two qualitatively different ways: as single atoms parallel to the surface dimer row with a 1.1-eV energy barrier but as pairs perpendicular to the dimer row. The formation of the four-Si tetramers is predicted to occur during epitaxial growth. Its effects on the homoepitaxial and heteroepitaxial growth of Ge on Si are elucidated.
Our calculations are based on the density functional theory(DFT)dft within the local density approximation(LDA)lda . We use a norm-conserving pseudo-potentialNorm and the plane-wave basis set to perform the molecular dynamics simulation via the Car-Perrinello schemeCP . The surface is modeled by a p(4x4) surface cell consisting of six Si layers and a nine-layer thick vacuum. The lower surface is passivated by hydrogen. While the bottom two Si + H layers are fixed, the rest of the atoms are fully relaxed. We used an energy cutoff of 10 Ry with one special k-point for the supercell Brillouin zone integration. Increasing the cutoff to 12 Ry or adding sampling k points only change the total energy by less than 0.1 eV/atom, while the change in the energy difference between configurations is less than 0.01 eV/atom.
I Single adatom adsorption and diffusion
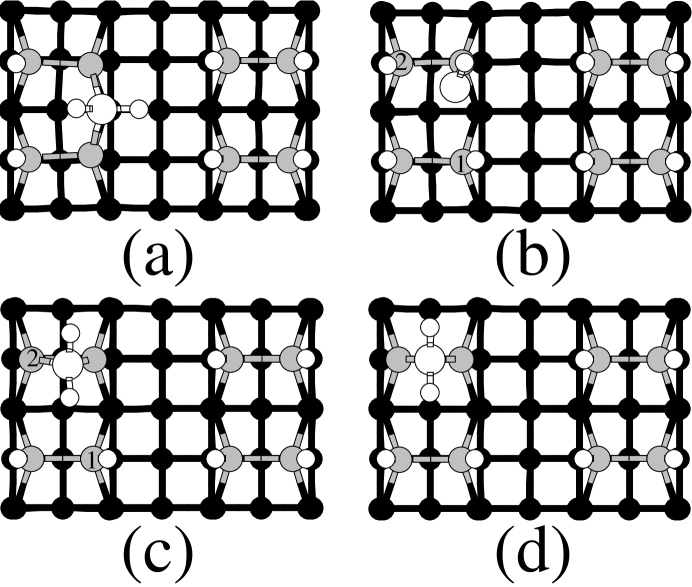
. In our calculation, we mimic actual growth process by placing a Si adatom above the H/Si(100) surface and then let it move. We find that the adatom slowly goes to one of the two lowest energy sites shown in FIG. 1(a) and (d). In qualitative agreement with the previous calculations by Nara et al.Ohno , Jeong and OshiyamaOshiyama , and Lee et al.lee , the capture of H by the Si adatom from the hydrogenated surface is spontaneous. However, different from their studies, we find that in both cases, the Si adatom causes spontaneously segregation of, not one, but two hydrogen atoms from the nearby Si-Si dimers to form highly stable Si-H2 complexes with the adatom. This finding is consistent with a recent experimentShen , in which it was shown that most of the H atoms remain to be on top of the surface during homoepitaxial growth.
While the atomic structures in FIG. 1(a) and (d) resemble that of Si adatom on the barebrocks and on hydrogenated surfaceshong , they differ considerably from Refs.Ohno ; Oshiyama ; lee , in which the Si adatom diffusion pathways have been calculated. In the work of Jeong and OshiyamaOshiyama and Lee et al.lee , the Si adatoms assume only high-energy configurations (as determined from the present calculations) that involve either one or zero H atom. Not surprisingly, the calculated diffusion barriers are low (0.7 and 1.0 eV, respectively, in Ref.Oshiyama for diffusions parallel and perpendicular to the surface dimer row). In contrast, Nara et al.Ohno considered a different diffusion pathway involving a two-step process, intra and inter (1x1) cell hopping where the capture and release process of the hydrogen atoms also plays a key role. It was concluded that while an H2 capture significantly lowers the energy of the Si adatoms, it is advantageous to move the adatom around within the (1x1) cell with only one H atom. The calculated intra-cell barrier is 0.5 eV. However, only one of the low-energy configurations in FIG. 1, i.e., (d), was considered in the calculation. As a result, diffusion out of the (1x1) cell (inter-cell hopping) is difficult. Nara et al. suggestedOhno that to diffuse across cells, the Si adatom must temporarily loss both of the H atoms to become bare silicon. This unfavorable configuration leads to, on top of the 0.5-eV intra-cell barrier, the unphysical large inter-cell barriers of 1.0 and 1.2 eV, respectively, for diffusions parallel and perpendicular to the dimer row.
In the present study, we consider adatom diffusion along a path connecting the low-energy H2-capture configurations shown in FIG. 1(a) to (d). The edge-Si adatom in FIG. 1(a) is the ground state configuration. Interestingly, because this structure has a mirror symmetry in the (10) plane, inter- and intra-cell diffusions make no difference, in contrast to the findings of Nara et al.Ohno . FIG. 1(b) shows a transition state where the displaced Si adatom gives back one of the H atoms to the surface atom, labeled 1. The energy is 0.5-eV higher than the ground state due to the “quasi” twofold coordination. FIG. 1(c) shows another transition state where the Si adatom recaptures a second H from the surface atom, labeled 2. The diffusing adatom eventually lands on top of the Si-Si dimer in FIG. 1(d), which is only 0.03 eV higher in energy than the ground state. The Si adatom can diffuse further up along the dimer row in a reversed order of (d) to (a), and so on. The calculated upper bound for the diffusion barrier is 0.7 eV.
With the 0.7-eV barrier, a growth temperature of 400K, and with the typical vibration frequency for the surface atoms of boro , we estimate that the diffusion event happens at a frequency of . The Si adatom is ready to diffuse along the dimer row. On the other hand, diffusion perpendicular to the dimer row is much more difficult. There are two reasons for this: (i) diffusion across the dimer rows requires the adatom to give back both H atoms, which is energetically costly, and (ii) in the middle of the trough, the adatom is to a large extent unbonded.
II Formation of the adatom clusters
. The above discussion shows that Si adatom diffusion rate is not the reason for the disruption of silicon homoepitaxy growth with 1ML H coverageTromp . Instead, Si adatoms should readily diffuse, at least parallel to the dimer row. This leads to the possibility of adatom clustering, which will be considered next.
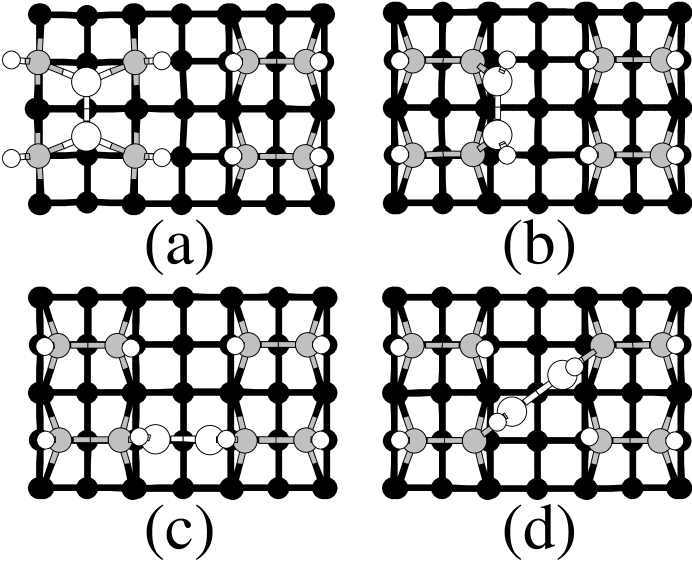
FIG. 2 shows the calculated low-energy Si-adatom pairs along with their energies. Throughout the paper, the energy of the edge-Si adatom in FIG. 1(a) is taken as the energy zero. Given the negative energies in FIG. 2, it is clear that the formation of the pairs is energetically favored. The atop-dimer in FIG. 2(a) is typical of the surface dimers, whereas the edge-dimer and in-trough dimer in FIG. 2 (b) and (c) are not, although they have lower or comparable total energy. A closer examination of the latter reveals that in both cases the Si ad-dimer is engaged in a planar configuration with nearly 120∘ bond angles, not seen on bare siliconlee1 ; boro ; zhang ; bedr .
Recently, it has been suggested that adatoms may diffuse in pairs with a rate comparable to or even faster than individual adatomslee1 ; boro . Here, we study such a possibility. Consider the edge-dimer configuration in FIG. 2(b): In order to become the in-trough dimer in FIG. 2(c), it is required to go through an intermediate step as shown in FIG. 2(d). Note that the ad-dimer diffusion parallel to the dimer row is simply a repeat of the pattern in FIG. 2, i.e., (b)(d)(c)(d)(b), etc. The corresponding energy barrier is 1.2 eV. It is also interesting to note that while diffusion perpendicular to the dimer row is difficult for single adatoms, it could be much easier for ad-dimers, which could be treated separately as (i) diffusion across the dimer row and (ii) diffusion across the trough. Process (i) can be realized via the intermediate step in FIG. 2(a), which requires only the rotation of the ad-dimer with respect to the surface atoms and a transfer of the H atoms. Process (ii) is no different from diffusion parallel to the dimer row, with the resulting edge-dimer, however, on the other side of the trough. The corresponding diffusion barrier is 1.2 eV.
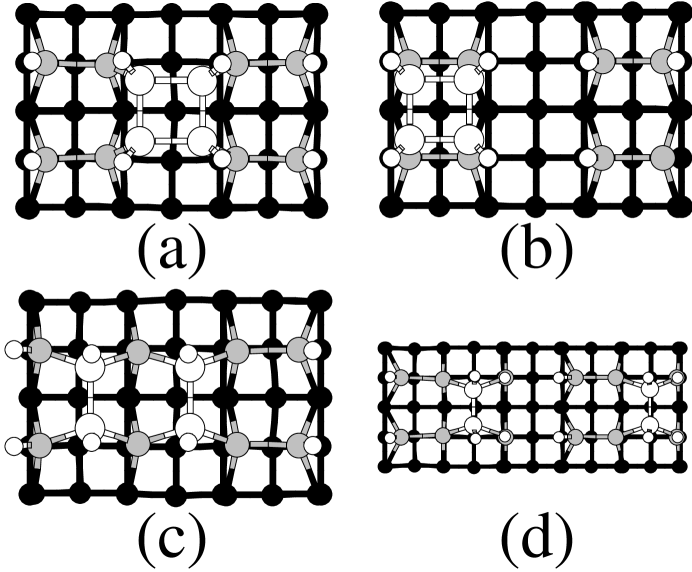
Speaking of clusters, it is also important to consider the 4-adatom clusters or the tetramers. FIG. 3 shows four such configurations made of the ad-dimer pairs. These clusters can be classified into three different categories: (i) ad-dimer pairs with direct bonding such as those in FIG. 3(a) and (b), (ii) ad-dimer pairs in close association but without any direct bonding such as the one in FIG. 3(c), and (iii) ad-dimer pairs distant apart. All the tetramers here have energies considerably lower than either the adatom or ad-dimer, for example, by as much as 1.09 eV per adatom.
In case (i), the adatoms form fourfold-ring square structures with 90∘ bond angles. With respect to the surface atoms, the trough-tetramer in FIG. 3(a) forms five- [along the (10) direction] and seven-fold [along (110)] rings, respectively. On the other hand, the atop-tetramer in FIG. 3(b) forms five- [along (10)] and four-fold [along (110)] rings, respectively. Naturally, the latter (-0.8 eV/atom) have significantly higher energy than the former (-1.02 eV/atom). In case (ii), the two ad-dimers form a second nearest neighbor (NN) pair as shown in FIG. 3(c). These are dimers similar to those on the substrate, except being one layer higher and rotated by 90∘. The NN-tetramers have the lowest energy because they involve only the five- [along (10)] and six-fold [along (110)] rings. The energy is not much lower than the trough-tetramers (only by 0.07 eV per Si), however, because of the strain, which can be easily seen by the large adatom displacements with respect to the surface atoms in FIG. 3(c). In case (iii), two distant ad-dimers are bound with an energy, -0.83 eV per Si through flipping surface dimers in between. FIG. 3(d) shows the distant tetramers with the smallest ad-dimer separation possible.
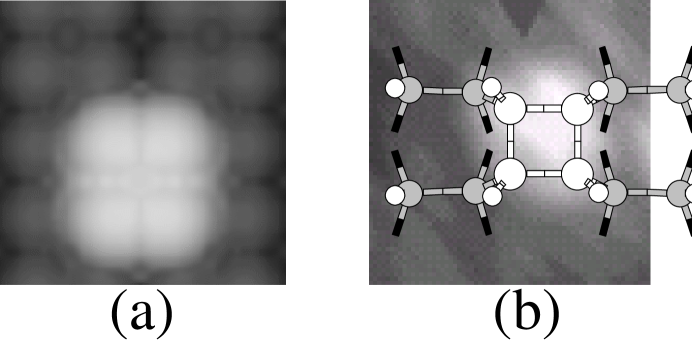
According to their effects on the homoepitaxial growth, we can also classify the tetramers in terms of being a growth mode or growth-interruption mode. By this definition, the NN- and the distant tetramers belong to the growth mode because they are consistent with the further growth of the adatom clusters into a new surface layer indistinguishable from the substrate. The trough-tetramers, on the other hand, belong to the growth-interruption mode, as here two ad-dimers are packed into a region with twice of the normal adatom density. To resume the growth from the growth-interruption mode, either one has to break up the trough-tetramers, which will cost energy, or the growth front will become defective. Recently, it has been shownspitz that the smallest stable adatom islands in the CVD growth (in which H is involved) consist of two dimers or a tetramer. FIG. 4 compares the calculated STM image for the trough-tetramer with experiment where adatom clusters are created by applying electrical pulse through STM tip coated with silicon. The relative stability of the clusters, the size and the relative position of the images with respect to the substrate suggests that the trough-tetramer model could explain the experiment.
Finally, although the NN-tetramer has a slightly lower energy than the trough-tetramer (by 0.07 eV/atom), kinetically, the trough-tetramers are more readily to form because the diffusing adatoms and ad-dimers are mostly in the forms of edge-atoms and edge-dimers, respectively. Hence, the trough-tetramers have a much higher probability to form than the NN-tetramers whose formation is an activated process in order to move the adatoms/ad-dimers from the trough region to atop the dimer row. This kinetic enhancement, together with the difficulty to break up the fourfold rings, provides an alternative explanation to the growth disruption by H.
Because part of the surface dimers in the growth mode, either the NN-tetramer in FIG. 3(c) or the distant tetramer in FIG. 3(d), is strained, replacing the Si adatoms by Ge adatoms, or replacing some of the surface Si atoms by Ge as suggested by a recent studyrudk , could lower the strain energy because Ge is larger and prefers longer bonds. Hence, one can expect that the NN- and distant tetramers to be stabilized with respect to the trough-tetramers during heteroepitaxy on Si substrates. In other words, while hydrogenation leads to the interruption of the homoepitaxy, a similar effect could be absent in the heteroepitaxy of germanium. Indeed, it is knownkahng that the presence of hydrogen assists the epitaxial growth of Ge on Si, against the formation of islands.
III Summary
In summary, we have studied the Si adatom diffusion processes on the H/Si(100)(2x1) surface by first-principles total-energy calculations. Our results show that Si adatom diffusion along the dimer row proceeds with an energy barrier significantly lower than what is required for growth disruption, whereas diffusion perpendicular to the dimer row involves the motion of adatom pairs. Study of the adatom tetramers reveals that the formation of the growth-interruption trough-tetramers could be the reason for the hydrogen induced disruption of homoepitaxial growth of silicon.
We are grateful to T. C. Shen for fruitful discussions. The work at UIUC was supported in part by DARPA DAAD19-01-1-0324. S. F. Ren was supported by NSF 9803005 and NSF 0001313. The work at NREL was supported by the U.S. DOE-SC-BES under contract No. DE-AC36-99GO10337 and by the NERSC for MPP time.
References
- (1) G. Brocks, P.J. Kelly, and R. Car, Phys. Rev. Lett. 66, 1729 (1991).
- (2) T. Yamasaki, T. Uda, and K. Terakura, Phys. Rev. Lett. 76, 2949 (1996).
- (3) B.S. Swartzentruber, A.P. Smith, and H. Jonsson, Phys. Rev. Lett. 77, 2518 (1996).
- (4) G.-D. Lee, et al., Phys. Rev. Lett. 81, 5872 (1998).
- (5) B. Borovsky, M. Krueger, and E. Ganz, Phys. Rev. B 59, 1598 (1999).
- (6) J.W. Lyding, et al., Appl. Phys. Lett. 64, 2020(1994).
- (7) M. Copel and R.M. Tromp, Phys. Rev. Lett. 72, 1236 (1994).
- (8) J.E. Vasek, et al., Phys. Rev. B 51, 17207 (1995).
- (9) T. Ogitsu, et al., Phys. Rev. Lett. 75, 4226 (1995).
- (10) J. Nara, T. Sasaki, and T. Ohno, Phys. Rev. Lett. 79, 4421 (1997).
- (11) S. Jeong and A. Oshiyama, Phys. Rev. B 58, 12958 (1998).
- (12) S. Hong and M.Y. Chou, Phys. Rev. B 58, 13363 (1998).
- (13) P. Smilauer, K. Mizushima, and D.D. Vvedensky, Phys. Rev. Lett. 81, 5600 (1998).
- (14) S.M. Lee, Y.H. Lee, and N.-g. Kim, Surf. Sci. 470, 89 (2000).
- (15) D.P. Adams, S.M. Yalisove, and D.J. Eaglesham, Appl. Phys. Lett. 63, 3571 (1993).
- (16) F.A. Reboredo, S.B. Zhang, and A. Zunger, Phys. Rev. B 63, 125316 (2001).
- (17) P. Hohenberg and W. Kohn, Phys. Rev. 136 B, 864 (1964).
- (18) G.B. Bachelet, D.R. Hamann, and M. Schlüter, Phys. Rev. B 26, 4199 (1982).
- (19) W. Kohn and L.J. Sham, Phys. Rev. 140 A, 1133 (1964).
- (20) R. Car and M. Parrinello, Phys. Rev. Lett. 55, 2471 (1985).
- (21) J.-Y. Ji, T. T. Barrus, and T.-C. Shen (unpublished).
- (22) Z. Zhang, et al., Phys. Rev. Lett. 74, 3644 (1995).
- (23) P.J. Bedrossian, Phys. Rev. Lett. 74, 3648 (1995).
- (24) J. Spitzmuller, et al., Phys. Rev. B 63, 041302 (2001).
- (25) E. Rudkevich, et al., Phys. Rev. Lett. 81, 3467 (1998).
- (26) S.-J. Kahng, et al., Phys. Rev. Lett. 80, 4931 (1998).
for the trough tetramer.