Monte Carlo simulation of the electron transport through thin
slabs:
A comparative study of penelope, geant3, geant4, egsnrc and mcnpx
Abstract
The Monte Carlo simulation of the electron transport through thin slabs is studied with five general purpose codes: penelope, geant3, geant4, egsnrc and mcnpx. The different material foils analyzed in the old experiments of Kulchitsky and Latyshev [Phys. Rev. 61 (1942) 254-266] and Hanson et al. [Phys. Rev. 84 (1951) 634-637] are used to perform the comparison between the Monte Carlo codes. Non-negligible differences are observed in the angular distributions of the transmitted electrons obtained with the some of the codes. The experimental data are reasonably well described by egsnrc, penelope (v.2005) and geant4. A general good agreement is found for egsnrc and geant4 in all the cases analyzed.
I Introduction
In Monte Carlo (MC) simulation of electron transport, the simulation of all the interactions suffered by the electrons when they go through a material, the so-called detailed simulation (DS), is, in general, unpractical because of the long computing times required to reduce the electron energies below the absorption threshold. Therefore, DS is done in practice only if the energy of the electrons is low and/or the targets are thin.
To solve the situation, “condensed history” schemes are employed in much of the usual MC radiation transport codes of general purpose. In this approach, a certain number of interactions are grouped and described by means of a multiple scattering theory ber63 . In condensed simulation (CS), electrons move in finite steps whose length is calculated at the beginning of each step, using, for example, the continuum slowing down approximation and a fixed average fractional energy loss in the step.
An alternative approach is provided by the so-called mixed simulation schemes, in which DS is used to simulate the “hard” interactions in which the angular deflections and/or the energy losses are larger than certain cut-off values, while the interactions which do not fulfill these conditions, named “soft”, are described within CS approach.
The statistical models used to determine the energy loss in CS provide good enough results if the tracking steps are not too big. On the contrary, the statistical treatment of the angular distribution linked to the multiple scattering is a much more involved task. Since the 40’s a considerable effort has been done to solve the problem and various models (e.g. Goudsmit and Saunderson, Molière, Lewis) have been developed sco63 .
Though multiple scattering theories can describe the angular deflections produced by both elastic and inelastic collisions, it has been a common practice to take care of the effects due to inelastic collisions by correcting the distributions calculated considering only elastic collisions ber88 . Only recently, Negreanu et al. neg05 have treated both elastic and inelastic collisions on the same footing, using accurate partial-wave differential cross sections.
The importance of the elastic scattering in the interaction of the electrons with the materials and, in particular, in the dosimetry of these particles, has been pointed out by different authors. Andreo et al. and93 studied in detail the limitations of the implementations of the Molière theory to be used in CS. Li and Rogers li95 compared the egs4 results with those obtained by integrating analytically the Molière distribution, with those quoted in ICRU Report 35 icru35 and with the experimental data of Hanson et al. han51 . Urbán urb02 carried out a comparison of the angular distributions obtained with geant4 with the same data.
In the experimental side, the data available are very scarce. To the best of our information, only Kulchitsky and Latyshev kul42 and Hanson et al. han51 have performed measurements of the multiple scattering of electrons in materials. Kulchitsky and Latyshev kul42 studied the scattering of 2.25 MeV electrons by foils of different materials from aluminum to lead. Their data were in good agreement with the Goudsmit and Saunderson theory for the elements Al, Fe, Cu, Mo, Ag and Sn, while for Ta, Au and Pb they found non-negligible differences between theory and experiment. On the other hand, Hanson et al. han51 measured the angular distributions of 15.7 MeV incident electrons scattered by thin Be and Au foils. For Au they found discrepancies with the predictions of the Goudsmit and Saunderson theory and agreement with the calculations done according to Molière theory. For Be the experimental data disagreed with the results obtained within the Molière approach.
In this work we analyze how different codes describe the scattering of electrons by thin foils of different elements. Results for geant3, geant4, penelope, egsnrc and mcnpx are compared between them and with the few experimental data available. In section 2 we give details concerning the simulations we have performed and the MC codes which we have used and which are relevant for the calculations performed. Also the way how the data have been analyzed is discussed. In section 3 we describe briefly the experiments of Kulchitsky and Latyshev kul42 and Hanson et al. han51 . Section 4 is devoted to discuss the results we have obtained: the calculations with different versions of some of the codes are discussed and the MC results are compared with the experimental data of Hanson et al. han51 and Kulchitsky and Latyshev kul42 and between themselves. In the last section we draw our conclusions.
II Monte Carlo simulations
The simulations have been carried out using an elementary geometry with a monoenergetic pencil beam impinging normally on a foil made of a given material and with a given thickness. Both source and foil are in vacuum. The incident beam defines the direction. The directions of the (primary or secondary) electrons emerging from the foils define the scattering angles which have been scored in a histogram for angles between 0 and 45 degrees with 180 bins of 0.25 degrees. The values are normalized to the solid angle unit given in stereoradian.
The statistical uncertainty in each bin is calculated as with the value per history in the bin and the number of histories followed. Through the paper, these uncertainties are given as a number between parentheses; e.g., 9.34(1) means 9.340.01.
II.1 Monte Carlo codes
As said before, we have performed calculations with various MC codes. All these codes do DS for photons. Apart from the possible differences in the photon cross sections, the main differences between the codes are in the electron/positron transport. In what follows we quote some details of the codes which are relevant for the MC simulations done here.
1. geant3
geant3 geant3 is a system of detector description and simulation tools designed for high-energy physics at CERN. It permits the MC simulation of the transport of elementary particles and different ions in elemental or compound materials for energies ranging between 10 keV and 10 TeV.
The default model for the multiple scattering is based on the Molière theory, but it is possible to select also the pure Gaussian scattering according to the Rossi formulation ros41 . If the number of Coulomb scatters is below 20, the Molière theory cannot be applied and the simulation is performed within the plural scattering regime in which the number of scatters is distributed according to a Poisson distribution.
The tracking is controlled by means of a series of parameters. DEEMAX is the maximum fraction of kinetic energy which a particle can lose in a step. This parameter as well as the multiple scattering introduce upper limits to the step length. STEMAX provides an absolute upper limit to the step length, in cm, for each tracking medium. STMIN imposes a lower limit to this step length, also in cm, which permits to accelerate the stopping of those particles with very small energies. EPSIL determines the boundary crossing precision in cm. In geant3 one can use an automatic mode for the calculation of these parameter. This is done by selecting AUTO=1. Also, it is possible to fix energy cuts for the different particles. In the calculations we have done, these cuts have been fixed to 10 keV for both photons and electrons.
In this work we have used the version 3.2114 of geant3. The simulations have been done using the automatic mode. To check the feasibility of the corresponding results, we have performed simulations for the Au foil of 18.66 mg cm-2 with eight different sets of the parameters STEMAX, DEEMAX and STMIN, varying from 0.001 to 0.1, the first two, and from 0.0001 to 0.01, the last one. Despite the fact that this is the most exigent case, because correspond to the smaller number of interactions, the results obtained are compatible (within the statistical uncertainty) with those provide by the AUTO=1 option.
2. geant4
geant4 code ago03 is an object-oriented C++ toolkit which permits the MC simulation of the radiation transport in material media for a great variety of particles, materials and energies. For the electromagnetic interactions of photons and electrons, geant4 permits to use three different physics models: Standard, Low-energy and Penelope. In this work the package Low-energy has been used.
The multiple scattering approach used in geant4 has been developed by Urbán urb02 based on the Lewis theory sco63 . The energy loss is calculated from the actual path length which is computed in every step after performing a path length correction. In addition, a lateral displacement and a scattering angle are sampled from given distributions.
In geant4, particles are produced if their energies are above given thresholds which are specified in terms of distances, for each volume in the geometry, and internally converted to energy. For the Low-energy model, the minimum value for these thresholds is 250 eV. In our calculations we have fixed 10 keV for electrons and 1 keV for photons.
Particles are followed until their kinetic energy is zero, but tracking cuts can be fixed. Other parameters (some of them not described in the geant4 manuals G4phys ; G4deve ) provide additional control of electron step. By means of the G4UserLimits class it is possible to fix a maximum step size and a maximum track length, as well as the tracking cuts above mentioned. The variable dRoverRange determines the maximum fraction of the stopping range that can be travelled by an electron in a step. The parameter finalRange fix the minimum step size below which the electron is absorbed locally. Finally, the fr variable permits to control the step size when the electron is transported away from a boundary into a new volume. Defaults are dRoverRange=0.2, finalRange=0.2 mm, fr=0.02 and no maximum step size. These are the values we have used in our simulations.
We have performed test simulations using dRoverRange=0.05, finalRange=1 nm, fr=0.02 and no maximum step size. No significant differences have been found with respect to the simulations corresponding to the default values.
We have used the versions 8.0 (patch01) of geant4 and g4emlow3.0 of the Low-energy package. Some additional simulations with the versions 4.1 and 6.0 have also been performed for comparison.
2. penelope
penelope sal03 is a general purpose MC code which performs simulations of coupled electron-photon transport. It can be applied for energies ranging from a few hundred eV up to 1 GeV and for arbitrary materials. Besides, penelope permits a good description of the particle transport at the interfaces and presents a more accurate description of the electron transport at low energies in comparison to other general purpose MC codes. Details about the physical processes considered can be found in sal03 .
In penelope electrons and positrons are simulated by means of a mixed scheme where, as said above, collisions are classified as “hard” and “soft”. The electron tracking is controlled by means of four parameters. and refer to elastic collisions. gives the average angular deflection due to a elastic hard collision and to the soft collisions previous to it. represents the maximum value permitted for the average fractional energy loss in a step. On the other hand, and are energy cutoffs to distinguish hard and soft events. Thus, the inelastic electron collisions with energy loss and the emission of bremsstrahlung photons with energy are considered in the simulation as soft interactions. The maximum step size can be controlled using the parameter .
We have used two version of this code: 2003 and 2005. In what refers to the multiple scattering the main difference between both versions is that elastic electron collisions are simulated by means of a model based on the Wentzel angular distribution sal03 in the version 2003, while in the 2005 these collisions are simulated by using relativistic (Dirac) partial-wave differential cross sections generated by using the computer code elsepa sal05 .
Some of the simulations performed with penelope have been done with a set of parameters which have been used in different simulations in which thin slabs are present (see e.g. sem01 ). We label these simulations as “safe” and the values of the parameters used are: keV, keV, . Photons were simulated down to 10 keV. Electrons and positrons were absorbed when they slow down to kinetic energies of 100 keV. The mixed scheme of the simulation in penelope permits to perform fully “detailed” simulations. We have done calculations also in this approach by selecting , keV, . In this case the absorption energies were fixed to 100 eV for all particles. In all the simulations done with penelope was taken to be 1/20 of the width of the foil, as it is recommended in sal03 .
2. egsnrc
egsnrc kaw03 is a general purpose package designed for the Monte Carlo simulation of the coupled transport of electrons and photons in arbitrary geometries. Particle energies above a few keV up to several hundreds of GeV can be considered.
Multiple scattering of charged particles is described by means of an approach developed by Kawrakow and Bielajew kaw98a in which most of the shortcomings of the Molière multiple scattering theory were fixed. Within this approach, track steps are simulated using a single scattering model for short steps and a multiple scattering model for large steps. In addition one can select between Rutherford scattering or scattering including both relativistic and spin effects. The electron transport algorithm is due to Kawrakow and Bielajew kaw98b and it is usually known as presta-ii.
In egsnrc the simulation is controlled by the following parameters: SMAXIR, which defines upper limits on the step size in each region in the geometry; ESTEPR, which fixes the maximum fractional energy loss per electron step in each region; ESTEPE, which is a global energy loss constraint, and XIMAX, which gives the maximum first Goudsmit and Saunderson moment per step. In our simulations, we have used presta-ii (which is the default transport algorithm) and, as indicated in the manual kaw98a , the default values SMAXIR=1010 cm, ESTEPR=1, ESTEPE=0.25 and XIMAX=0.5 must not be changed. The version V4-r2-2-3 has been used for calculations. Photons and electrons were followed down to 10 keV.
2. mcnpx
mcnpx mcnpx-manual is a general purpose MC code which permits the description of the transport of different particles in arbitrary materials. Photons, electrons and neutrons, as well as other 29 particles between leptons, baryons, mesons and even light ions can be considered. The upper energy limits for electrons and photons are 1 and 100 GeV, respectively. A lower limit of 1 keV is fixed for these particles.
The angular deflections in the multiple scattering of electrons are calculated according to the Goudsmit and Saunderson theory. When electron energies are below 0.256 MeV, the corresponding cross sections are obtained from numerical tabulations developed by Riley et al. ril75 . For higher energy electrons, the cross sections are approximated as a combination of the Mott and Rutherford cross sections, including a correction factor which takes care of the screening.
The particle tracking is governed by EMCPF, which is the upper energy limit for detailed photon physics treatment, EMAX, which fixes the upper limit for electron energy, and the low energy cutoffs. We have used the default value (100 MeV) for EMCPF and EMAX=20 MeV, while the low energy cutoffs were fixed to 1 keV. In our simulations we have used the version 2.4.0.
In the calculations done with mcnpx, the angular distributions obtained by using the binning indicated in Sect. II showed a stepwise shape in which various neighbour bins had the same value. This is due to the fact that the Goudsmit and Saunderson angular distribution is sampled by using the inverse transform method applied to a histogram of 34 bins with widths equal or larger than 1 degree. In the cases analyzed here, where few interactions occur, this lack of precision in the sampling produces wrong results. To solve this problem, the bins in the simulations performed with mcnpx have been enlarged to 1 degree.
III Description of the experiments
In the two experiments mentioned above, the angular distribution of electrons scattered by foils of different materials and widths were measured.
Kulchitsky and Latyshev kul42 studied the scattering of 2.25 MeV electrons by foils of Al, Fe, Cu, Mo, Ag, Sn, Ta, Au and Pb. The thicknesses (see first row in Table 1) were chosen in order to maintain the half-width of the distribution 10 degrees in all cases, thus ensuring the validity of the multiple scattering theory. Measurements for angles between 0 and 35-40 degrees were done. Electrons with energies in the range 225023 keV formed their beam.
| Al | Fe | Cu | Mo | Ag | Ta | Au | Pb | |
|---|---|---|---|---|---|---|---|---|
| thickness [mg cm-2] | 26.6 | 15.4 | 17.15 | 12.4 | 11.55 | 8.9 | 8.9 | 7.9 |
| [deg] | 9.50 | 9.60 | 10.40 | 10.25 | 10.20 | 9.85 | 9.20 | 9.70 |
| [deg] | 9.49 | 9.33 | 10.61 | 9.97 | 10.21 | 9.91 | 10.07 | 9.36 |
The data obtained were compared to the Goudsmit and Saunderson multiple scattering theory predictions. Specifically, the comparison was done for the angle at which the angular distribution reduces by a factor . Kulchitsky and Latyshev estimated the uncertainty in as 3-4% at most, but they provided only relative values of the distributions measured, what impedes absolute comparisons with our calculations.
Hanson et al. han51 measured the angular distributions of electrons scattered by thin Be (257 and 495 mg cm-2) and Au (18.66 and 37.28 mg cm-2) foils for 15.7 MeV incident electrons. In the case of Be foils, the measurements were done up to 6 degrees. For Au foils the angular range was extended up to 30 degrees. The beams included electrons with energies within 6 percent of the maximum energy.
Hanson et al. compared their experimental data to the predictions of the Goudsmit and Saunderson and the Molière theories for the angle . They do not quote the uncertainties of their measurements but provide absolute values of the distributions, what allows a more complete comparison.
The results obtained with the different MC codes have been compared to the experimental data by means of the quantities and, when possible, . This last corresponds to the maximum of the angular distribution, at . To do that we have fitted a Gaussian function
| (1) |
to the simulated angular distributions, in the angular range between 0 and the first angle larger than . The Levenberg-Marquadt method recipes has been used.
| [deg] | [deg] | [sr-1] | [sr-1] | |
|---|---|---|---|---|
| Be (257 mg cm-2) | 3.06 | 104.06 | ||
| Be (495 mg cm-2) | 4.25 | 50.23 | ||
| Au (18.66 mg cm-2) | 2.58 | 2.50 | 144.77 | 143.29 |
| Au (37.28 mg cm-2) | 3.76 | 3.71 | 65.66 | 64.68 |
The experimental data of Kulchitsky and Latyshev kul42 and Hanson et al. han51 have been reanalyzed following the same criteria used for the simulated distributions. In this way we have recalculated the “experimental” and . We call the values obtained in this way and , respectively. We give them in Tables 1 and 2 where they are compared to the values quoted in Refs. kul42 , , and han51 , and . The values have not been calculated for the experiment of Kulchitsky and Latyshev because the absolute distributions are not available in kul42 . On the other hand, the values and have not been calculated for the Be foils in the experiment of Hanson et al. because they do not provide the corresponding angular distributions.
In the case of the experiment of Kulchitsky and Latyshev (see Table 1), the maximum difference between our results and those quoted in Ref. kul42 is for Au foil (8.6%). In the case of the Au foils in the experiment of Hanson et al., the maximum difference is smaller than 3.5% (see Table 2).
To finish we mention here the fact that there is a mistake concerning the Sn data in the experiment of Kulchitsky and Latyshev. The thickness quoted in Table 1 of Ref. kul42 is incompatible with the value 10.9 degrees they obtained. All the simulations we have performed disagree by more than 20% with this value. This disagreement can be seen also in Fig. 5 of Ref. neg05 where the data were compared to calculations using the Lewis multiple scattering theory. We have not considered this foil in our discussion.
IV Results
IV.1 Comparison of different code versions
In the case of geant4 and penelope, different versions have been considered in the calculations. Here we compare the results obtained between them.

| 4.1 | 6.0 | 8.0 | ||
|---|---|---|---|---|
| Be | [sr-1] | 66.13(8) | 40.63(4) | 41.84(5) |
| (495 mg cm-2) | [deg] | 3.762(4) | 4.778(5) | 4.735(5) |
| Al | [sr-1] | 16.23(2) | 11.44(1) | 10.83(1) |
| (26.6 mg cm-2) | [deg] | 7.473(9) | 9.17(1) | 9.33(1) |
| Ta | [sr-1] | 10.13(1) | 9.72(1) | 9.34(1) |
| (8.9 mg cm-2) | [deg] | 9.51(1) | 10.03(1) | 10.04(1) |
In Fig. 1 we show the angular distributions obtained with the versions 4.1, 6.0 and 8.0 of geant4 for three different cases: 15.7 MeV electrons impinging on a Be foil with 257 mg cm-2(upper panel) and 2.25 MeV electrons incident on Al (medium panel) and Ta (lower panel) foils with 26.6 and 8.9 mg cm-2, respectively. As we can see, the calculations performed with the versions 6.0 and 8.0 provide rather similar results, while those found for the 4.1 version disagree with them. The differences are larger the smaller the atomic number of the foil material is. In order to quantify these differences we show, in Table 3 the values of the parameters and corresponding to these angular distributions. For Be and Al, is 25% larger for the version 8.0 than for the 4.1 one, while for Ta is less than 6%. On the other hand, for Be and Al, the value obtained with the version 4.1 is more than 50% larger than for the version 8.0, while is only 8% larger for Ta. From these results it is evident that the various changes in the details concerning the multiple scattering theory carried out from version 4.1 till version 8.0 (see urb02 ) are not at all negligible.
| 2003 | 2005 | ||||
|---|---|---|---|---|---|
| “safe” | detailed | “safe” | detailed | ||
| Be | [sr-1] | 75.9(1) | 76.5(1) | 95.8(2) | 97.0(2) |
| (257 mg cm-2) | [deg] | 3.640(6) | 3.620(6) | 3.173(5) | 3.141(5) |
| Be | [sr-1] | 37.51(8) | 37.73(8) | 45.7(1) | 46.1(1) |
| (495 mg cm-2) | [deg] | 5.18(1) | 5.15(1) | 4.595(9) | 4.563(9) |
| Au | [sr-1] | 107.8(2) | 119.3(3) | 126.6(3) | 146.9(3) |
| (18.66 mg cm-2) | [deg] | 3.033(5) | 2.796(5) | 2.791(5) | 2.480(4) |
| Au | [sr-1] | 51.0(1) | 53.9(1) | 59.4(1) | 64.4(1) |
| (37.28 mg cm-2) | [deg] | 4.376(8) | 4.181(8) | 4.032(8) | 3.763(7) |
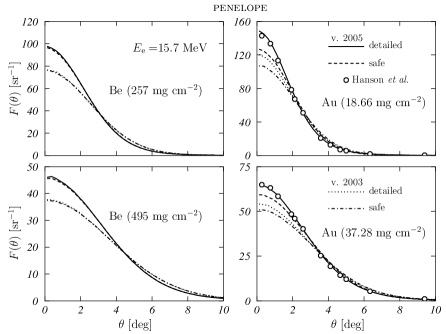
For penelope, the versions 2003 and 2005 have been considered and for each one, both “detailed” and “safe” simulations have been performed. In Fig. 2 we show the corresponding angular distributions. Full and dotted lines represent the results of detailed calculations with versions 2005 and 2003 respectively. Dashed and dashed-dotted curves correspond to the “safe” simulations. The values of the characteristic parameters are given in Table 4. Two findings deserve a comment. First, the results obtained with the “safe” simulations are very similar to those obtained with the “detailed” simulation for the two Be foils (left panels). In these cases the differences are 2% at most. However, for the Au slabs, the differences between the results obtained in both simulations are larger. For , these differences are above 20% for the version 2003 and around 15% for the 2005. The differences between the values obtained for within “safe” and detailed simulations are around 5% for the version 2003 and slightly larger for the version 2005. The discrepancies observed between “safe” and “detailed” simulations are linked to the number of interactions suffered by the electrons in the foils. In case of Be, electrons suffer hard interactions in average; for Au foils, the average number of hard interactions is smaller than 1. As indicated in sal03 , this makes “safe” simulations to be into agreement with the “detailed” ones for Be foils and to show the differences discussed in the case of the Au foils. By fixing adequately the tracking parameters these differences can be strongly reduced. For example, in the case of the thin Au foil, a reduction of the parameter to 0.01 makes the difference at degrees to diminish from 14.7 to 6.7%.
The second point to be noted concerns the differences observed between the two versions of penelope. By comparing the results corresponding to the detailed simulations, differences between 19 and 27% (for ) and 11 and 15% (for ) are found, the larger differences occurring for the thin Be slab and the smaller for the thick Au foil.
In addition, the substitution of the modified Wentzel angular distribution (used in the version 2003) by the relativistic partial-wave differential cross sections (which incorporates the version 2005) permits, in the case of the detailed simulations, a very good description of the experimental data for the Au foils (which are plotted in Fig. 2 with open circles).
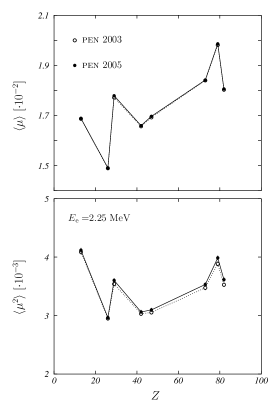
In order to go deeper into the differences observed between the two versions of penelope, we have calculated the mean values and of the quantity which is commonly used to measure polar angular deflections produced by single scattering events, instead of the scattering angle . The results of the calculations for the material foils considered in the experiment of Kulchitsky and Latyshev kul42 are shown in Fig. 3. In these calculations both the forward ( deg) and the backward ( deg) distributions have been considered to perform the corresponding integrals. It should be pointed out the almost perfect agreement between the results obtained with the two versions of the code. This was expected according to the fact that, as indicated in the penelope (v.2003) manual sal03 , the multiple scattering theory used in this version (the modified Wentzel model) was fixed to reproduce the values of and obtained for the actual partial-wave differential cross section which are used, instead, in penelope (v.2005). In principle, this equality ensures a reasonable description of the multiple scattering in “normal” simulation conditions with enough interactions. It is clear that in the cases analyzed here (where electrons go through rather thin foils) the differences between the models used show up.
In what follows we have considered only the version 8.0 of geant4 and the detailed simulations of the versions 2003 and 2005 of penelope.
IV.2 Comparison with experiment
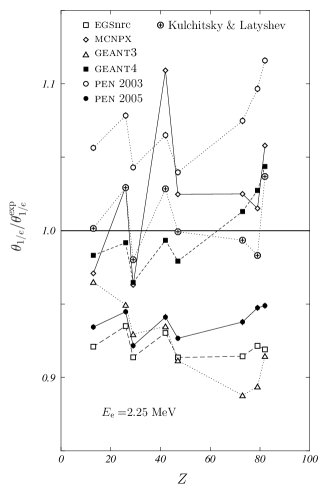
First we have compared the results of the simulations to the experimental data of Kulchitsky and Latyshev kul42 . In Fig. 4 we show the ratio of the values , obtained with the various MC codes, to the values , obtained in our reanalysis of the corresponding experimental data, as a function of the atomic number of the foil materials. In addition, the ratio is plotted as reference (see circled plus symbols.)
| egsnrc | mcnpx | geant3 | geant4 | pen 2003 | pen 2005 | |
|---|---|---|---|---|---|---|
| -8.7% (Ag) | 10.9% (Mo) | -11.2% (Ta) | 4.4% (Pb) | 11.6% (Pb) | -7.8% (Cu) | |
| -6.5% (Fe) | -3.7% (Cu) | -3.5% (Al) | -3.5% (Cu) | 4% (Ag) | -5.1% (Pb) | |
| [deg2] | 4.9 | 1.9 | 5.2 | 0.5 | 4.3 | 3.1 |
While egsnrc, geant3 and penelope (v.2005) underestimate in all cases the values of , penelope (v.2003) overestimates it for all foils and mcnpx and geant4 show, in this respect, a dependent behaviour. The differences between the values obtained for the different codes and those we have found in our reanalysis of the experimental data, which show the maximum and minimum absolute values, are shown in Table 5. As we can see, egsnrc and penelope (v.2005) maintain these differences within a range of 3%, geant3, geant4 and penelope (v.2003), within 8%, while mcnpx shows a range bigger than 14%.
In order to quantify globally these differences we have calculated, for each MC code, the sum
| (2) |
where runs over the eight different foils considered. The better codes correspond to those with the smaller values of . The results obtained are shown in the last row of Table 5. On the base of this index, the “best” results are those obtained with geant4 while the large discrepancies are obtained with geant3, egsnrc and penelope (v.2003).
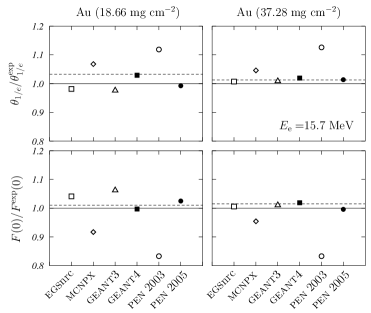
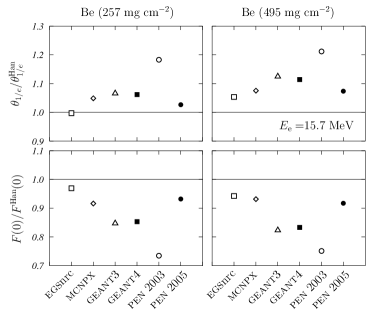
A slightly different situation is found when we compare the results of our simulations to the experimental data of Hanson et al. han51 . In Fig. 5 we show the ratio of the values (upper panels) and (lower panels) obtained with the various MC codes to the values and , respectively, for the two Au foils in the experiment of Hanson et al. han51 . The dashed lines represent the ratios between the values and quoted by Hanson et al. (see Table 2) and or . As we can see, egsnrc, geant3, geant4 and penelope (v.2005) provide a very good description of the experiment, mcnpx slightly overestimates (underestimates) () and penelope (v.2003) gives the “worst” results. The excellent agreement found for geant4 is not surprising because the multiple scattering theory developed by Urbán and which is used in this code has been tuned to reproduce these Au experimental data urb02 .
Fig. 6 shows the comparison with the experimental results of Hanson et al. han51 for the two Be foils. As said before, data are not available for these foils and we could not perform the corresponding reanalysis. In this case we have used directly the values and quoted by Hanson et al. (see Table 2) as reference values. Here the “best” description of the experiment is provided by egsnrc, mcnpx and penelope (v.2005). geant3 and geant4 show very similar results and the major differences occur for penelope (v.2003), reaching values around 20% or even larger, both for and . On the other hand, and as in the case of the Au slabs, relative results are rather similar for both foils.
IV.3 Comparison of the simulations
To finish the discussion we compare now the angular distributions obtained with the different simulation codes.
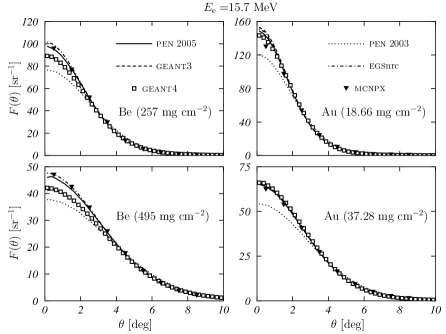
In Fig. 7 we show these distributions for the four foils of the experiment of Hanson et al. han51 . As we can see, the behaviour observed is different in the case of the Be foils (left panels) than in the Au ones (right panels). For Be, the calculations performed with egsnrc (dashed-dotted curves) show the maximum values , and are in rather good agreement with the results obtained with penelope (v.2005) (solid curves) and mcnpx (solid triangles). The geant3(dashed curves) and geant4 (open squares) results overlap for all values of and, finally, the penelope (v.2003) (dotted curves) are clearly below the other calculations at small angles. The relative differences between the maximum and minimum values of are 33% and 26.3% for the thin and the ticker foils, respectively.
In the case of the Au foils (see right panels), the situation of the penelope (v.2003) results is the same, but the other calculations are all of them grouped. This is particularly clear in the case of the thicker foil (lower right panel).
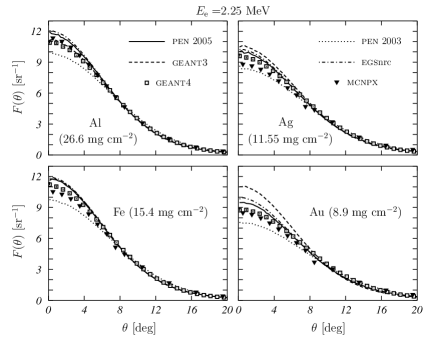
The results obtained for the different foils considered by Kulchitsky and Latyshev kul42 show up a different behaviour. In Fig. 8 we have plotted the angular distributions corresponding to the Al, Fe, Ag and Au foils. Similar results are found for the other four foils studied in this experiment. penelope (v.2003) provides the smaller values in all cases except for Mo, in which mcnpx is the code showing the minimum. egsnrc shows the larger values for Al, Fe and Cu and geant3 for the remaining foils. As we can see, the results appear to be spread for forward angles and the spreading increases with the atomic number of the material. The relative differences between the maximum and minimum values of range between 17.3% for Cu to 45.9% for Pb, being for Al and Fe. In all cases analyzed, penelope (v.2005) and egsnrc are in good agreement.
To finish, it is worth to point out the situation observed for the Au foils. As we can see (lower right panel in Fig. 8) the various codes produce rather different angular distributions for degrees. This contrasts with the overlapping shown by the results corresponding to the Au foils in Fig. 7 (see right panels.)
V Conclusions
In this work the experimental data available for multiple scattering by thin material foils have compared to the simulation results obtained with the MC codes egsnrc, mcnpx, geant3, geant4, penelope (v.2003) and penelope (v.2005).
Simulations performed with various older versions of geant4 show up non-negligible differences in the angular distributions with respect to the version 8.0, differences which are bigger the lower the of the material is.
Different simulations done with penelope have indicated large differences in the angular distributions between the versions 2003 and 2005, though the mean values and obtained with both versions are very similar, as expected. In addition, we have found discrepancies between the “safe” and “detailed” simulations which are related to the number of interactions suffered by the electrons in the foil and which can be largely reduced by an adequate selection of the tracking parameters.
We have compared the results of our simulations with the experimental data of Kulchitsky and Latyshev kul42 by means of the characteristic angle . We have found that both egsnrc and penelope (v.2005) show differences with respect to which are within a range of 3% for all foils. However, the better description of the experimental data is provided, globally, by geant4.
The comparison with the results of Hanson et al. han51 shows that egsnrc, geant3, geant4 and penelope (v.2005) give a good description of the data in the case of the Au foils. For the Be foils, the better agreement with the experiment occurs for egsnrc, mcnpx and penelope (v.2005).
All codes (except penelope (v.2003)) show a good agreement for the two Au foils in the experiment of Hanson et al. For the Be foils, the maximum relative differences between the codes at are larger than 25%. In the case of the foils in the experiment of Kulchitsky and Latyshev, these maximum relative differences grow with , reaching in the case of the Pb foil. In general, egsnrc and penelope (v.2005) are in rather good agreement for all cases studied.
The effects observed in these thin material foils appear to be non-negligible. Differences between the various MC codes are relevant and the propagation of them to other situations should be investigated in detail. One of these situations concerns the simulation of electron linear accelerators, where different thin foils are present. The combined effect of all of them could modify the conclusions found in previous works in which various codes have been intercompared (e.g. in Ref. sem01 .)
On the other hand it should be interesting to perform new experiments with different materials in order to permit a complete test of the multiple scattering theories used in the MC simulation codes of the radiation transport.
VI ACKNOWLEDGMENTS
We want to acknowledge useful discussions with F. Salvat, J.M. Fernández-Varea, M.A. Coca and D. Guirado. This work has been supported in part by the Junta de Andalucía (FQM0220) and by the Ministerio de Educación y Ciencia of Spain (FIS2005-03577).
References
- (1) M.J. Berger, in: Methods in Computational Physics, vol. 1, Academic Press, New York, 1963.
- (2) W.T. Scott, Rev. Mod. Phys. 35 (1963) 231-313.
- (3) M.J. Berger, R. Wang, in: Monte Carlo Transport of Electrons and Photons, T.M. Jenkins, W.R. Nelson, A. Rindi (Eds.), Plenum Press, New York, 1988.
- (4) C. Negreanu, X. Llovet, R. Chawla, F. Salvat, Rad. Phys. Chem. 74 (2005) 264281.
- (5) P. Andreo, J. Medin, A.F. Bielajew, Med. Phys. 20 (1993) 1315-1325.
- (6) X.A. Li, D.W.O. Rogers, Med. Phys. 22 (1995) 531-541.
- (7) Radiation dosimetry: electron beams with energies between 1 and 50 MeV, ICRU Report 35, ICRU, Bethesda, 1984.
- (8) A.O. Hanson, L.H. Lanzl, E.M. Lyman, M.B. Scott, Phys. Rev. 84 (1951) 634-637.
-
(9)
L. Urbán, Multiple scattering model in GEANT4,
available at
http://doc.cern.ch/archive/electronic/cern/preprints/open/open-2002-070.pdf - (10) L.A. Kulchitsky, G.D. Latyshev, Phys. Rev. 61 (1942) 254-266.
- (11) GEANT - Detector description and simulation tool, CERN Program Library Long Write-up W5013, CERN, Geneva, 1993.
- (12) B. Rossi, K. Greisen, Rev. Mod. Phys. 13 (1941) 240-309.
- (13) S. Agostinelli et al., Nucl. Instrum. Methods Phys. Res. A 506 (2003) 250-303.
-
(14)
http://geant4.web.cern.ch/geant4/G4UsersDocuments/UsersGuides/
PhysicsReferenceManual/html/PhysicsReferenceManual.html -
(15)
http://geant4.web.cern.ch/geant4/G4UsersDocuments/UsersGuides/
ForApplicationDeveloper/html/index.html - (16) F. Salvat, J.M. Fernández-Varea, J. Sempau, PENELOPE - A code system for Monte Carlo simulation of electron and photon transport, NEA-OECD, Paris, 2003.
- (17) F. Salvat, A. Jablonski, C.J. Powell, Comput. Phys. Commun. 165 (2005) 157-190.
- (18) J. Sempau, A. Sánchez-Reyes, F. Salvat, H. Oulad ben Tahar, S.B. Jiang, J.M. Fernández-Varea, Phys. Med. Biol. 46 (2001) 1163-1186.
-
(19)
I. Kawrakow, D.W.O. Rogers, The EGSnrc code system:
Monte Carlo simulation of electron and photon transport, NRCC Report
PIRS-701, NRC, Otawa, 2003, available at
http://www.irs.inms.nrc.ca/inms/irs/EGSnrc/EGSnrc.html - (20) I. Kawrakow, A.F. Bielajew, Nucl. Instrum. Methods Phys. Res. B 134 (1998) 325-336.
- (21) I. Kawrakow, A.F. Bielajew, Nucl. Instrum. Methods Phys. Res. B 142 (1998) 253-280.
- (22) Monte Carlo N-Particle Transport Code System for Multiparticle and High Energy Applications, RSICC Computer Code Collection Report CCC-715, LANL, Los Alamos, 2002.
- (23) M.E. Riley, C.J. MacCallum, F. Biggs, Theoretical electron-atom elastic scattering cross sections, selected elements, 1 keV to 256 KeV, Atom. Data and Nucl. Data Tables 15 (1975) 443-
- (24) W.H. Press, S.A. Teukolsky, W.T. Vetterling, B.P. Flannery, B.P., Numerical recipes in Fortran77: The art of scientific computing, Cambridge University Press, Cambridge, 1992.