STRONG MEMORY IN TIME SERIES OF HUMAN MAGNETOENCEPHALOGRAMS CAN IDENTIFY PHOTOSENSITIVE EPILEPSY
Abstract
To discuss the salient role of the statistical memory effects in the human brain functioning we have analyzed a set of stochastic memory quantifiers that reflects the dynamical characteristics of neuromagnetic brain responses to a flickering stimulus of different color combinations from a group of control subjects which is contrasted with those from a patient with photosensitive epilepsy (PSE). We have discovered the emergence of strong memory and the accompanying transition to a regular and robust regime of chaotic behavior of the signals in the separate areas for a patient with PSE. This finding most likely identifies the regions of the location the protective mechanism in a human organism against occurrence of PSE.
pacs:
05. 45. Tp; 87. 19. La; 89. 75. -kIncreasing attention has been paid recently to the study of statistical memory effects in random processes that originate from nature by means of nonequilibrium statistical physics. The role of memory has its roots in natural sciences since 1906 when the famous Russian mathematician Markov wrote his first paper on the theory of Markov Random Processes (MRP) Mark . His theory is based on the notion of an instant loss of memory from the prehistory (memoryless property) of random processes. In contrast, there are an abundance of physical phenomena and processes which can be characterized by statistical memory effects: kinetic and relaxation processes in gases gases and plasma plasma , condensed matter physics (liquids liq , solids solids , and superconductivity super ), astrophysics astro , nuclear physics nucl , quantum quant and classical class physics, to name only a few. At present, we can make use of a variety of statistical methods for the analysis of the memory effects in diverse physical systems. Typical such schemes are Zwanzig-Mori’s kinetic equations Zwanz , generalized master equations and corresponding statistical quantifiers hanggi , Lee’s recurrence relation method Lee , the generalized Langevin equation (GLE) GLE , etc.
In this paper we shall demonstrate that the presence of statistical memory effects is of salient importance for the functioning of healthy physiological systems. Particularly, it can imply that the presence of large memory times scales in the stochastic dynamics of discrete time series can characterize pathological (or catastrophical) violation of salutary dynamic states of the human brain. As an example, we will demonstrate here that the emergence of strong memory time scales in the chaotic behavior of neuromagnetic responses of human brain as recorded by MEG is accompanied by the likely initiation and the existence of PSE.
First consider a simplified version of the Markov processes. Let us introduce the conditional probability that is found in the range at , if had the value at . For the Markov random process the conditional probability that lies in the range at given that had the values at times depends only on is as follows: The equation states that, given the state of a Markov process at some times , the forthcoming (future) state of the process at is independent of all previous states at prior times. The equation is the standard definition of the Markov random process. So, from the physical point of view the Markov process is the process without aftereffect. It means that the ”future ” and the ”past” of a process not depend each from other at known ”present”.
Measures for memory. One of the first measure of ’memory’ in physiological time series that has been studied in electroencephalographic (EEG) and magnetoencephalographic (MEG) signals, both of healthy subjects and patients (including epilepsy patients)Worrell was the detrended-fluctuation analysis (DFA) DFA .
For the quantitative description of statistical memory effects of random processes in the physiological data the use of Zwanzi-Mori kinetic equations provides an appropriate and most convenient methodology. In particular, using the reasoning put forward in Refs. Yulm one can obtain the chain of interconnected kinetic equations for the discrete time correlation function (TCF) of the fluctuation , where is a random discrete-time process, i.e., , = , where is a discretization time-step, . This zeroth-order function is then related iteratively to higher order memory functions . In this approach the set discrete memory functions (MF’s) of i order together with corresponding relaxation parameters quantify the memory effects. The full set of MF’s includes all peculiarities of the memory effects for real complex systems. For the discrete time series the whole set of functions and relaxation parameters can be calculated directly from the experimental data Yulm .
Following the reasoning put forward with Refs. Yulm provides the adequate tools to study the role of memory effects in discrete time complex systems dynamics. The characterization of memory is based on a set of dimensionless statistical quantifiers which are capable of measuring the strength of memory that is inherent in the complex dynamics. A first such measure is is whereas the as second set of measure follows as / . Here, denotes a power spectrum of the corresponding memory function , and is a Fourier transform of the memory function . The measures are suitable for the quantification of the memory on a relative scale whereas the second set proves useful for quantifying the amplification of relative memory effects occurring on different complexity levels. Both measures provide statistical criteria for the comparison of the relaxation time scales and memory time scales of the process under study. For values obeying one can observe a complex dynamics characterized by short-ranged temporal memory scales. In the limit these processes assume a -like memory with , . When one deals with a situation with moderate memory strength, and the case with both , typically constitutes a more regular and robust process possessing strong memory features.
Experimental data for PSE. Next, we can proceed directly to the analysis of the experimental data: MEG signals recorded from a group of nine healthy human subjects and in a patient with (PSE) MEG . PSE is a common type of stimulus-induced epilepsy, defined as recurrent convulsions precipitated by visual stimuli, particularly a flickering light. The diagnosis of PSE involves finding paroxysmal spikes on an EEG in response to the intermittent light stimulation. To elucidate the color-dependency of PS in normal subjects, brain activities subjected to uniform chromatic flickers with whole-scalp MEG has been measured in Ref. MEG (further details of the MEG experiment one can find in MEG .
Nine-right-handled healthy adults (two females, seven males; age range 22-27years) voluntarily participated. Subjects were screened for photosensitivity and personal or family history of epilepsy. The experimental procedures followed the Declaration of Helsinki and were approved by the National Children’s Hospital in Japan. All subjects gave their informed consent after the aim and potential risk of the experiment were explained. During the recording, the subjects sat in the magnetically shielded room and were instructed to observe visual stimuli passively without moving their eyes.
Stimuli were generated by the two video projectors and delivered to the viewing window in the shield room through an optical fiber bundle. Each projector continuously produced a single color stimulus. Liquid crystal shutters were located between the optical device and the projectors. By alternative opening one of the shutters for 50 ms, 10 Hz (square-wave) chromatic flicker was produced on the viewing distance of 30 cm. Three color combination were used : red-green (R/G), blue-green (B/G), and red-blue (R/B). CIE coordinates were x=0.496, y=0.396 for red; x=0.308, y=0.522 for green; and x=0.153, y= 0.122 for blue. All color stimuli had a luminance of cd/m2 in otherwise total darkness. In a single trial, the stimulus was presented for 2s and followed by an inter-trial interval of 3s, during which no visual stimulus was displayed. In a single session, color combination was fixed.
Neuromagnetic responses were measured with a 122-channel whole-scalp neoromagnetometer (Neuromag-122; Neuromag Ltd. Finland). The neoromag-122 has 61 sensor locations, each containing two originally oriented planner gradiometers coupled to dc-SQUID (superconducting quantum interference device) sensors. The two sensors of each location measure two orthogonal tangential derivatives of the brain magnetic field component perpendicular to the surface of the sensor array. The planner gradiometers measure the strongest magnetic signals directly above local cortical currents. From 200 ms prior responses were analog-filtered (bandpass frequency 0.03-100 Hz) and digitized at 0.5 kHz. Eye movements and blinks were monitored by measuring an electro-oculogram. Trials with MEG amplitudes fT/cm and/or electro-oculogram amplitudes V were automatically rejected from averaging. Trials were repeated until responses were averaged for each color-combination. The averaged MEG signals were digitally lowpass-filtered at 40 Hz, and then the DC offset during the baseline to was removed. At each sensor location, the magnetic waveform amplitude was calculated as the vector sum of the orthogonal components. Peak amplitude were normalized within each subject with respect to the subject’s maximum amplitude. The latency range from to was divided with bins. Then, the peak amplitudes were calculated by averaging all peak amplitudes within each bin.
Memory analysis for presence of PSE.
With our set of Figs. 1-5 we present the results of numerical calculations and the analysis of the experimental data within the framework of the nonequilibrium statistical approach for stochastic processes in the discrete complex systems Yulm . In Figs. 1 - 3 we depict the typical data for one concrete healthy subject (No. 6) in comparison with a PSE patient for the case of a Red-Blue (RB) combination of the color stimulus. To make the conclusion about the role of the statistical memory effects we also show the averaged data for the whole group of nine healthy subjects versus the patient with PSE in Figs. 4, 5.
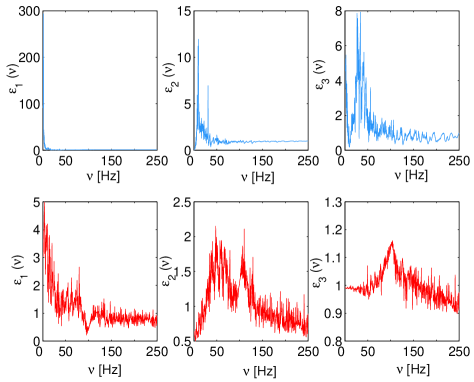
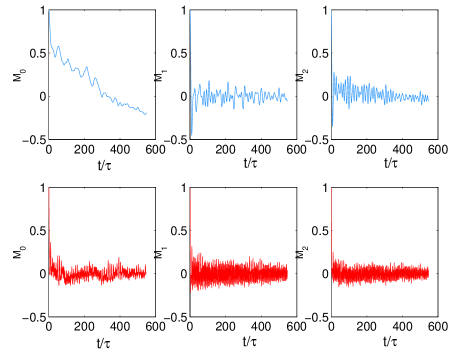
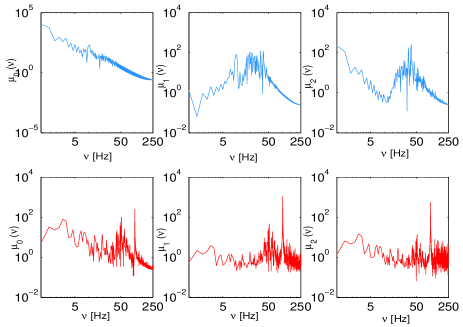
Fig. 1 depicts the time dependence of the time correlation function (TCF) and the first two MF’s , for a healthy subject (No. 6) versus a patient with PSE . The TCF displays long-ranged oscillations in the healthy and a sharp decay for the patient with PSE. As one can observe from Figs. 2, where the power spectra of TCF and MF’s are represented, the fractal dependence at order ; i.e., with in the TCF of the healthy person now transforms into a group of peaks corresponding to and rhythms in frequency behavior of the subordinate quantifiers , with . The typical picture in the patient with PSE consists in (i) the characteristic absence of the fractal dependence for , in (ii) the disappearance of the well-defined manifestation of physiological e/m rhythms and (iii) in the appearance of a single spike peak at the frequency of 101,5 Hz in the all spectra and for all sensors .
The most instructive singularities in the frequency dependence of the first three points of the measure of memory (Figs. 3) are as follows. In the healthy person we observe: the fractal dependence in the low frequency area with , the specific behavior with and 2 single peaks in the area of the frequencies of the brain rhythms for the third point . This behavior is characteristic only of the healthy subjects. The role of increasing memory and the persistent transition from a more random (healthy) into a robust, more regular regime of the underlying chaotic process at all three subordinate measures is clearly detectable in the patient with PSE. The crucial role of the strong memory at the first level, i.e. for is reflected by a decrease of the memory measure by a factor of ca. . Moreover, there occurs a drastic change of the frequency spectra for and .
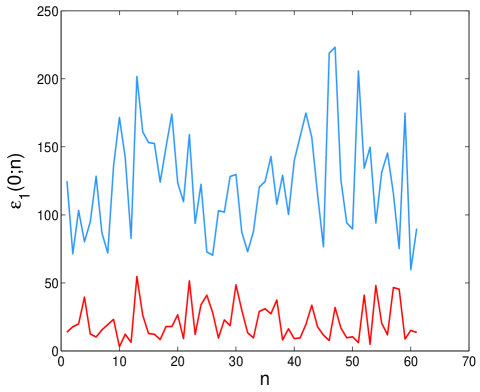
The topographic dependence of depicted in Fig. 4 demonstrates the existence of the long-range time correlation accompanied by a pronounced increase of the role of the statistical memory effects in all MEG’s sensors with sensor numbers in a patient with PSE as compared to healthy persons. There occurs about one magnitude of difference between healthy subject and subject with PSE.
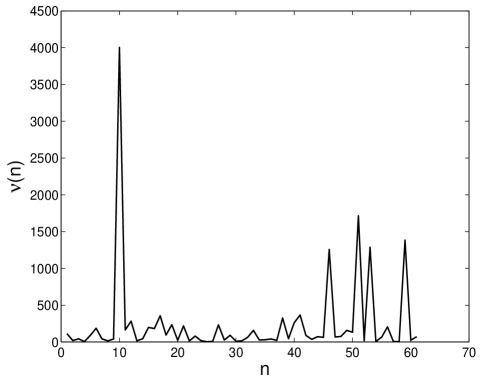
To specify the role of the strong memory we further study the spatial dependence in terms of a novel information measure, the index of memory, which is defined by:
,
see in Fig. 5. This measure quantifies the sharp revising of memory effects in individual MEG sensors in the patient with PSE versus the healthy group. The sharp increase of the role of the memory effects in the stochastic behavior of the magnetic signals is clearly visible for sensor numbers and 59. The observed points of MEG sensors locate the regions of a protective mechanism against PSE in a human organism: frontal (sensor 10), occipital (sensors 46, 51 and 53) and right parietal (sensor 59) regions. The early activity in these sensors may reflect the protective mechanism that suppresses cortical hyperactivity due to chromatic flickering.
One might remark that some earlier steps towards the understanding the normal and diseased human brain have already been set in other fields of science such as neurology, clinical neurophysiology,neuroscience and so on. The numerous studies applying linear and nonlinear time series analysis to EEG and MEG in epileptic patients are discussed in details in Refs. MEG , Parra with taking into account the neurophysiological basis of epilepsy, in particular photosensitive epilepsy. Specifically, the results of MEG suggested that a significant nonlinear structure was evident in the MEG signals for control subjects, whereas nonlinearity was not detected for the patient. In addition, the couplings between distant cortical regions were found to be greater for control subjects. The important role of combinational chromatic sensitivity in sustained cortical excitation was also confirmed. These prior finding lead to the hypothesis that the healthy human brain is most likely equipped with significantly nonlinear neuronal processing reflecting an inherent mechanism defending against hyper-excitation to chromatic flickering stimulus, and such nonlinear mechanism is likely to be impaired for a patient with PSE.
Conclusions. This study of the chaotic behavior of the neuromagnetic signals of a human MEG’s with PSE and in a group of healthy subjects elucidates the role of the statistical memory as an important criterion, measuring the functioning of the human brain. Even an insignificant amplification of the memory effects tests the pathological changes in the brain of a patient with PSE. The pronounced sharp increases of memory effects in our set of statistical quantifiers in the neuromagnetic signals indicates the pathological state of a patient with PSE within separate areas of the brain. Our approach, being conveniently constructed from the set of subordinate memory functions yielding the rate of change of the autocorrelation function of the measured complexity dynamics, allows one to characterize the neuromagnetic signals in the human brain in terms of statistical indicators. These so constructed statistical quantifiers in turn measure both the role and the strength of statistical memory which the underlying time series accommodates. Many natural phenomena are described by distributions with time scale-invariant behavior Stanley . The suggested approach allows the stochastic dynamics of neuromagnetic signals in human brain to be treated in a probabilistic manner and to search for its statistical singularities.
From the physical point of view the obtained results can be used as a test to identify the presence or absence of brain anomalies as they occur in a patient with PSE. The set of our quantifiers is uniquely associated with the emergence of memory effects in the chaotic behavior of the human cerebral cortex. The registration of the behavior of those indicators as discussed here is then of beneficial use to detect the pathological state of separate areas (sensors 10, 46, 51, 53 and 59) in the human brain of a patient with PSE. There exist also other quantifiers of a different nature, such as the Lacunae’s exponent, Kolmogorov-Sinai entropy, correlation dimension, etc., which are widely used in nonlinear dynamics and related applications, see in Ref. invar . In the present context, we find that the employed memory measures are not only convenient for analysis but also ideally suited to identify anomalous brain behavior. The search for yet other quantifiers, and foremost, the optimization of such measures when applied to complex, discrete time dynamics presents a true challenge. This objective particularly holds true when attempts are made to identify and quantify an anomalous functioning in living systems. The present work presents such an initial step towards the understanding of fundamentals of physiological processes in the human brain.
PSE is a type of reflexive epilepsy which originates mostly in visual cortex (both striate and extra-striate) but with high possibility towards propagating to other cortical regions Binnie . Healthy brain may possibly possess an inherent controlling (or defensive) mechanism against this propagation of cortical excitations, breakdown of which makes the brain vulnerable to trigger epileptic seizures in patients Porciatti . However, the exact origin and dynamical nature of this putative defensive mechanism is not yet fully known. Earlier we showed MEG that brain responses against chromatic flickering in healthy subjects represent strong nonlinear structures where as nonlinearity is dramatically reduced to minimal in patients. Here we report that patient’s brain show significantly stronger statistical memory effects than healthy brains. A complex network composed of interacting nonlinear system with memory component is inherently stable and critically robust against external perturbations. Quick inhibitory effect, that is essential for the prevention of PSE, is made possible by the faster signal processing between distant regions. Further, such network is capable to facilitate flexible and spontaneous transitions between many possible configurations as opposed to being entrained or locked with the external perturbations Bressler . In short, our findings are in line with growing body of evidence that physiological systems generate activity fluctuations on many temporal and spatial scales and that pathological states are associated with an impairment of this spatio-temporally complex structure.
We thank Dr. K. Watanabe for the experimental support. This work was supported by the Grants of RFBR 05-02-16639a) and Ministry of Education and Science of Russian Federation 2.1.1.741 (R. Y. and D. Y.) and JST. Shimojo ERATO project (S. S.).
References
- (1) A. A. Markov, Proc. Phys. - Math. Soc. Kazan University 15(4) (1906) 135, (in Russian).
- (2) S. Chapman and T. G. Couling, The Mathematical Theory of Nonuniform Gases, Cambridge University Press, Cambridge, 1958.
- (3) S. Albeverio, Ph. Blanchard, L. Steil, Stochastic processes and their Applications in Mathematics and Physics, Kluwer Academic Publ., 1990.
- (4) S. A. Rice, P. Gray, The Statistical Mechanics of Simple Liquids, Interscience Publ. New York, 1965.
- (5) R. Kubo, M. Toda, N. Hashitsume, N. Saito, Statistical Physics II: Nonequilibrium Statistical Mechanics, Springer Series in Solid-State Sciences, Springer 31 (2003) 279.
- (6) V. L. Ginzburg, E. Andryushin, Superconductivity, World Scientific Publ, 2004.
- (7) I. Sachs, S. Sen, J. Sexton, Elements of Statistical Mechanics, Cambridge University Press, Cambridge, 2006.
- (8) A. L. Fetter, J. D. Walecka, Quantum Theory of Many-Particle Physics (paperback), McGraw-Hill, New York, 1971.
- (9) R. Zwanzig, Nonequilibrium Statistical Mechanics, Cambridge University Press, 2001.
- (10) D. Chandler, Introduction to Modern Statistical Mechanics, Oxford University Press, Oxford, 1987.
- (11) R. Zwanzig, Phys. Rev. 124 (1961) 983; H. Mori, Progr. Theoret.Phys. 34 (1965) 399; 33 (1965) 423.
- (12) H. Grabert, P. Hänggi, and P. Talkner, J. Stat. Phys. 22 (1980) 537 ; H. Grabert, et al., Z. Physik B 26 (1977) 389; Z. Physik B 29 (1978) 273 ; P. Hänggi and H. Thomas, Z. Physik B 26 (1977) 85 ; P. Hänggi and P. Talkner, Phys. Rev. Lett. 51 (1981) 2242 ; P. Hänggi and H. Thomas, Phys. Rep. 88 (1982) 207.
- (13) U. Balucani, M. H. Lee, V. Tognetti, Phys. Rep. 373 (2003) 409; M. H. Lee, Phys. Rev. Lett. 49 (1982) 1072; 51 (1983) 1227; J. Hong, M. H. Lee, Phys. Rev. Lett. 55 (1985) 2375; M. H. Lee, Phys. Rev. E 61 (2000) 1769, 3571; M. H. Lee, Phys. Rev. Lett. 87 (2001) 250601.
- (14) R. Kubo, Rep. Progr. Phys. 29, 255 (1966); K. Kawasaki, Ann. Phys. 61, 1 (1970); I. A. Michaels, I. Oppenheim, Physica A 81, 221 (1975); T. D. Frank, Physica D 301, 52 (2001); M. Vogt, R. Hernander, J. Chem. Phys. 123, 144109 (2005); S. Sen, Physica A. 360, 304 (2006).
- (15) G. A. Worrell, S. D. Craunstoun, J. Echauz, B. Litt, NeoroReport 13 (2002) 2017.
- (16) C. - K. Peng, S. V. Buldyrev, S. Havlin , M. Simons, H. E. Stanley, A. L. Goldberger, Phys. Rev. E 49 (1994) 1685; C. - K. Peng, S. Havlin, H. E. Stanley, A. L. Goldberger, Chaos 5 (1995) 82; A. L. Goldberger, L. A. N. Amaral, L. Glass, J. M. Hausdorff, P. Ch. Ivanov, R. G. Mark, J. E. Mietus, G. B. Moody, C. - K. Peng, H. E. Stanley, Circulation 101(23) (2000) 215.
- (17) A. Mokshin, R. M. Yulmetyev, P. Hanggi, Phys. Rev. Lett. 95 (2005) 200601; New J. Phys. 7 (2005) 9; R. M. Yulmetyev, F. Gafarov, P. Hanggi, R. Nigmatullin, Sh. Kayumov, Phys. Rev. E 64 (2001) 066132; R. M. Yulmetyev, P. Hanggi, F. M. Gafarov, Phys. Rev. E 65 (2002) 046107; Phys. Rev. E 62 (2000) 6178.
- (18) K. Watanabe, T. Imada, K. Nihei, S. Shimojo, Neuroreport 13 (2002) 1; J. Bhattacharya, K. Watanabe, Sh. Shimojo, Int. J. Bif. Chaos 14 (2004) 2701.
- (19) J. Parra, S. N. Kalitzin, J. Iriarte , W. Blanes, D. N. Velis, F. H. Lopes da Silva, Brain 126 (2003) 1164.
- (20) H. E. Stanley, Nature 378 (1995) 554 ; H. E. Stanley, Introduction to Phase Transitions and Critical Phenomena, (Oxord University Press, Oxford, 1971); S. Havlin, L. A. N. Amaral, Y. Ashkenazy, A. L. Goldberger, P. Ch. Ivanov, K. - C. Peng, H. E. Stanley, Physica A 274 (1999) 99; 270 (1999) 309; Z. Chen, P. Ch. Ivanov, K. Hu, and H. E. Stanley, Phys. Rev. E 65 (2002) 041107.
- (21) H. Kantz, T. Schreiber, Nonlinear Time Series Analysis, Cambridge Science Series, Cambridge University Press, Cambridge 7 (2003) 370.
- (22) W. A. J. Binnie C.D., Reflex Epilepsies and Reflex Seizures Advances in Neurology, ed. by B. Zifkin, F. Andermann, A. Beaumonir and J. Rowan, Liipincott-Raven, PA (1998) 123.
- (23) V. Porciatti, P. Bonanni, A. Fiorentini, et al., Nature Neuroscience 3 (2000) 259.
- (24) S. L. Bressler and J. A. S. Kelso, Trends in Cognitive Sciences 5 (2001) 26.