Epidemic spreading and immunization with identical infectivity
Abstract
In this paper, a susceptible-infected-susceptible (SIS) model with identical infectivity, where each node is assigned with the same capability of active contacts, , at each time step, is presented. We found that on scale-free networks, the density of the infected nodes shows the existence of threshold, whose value equals , both demonstrated by analysis and numerical simulation. The infected population grows in an exponential form and follows hierarchical dynamics, indicating that once the highly connected hubs are reached, the infection pervades almost the whole network in a progressive cascade. In addition, the effects of random, proportional, and targeted immunization for this model are investigated. Based on the current model and for heterogenous networks, the targeted strategy performs best, while the random strategy is much more efficient than in the standard SIS model. The present results could be of practical importance in the setup of dynamic control strategies.
pacs:
89.75.Hc, 87.23.Ge, 87.19.Xx, 05.45.XtI Introduction
Epidemic, one of the most important issues related to our real lives, such as computer virus on Internet and venereal disease on sexual contact networks, attracts a lot of attention. Among all the models on the process of the epidemic, susceptible-infected (SI) model SI1 ; SI2 , susceptible-infected-susceptible (SIS) model SIS1 ; SIS2 , and susceptible-infected-removed (SIR) model SIR1 ; SIR2 ; SIR3 , are considered as the theoretical templates since they can, at least, capture some key features of real epidemics. After some classical conclusions have been achieved on regular and random networks, recent studies on small-world (SW) networks Watts1998 and scale-free (SF) networks BA introduce fresh air into this long standing area (see the reviews Reviews and the references therein). The most striking result is that in the SIS and SIR model, the critical threshold vanishes in the limit of infinite-size SF networks. It is also a possible explanation why some diseases are able to survive for a long time with very low spreading rate.
In this paper, we focus on the SIS model. Although it has achieved a big success, the standard SIS style might contain some unexpected assumption while being introduced to the SF networks directly, that is, each node’s potential infection-activity (infectivity), measured by its possibly maximal contribution to the propagation process within one time step, is strictly equal to its degree. As a result, in the SF networks the nodes with large degree, named hubs, will take the greater possession of the infectivity, so-called super-spreader. This assumption may fail to mimic some cases in the real world where the relation between degree and infectivity is not simply equal relation . The first example is that, in most of the existing peer-to-peer distributed systems, although their long-term communicating connectivity shows the scale-free characteristic p1 , all peers have identical capabilities and responsibilities to communicate at a short term, such as the Gnutella networks p2 . Second, in sexual contact networks , even the hub node has many acquaintances; he/she has limited capability to contact with others during limited periods SCN . Third, the referral of a product to potential consumers costs money and time in network marketing processes (e.g. a salesman has to make phone calls to persuade his social surrounding to buy the product). Therefore, the salesman will not make referrals to all his acquaintances market . The last one, in some email service systems, such as the Gmail system schemed out by Google google , the clients are assigned by limited capability to invite others to become Gmail-user after being invited by an E-mail from another Gmail-user. Similar phenomena are common in our daily lives, thus need a further investigation.
II The model
In the epidemic contact network, node presents individual and link denotes the potential contacts along which infections can spread. Each individual can be in two discrete states, whether susceptible (S) or infected (I). At each time step, the susceptible node which is connected to the infected one will be infected with rate . Meanwhile, infected nodes will be cured to be again susceptible with rate , defining the effective spreading rate as . Without losing of generality, we set . Individuals run stochastically through the cycle susceptible-infected-susceptible, which is also the origin of the name, SIS. Denote and the density of the susceptible and infected population at the time step , respectively. Then
| (1) |
In the standard SIS model, each individual will contact all its neighbors once at each time step, thus the infectivity of each node is equal to its degree. In the present model, we assume that every individual has the same infectivity . That is to say, at each time step, each infected individual will generate contacts where is a constant. Multiple contacts to one neighbor are allowed, and the contacts to the infected ones, although without any effect on the epidemic dynamics, are also counted. In this paper, with half nodes infected initially, we run the spreading process for sufficiently long time, and calculate the fraction of infected nodes averaging over the last 1000 steps as the density of infected nodes in the steady stage (denoted by ). All of our simulation results are obtained from averaging over different network realizations, and for each independent runs with different initial configurations.
III Threshold behavior
Let denote the fraction of vertices of degree that are infected at time . Then using the mean-field approximation, the rate equation for the partial densities in a network characterized by a degree distribution can be written as:
| (2) |
where denotes the conditional probability that a vertex of degree is connected to a vertex of degree . Considered the uncorrelated networks, where , the rate equation takes the form:
| (3) |
Using to denote the value of in the steady stage with sufficiently large , then
| (4) |
which yields the nonzero solutions
| (5) |
where is the infected density at the network level in the steady stage. Then, one obtains
| (6) |
To the end, for the critical point where , we get
| (7) |
This equation defines the epidemic threshold
| (8) |
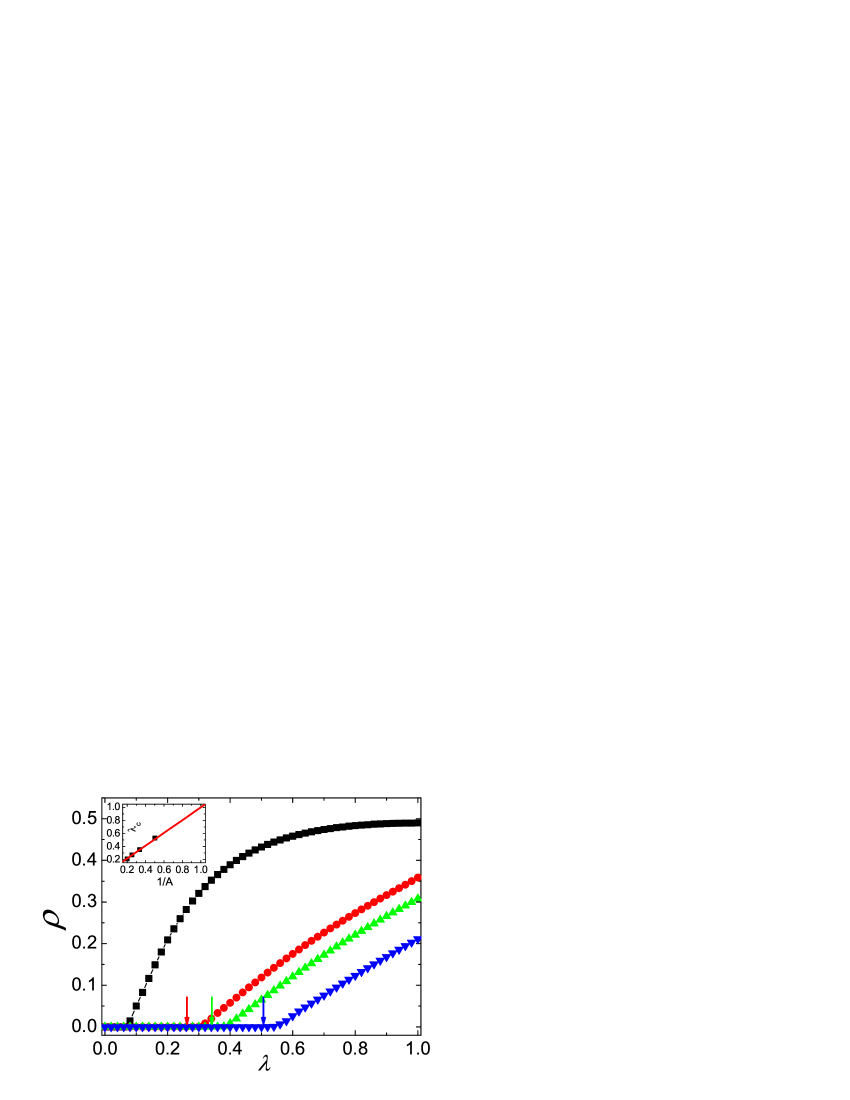
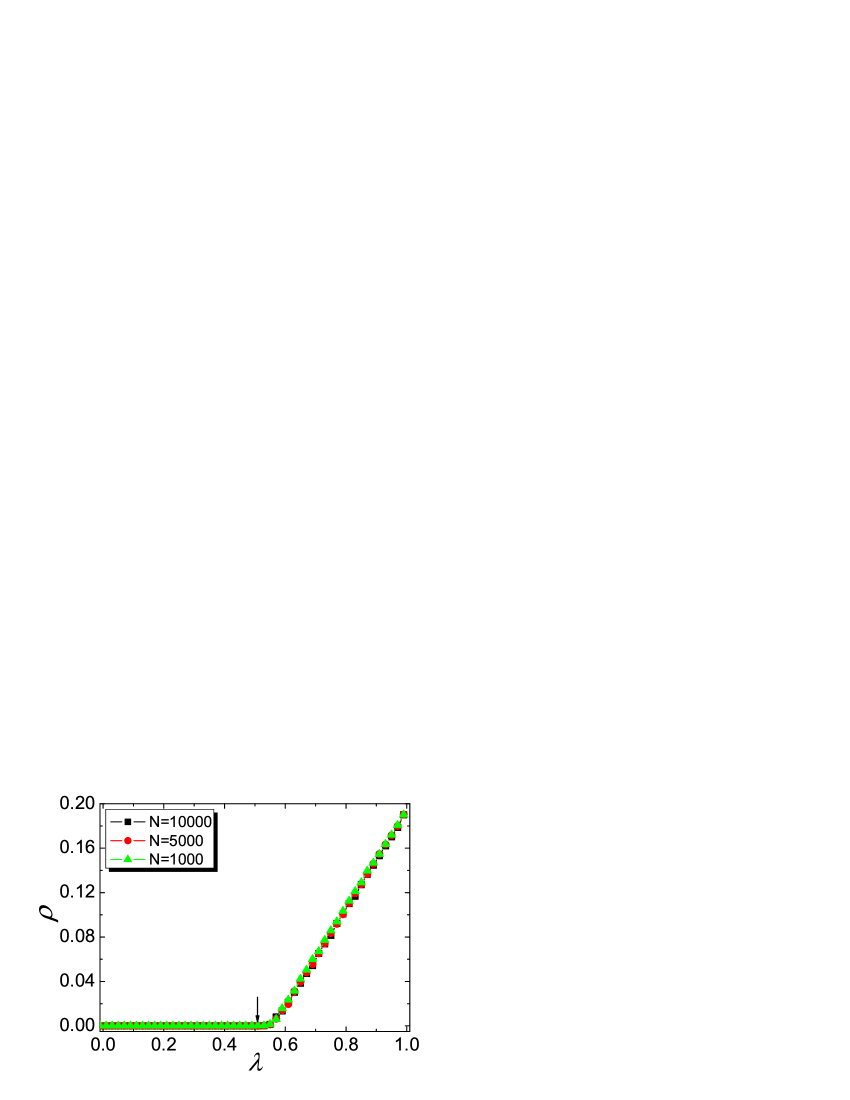
below which the epidemic prevalence is null, and above which it attains a finite value. The previous works about epidemic spreading in SF networks present us with a completely new scenario that a highly heterogeneous structure will lead to the absence of any epidemic threshold Reviews , while now, in the present model, it is instead. As shown in Fig. 1, the analytical result agrees very well with the simulations. Furthermore, it is also clear that the larger infectivity will lead to the higher prevalence .
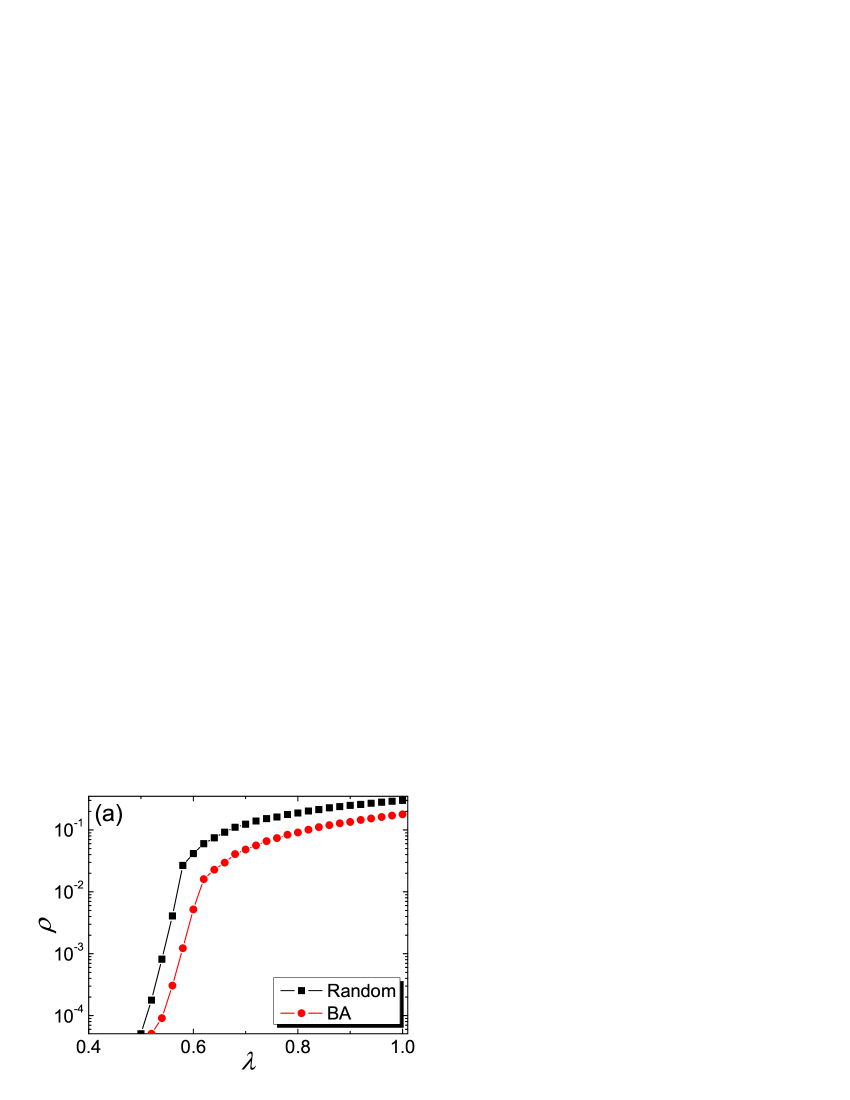
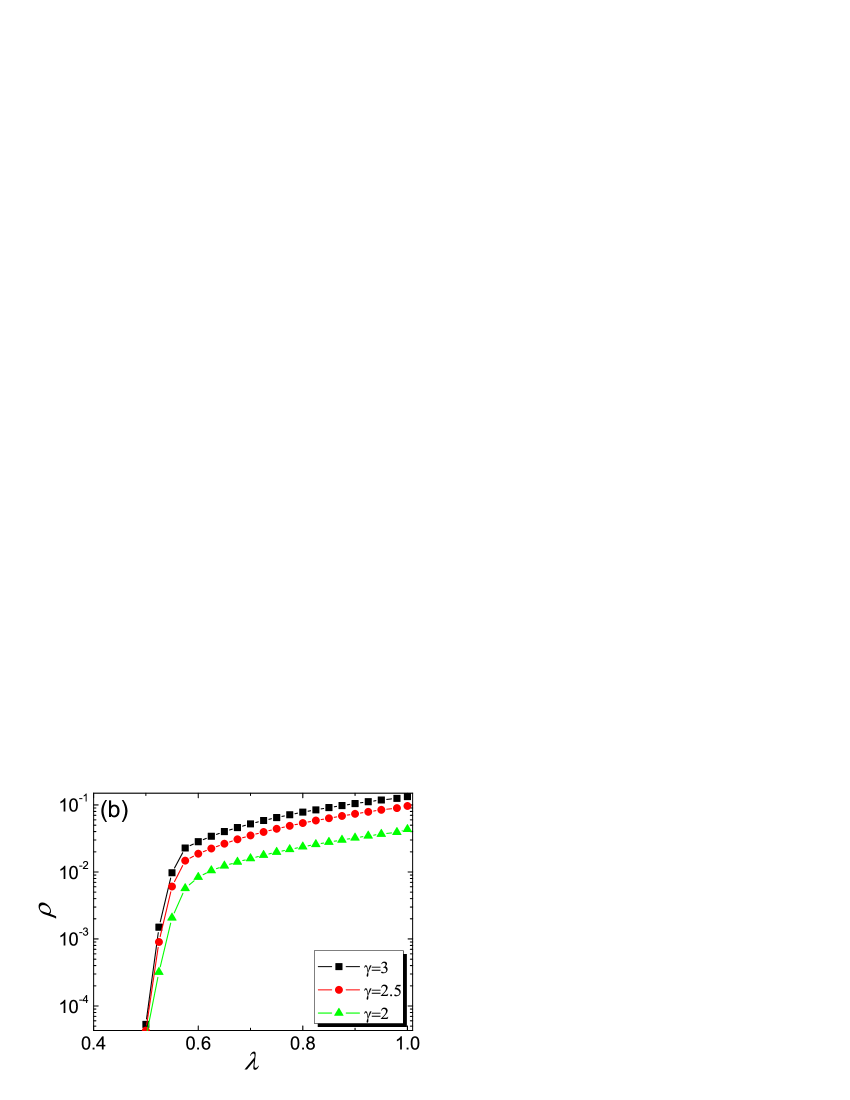
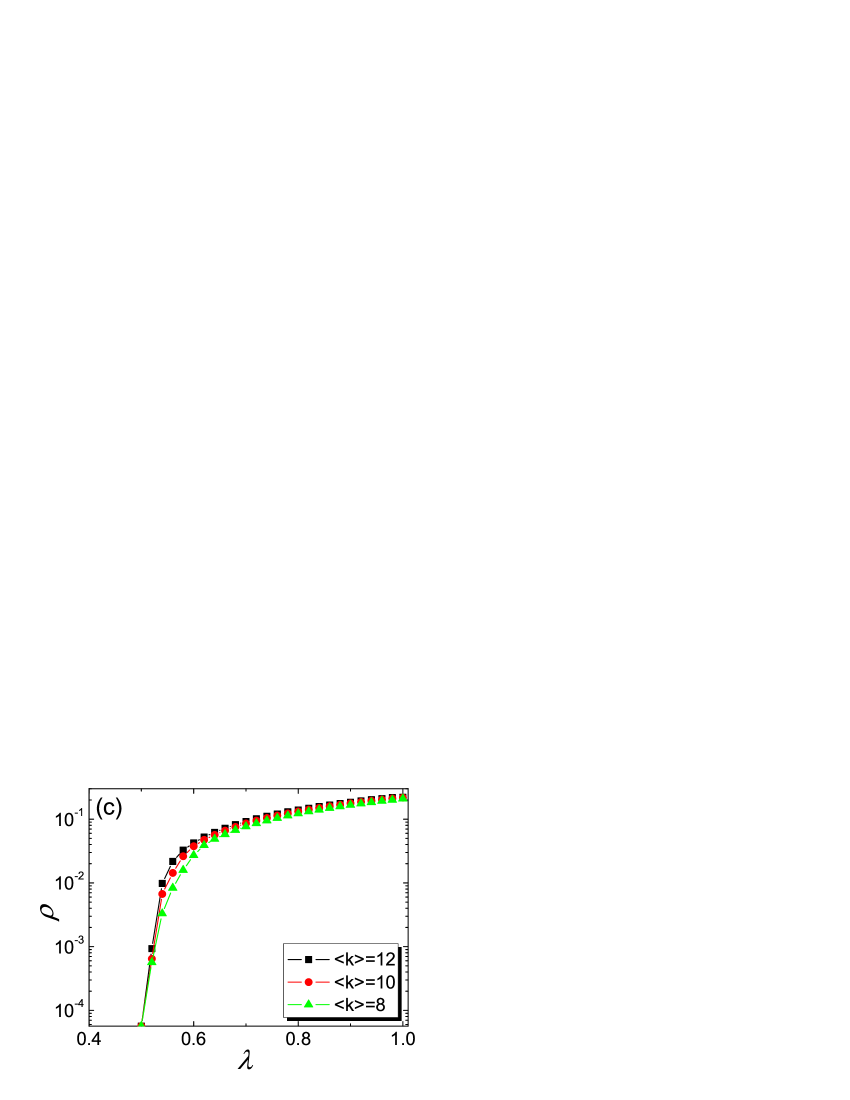
From the analytical result of the threshold value, , we can also acquire that the critical behavior is independent of the topology of networks which are valid for the mean-field approximation reason . To demonstrate this proposition, we implement the present model on various networks; These include the random networks, the scale-free configuration model EPJB1 with different power-law exponent , and the BA networks with different average degree. As shown in Fig. 2, under a given , the critical value are the same, which strongly support the valid of Eq. (8). Furthermore, there is no distinct finite-size effect as shown in Fig. 3. In the original SIS model, the node’s infectivity relies strictly on its degree and the threshold is . Since the variance of degrees gets divergent with the increase of , the epidemic propagation on scale-free networks has an obvious size effect finite-size . However, in the current model, each infected node is just able to contact the same number of neighbors, , rather than its degree. Thus the threshold value and the infected density beyond the threshold are both independent of the size .
IV Time behavior
For further understanding of the epidemic dynamics of the proposed model, we study the time behavior of the epidemic propagation. First of all, manipulating the operator on both sides of Eq. (3), and neglecting the terms of order , we obtain
| (9) |
Thus the evolution of follows an exponential growing as
| (10) |
where .
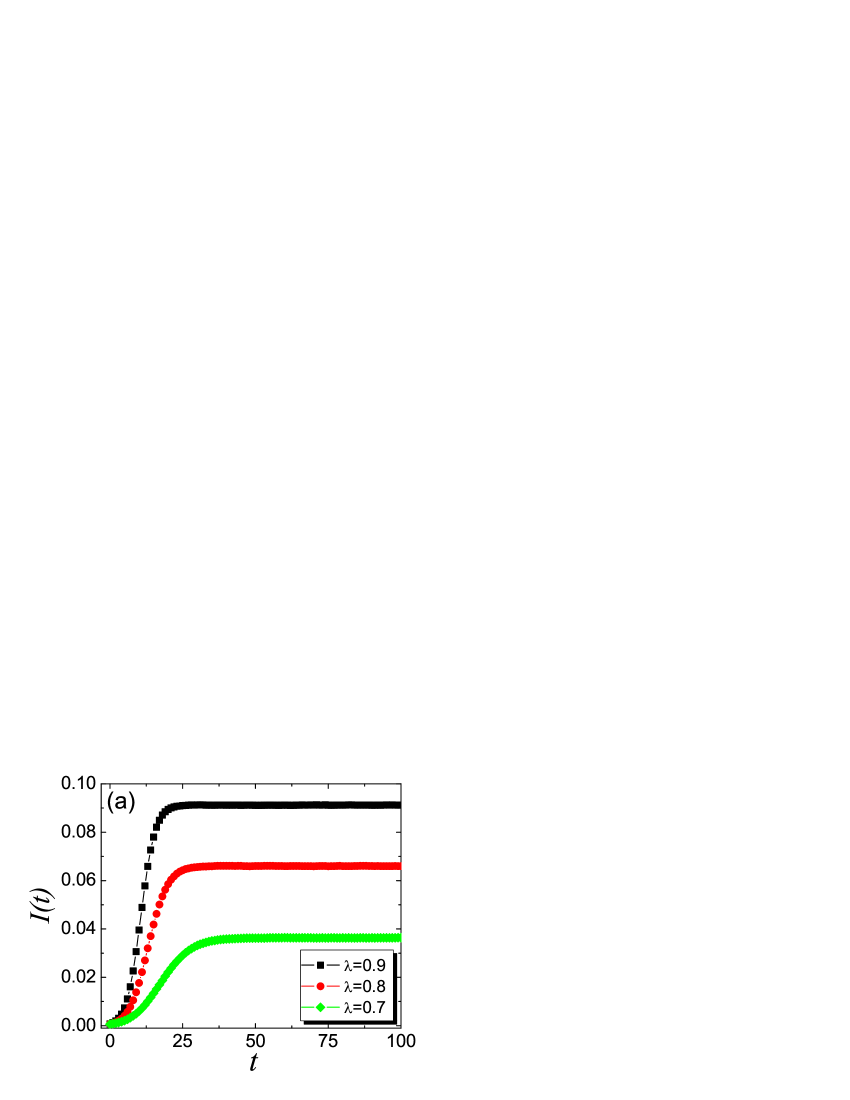
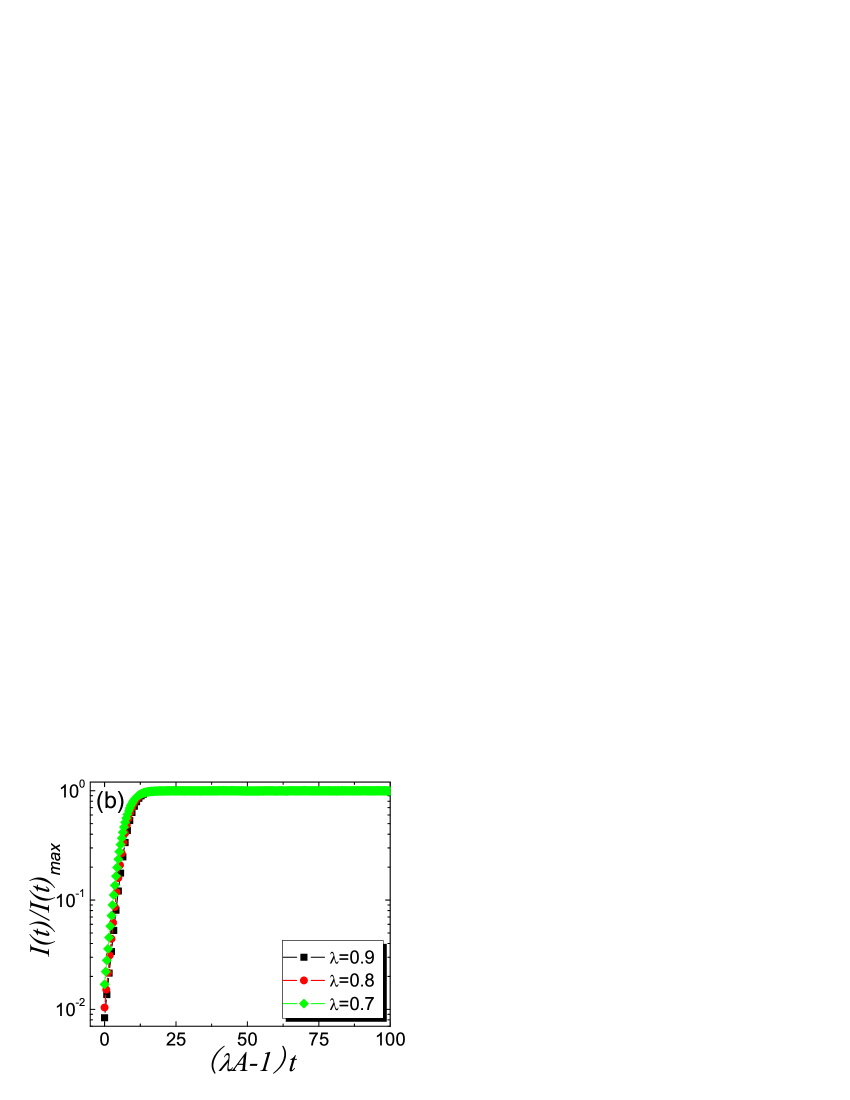
In Fig. 4, we report the simulation results of the present model for different spreading rates ranging from 0.7 to 0.9. The rescaled curves (Fig. 4(b)) can be well fitted by a straight line in single-log plot for small and the curves corresponding to different will collapse to one curve with rescaling time , which strongly supports the analytical result Eq. (10).
Furthermore, a more precise characterization of the epidemic diffusion through the network can be achieved by studying some convenient quantities in numerical experiments. First, we measure the average degree of newly infected nodes at time as
| (11) |
Then, we present the inverse participation ratio to indicate the detailed information on the infection propagation, which is defined as 21 :
| (12) |
where the weight of recovered individuals in each -degree class (here -degree class means the set of all the nodes with degree ) is defined by . From this definition, one can acquire that if is small, the infected are homogeneously distributed among all degree classes; on the contrary, if is relatively larger then, the infection is localized on some specific degree classes.
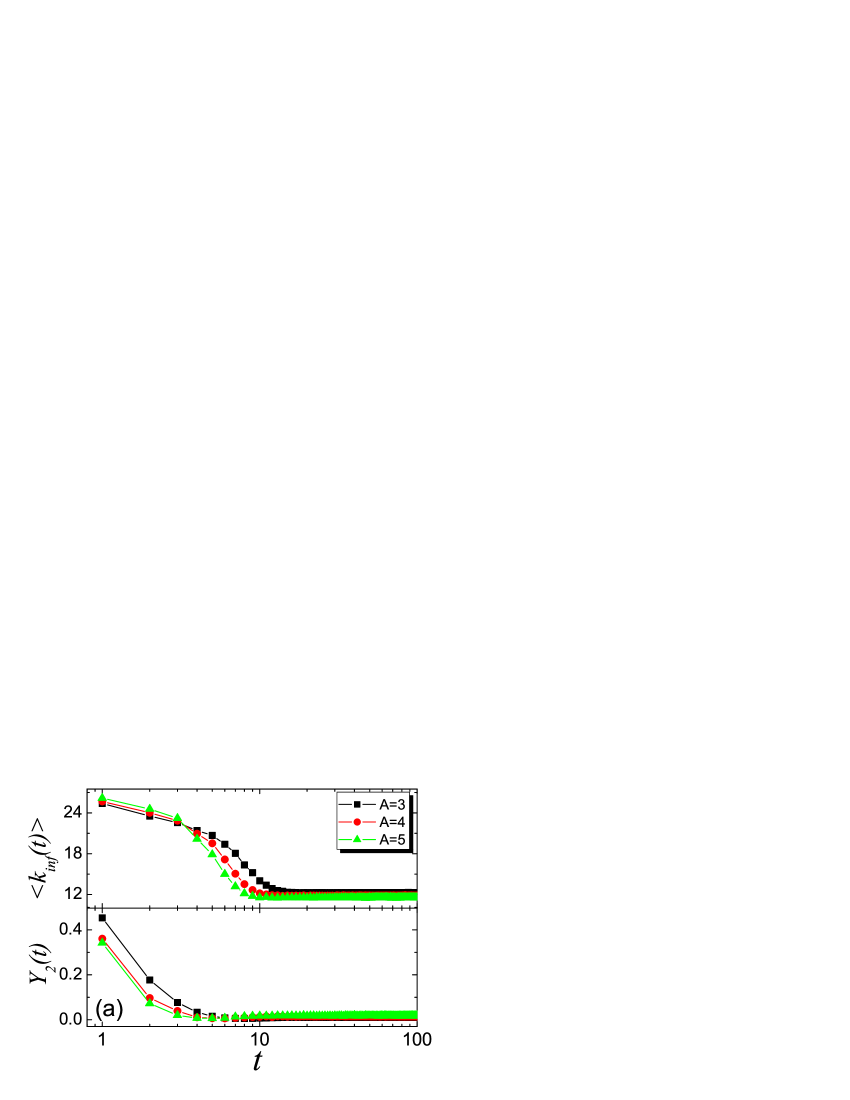
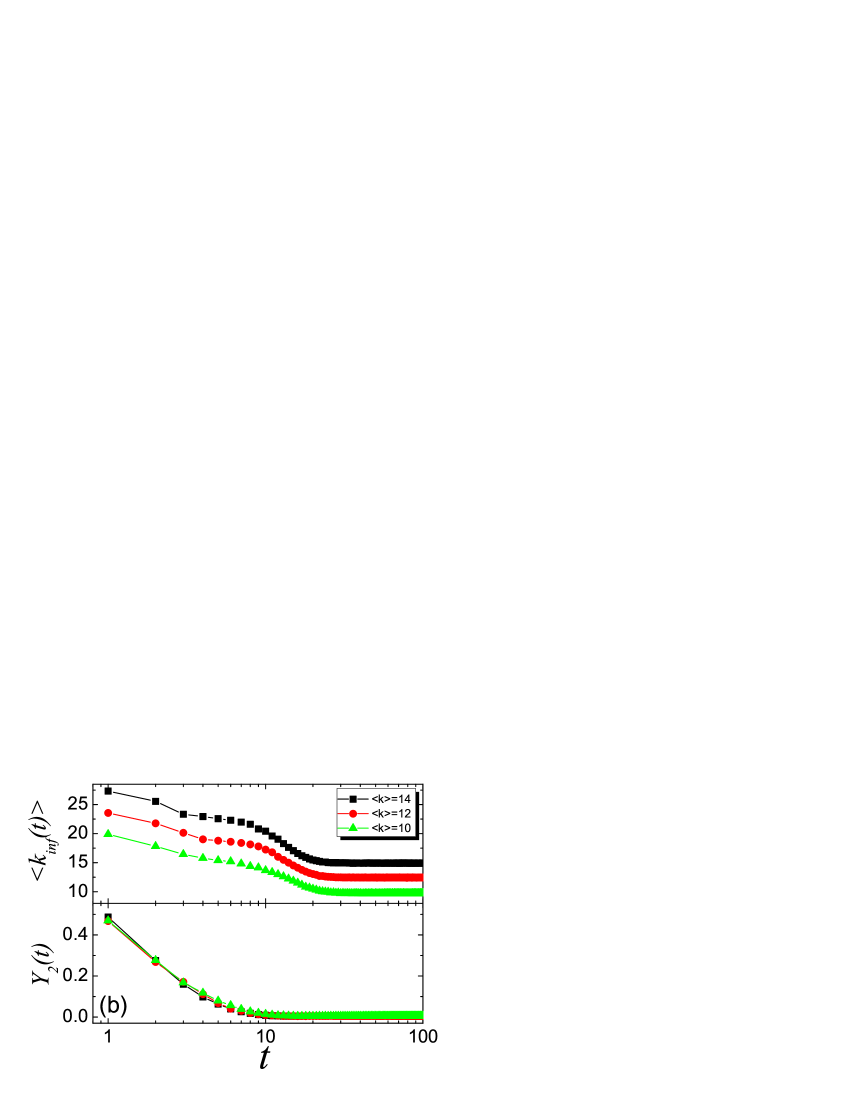
In Fig. 5, we exhibit the time behaviors of these quantities for BA networks and find a hierarchical dynamics, that is, all those curves show an initial plateau, which denotes that the infection takes control of the large degree nodes firstly. Once the highly connected hubs are reached, the infection pervades almost the whole network via a hierarchical cascade across smaller degree classes. Thus, decreases to the next plateau, which approximates the average degree .
V Immunization
Immunity, relating to the people’s strategies to struggle with the disease epidemics, shows great importance in practice Reviews . Since the current model, which can mimic some real cases more accurately, shows different characters with the standard SIS model, it requires some in-depth and detailed investigation about the immunity on this model. As we know, immunized nodes cannot become infected and, therefore, will not transmit the infection to their neighbors. The simplest immunization strategy is to select immunization population completely randomly, so-called random immunization random . However, this strategy is inefficient for heterogenous networks. Similar to the preferential attachment mechanism introduced by BA model BA , Dezsö and Barabási proposed the proportional immunization strategy proportional , in which the immunizing probability of each node is proportional to its degree. This preferential selection strategy can remarkable enhance the immunization efficiency in scale-free networks. The extreme strategy for immunization in heterogenous networks is the so-called targeted immunization target , where the most highly connected nodes are chosen to be immunized. Compared with the random immunization and proportional immunization, the targeted immunization is demonstrated as the most efficient one for various networks target-net , and several different but relative dynamics target-model .
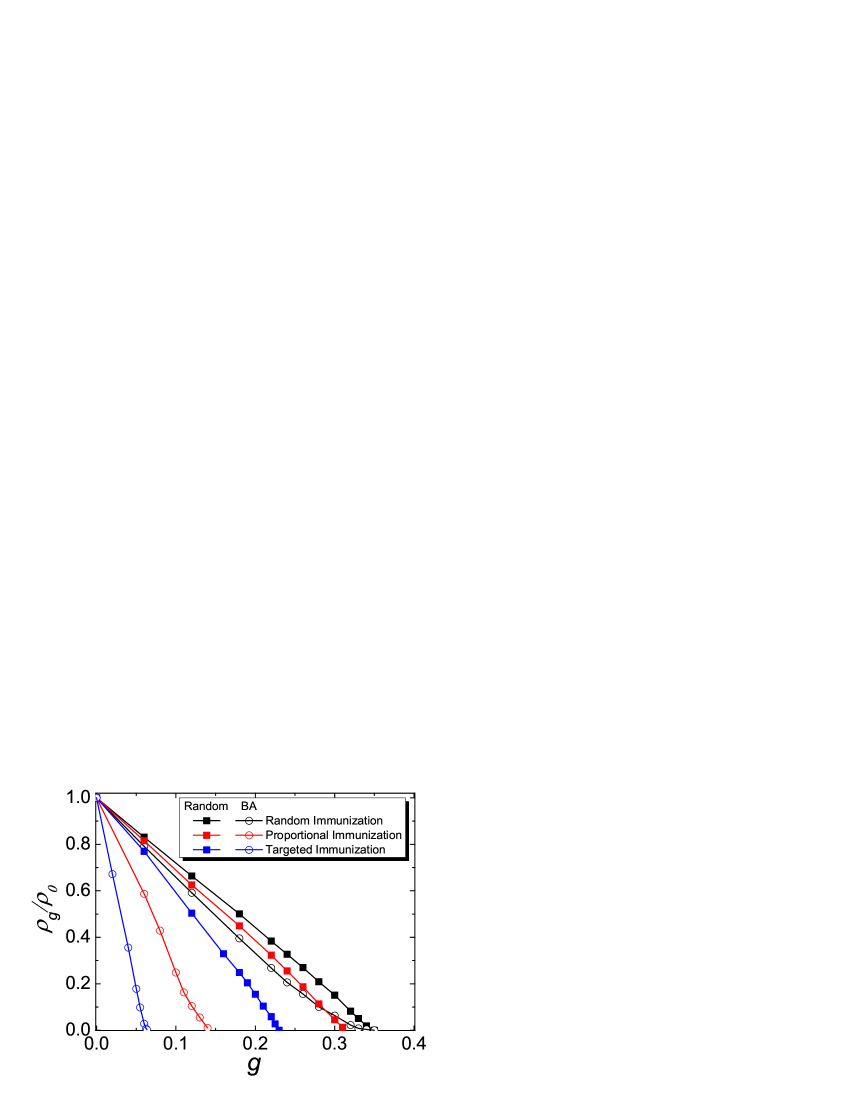
In Fig. 6, we report the simulation results about the three mentioned immunization strategies on the current model. The -axis, , denotes the fraction of immunized population, and the -axis, , represents the performance, where is the prevalence of infected nodes without immunization and the one after immunization. From the simulation results, one can find that the epidemic thresholds under random, proportional and targeted immunizations of random networks are , and , respectively. And those of BA networks are , and . It is clear from the simulation results, even in the current model where the infectivities of large-degree nodes are greatly suppressed, the targeted immunization performs best. Combine with the hierarchical behavior observed in Sec. IV, it strongly indicates that the heterogeneities of degree and infectivity could both contribute to the violent spreading of disease. Hence even for the current model with identical infectivity, the hub nodes play much more important roles in determining the dynamical property.
Note that, in this model, for heterogenous networks, the random immunization is more efficient than the standard case, and the threshold is the same for BA and random networks. Actually, the random immunization is implemented by randomly selecting and immunizing nodes on a network of fixed size . At the mean-field level, the presence of uniform immunity will effectively reduce the spreading rate by a factor . According to Eq. (8), the immunization threshold is given by
| (13) |
As shown in Fig. 6, the simulated result () agrees with the analytical result () well. To compare, the random immunization threshold of standard SIS model is given by target . Namely, to control the spreading, one have to immunize all the population as in the thermodynamic limit .
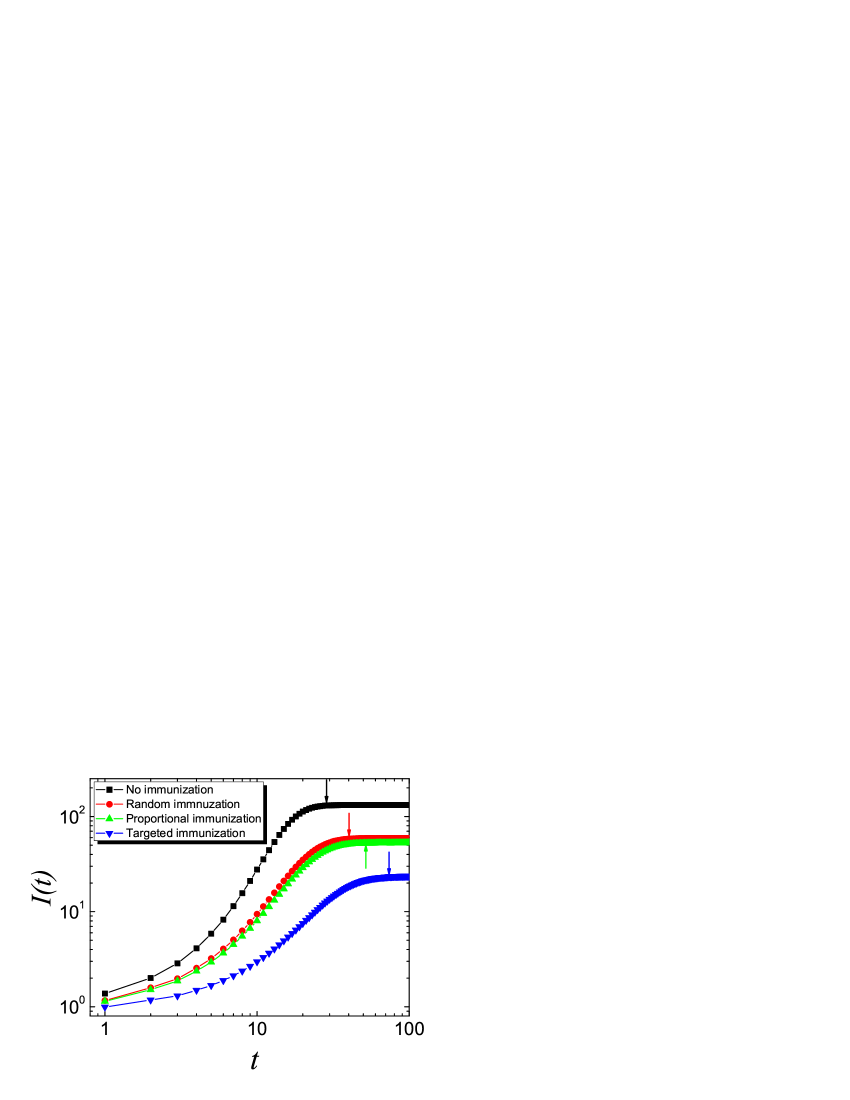
For further understanding the effects of those different immunization strategies, we study the time behaviors as shown in Fig. 7. In accordance with the above results, the spreading velocity under target immunization is the lowest. Note that, different from the standard SIS model, the random immunization can obviously slow down the spreading in the early stage even with a tiny population .
VI Conclusion
In this paper, we investigated the behaviors of SIS epidemics with the identical infectivity . By comparing the dynamical behaviors of the present model of different values of with the standard one on BA networks, we found the existence of epidemic spreading threshold. The analytical result of the threshold is provided, which agrees with numerical simulation very well. The critical value is independent of the topology of underlying networks, just depends on the dynamical parameter and the whole spreading process does not have the distinct finite-size effect. For SF networks, the infected population grows in an exponential form in the early stage, and then follows a hierarchical dynamics. In addition, the time scale is also independent of the underlying topology.
The last but not the least, the numerical results of random, proportional, and targeted immunization are presented. We found that the targeted immunization performs best, while the random immunization is much more efficient in heterogenous networks than the standard case.
Acknowledgements.
BHWang acknowledges the support of 973 Project under Grant No. 2006CB705500, the Special Research Founds for Theoretical Physics Frontier Problems under Grant No. A0524701, the Specialized Program under the Presidential Funds of the Chinese Academy of Science, and the National Natural Science Foundation of China under Grant No. 10472116. TZhou acknowledges the support of the National Natural Science Foundation of China under Grant Nos. 70471033 and 10635040.References
- (1) M. Barthélemy, A. Barrat, R. Pastor-Satorras, and A. Vespihnani, Phys. Rev. Lett. 92, 178701 (2004); M. Barthélemy, A. Barrat, R. Pastor-Satorras, and A. Vespihnani, J. Theor. Biol. 235, 275 (2005).
- (2) T. Zhou, G. Yan, and B. -H. Wang, Phys. Rev. E 71, 046141 (2005); G. Yan, T. Zhou, J. Wang, Z. -Q. Fu, and B. -H. Wang, Chin. Phys. Lett. 22, 510 (2005).
- (3) R. Pastor-Satorras and A. Vespignani, Phys. Rev. Lett. 86, 3200 (2001); R. Pastor-Satorras and A. Vespignani, Phys. Rev. E 63, 066117 (2001).
- (4) M. Boguñá, and R. Pastor-Satorras, Phys. Rev. E 66, 047104 (2002); M. Boguñá, R. Pastor-Satorras, and A. Vespignani, Phys. Rev. Lett. 90, 028701 (2003).
- (5) R. M. May and A. L. Lloyd, Phys. Rev. E 64, 066112 (2001); A. L. Lloyd, and R. M. May, Science 292, 1316 (2001).
- (6) Y. Moreno, R. Pastor-Satorras and A. Vespignani, Eur. Phys. J. B 26, 521 (2002); Y. Moreno, J. B. Gomez, and A. F. Pacheco, Phys. Rev. E 68, 035103 (2003).
- (7) G. Yan, Z. -Q. Fu, J. Ren, W. -X. Wang, Phys. Rev. E 75, 016108 (2007).
- (8) D. J. Watts and S. H. Strogats, Nature (london) 393, 440 (1998).
- (9) A.-L. Barabási and R. Albert, Science 286, 509 (1999).
- (10) R. Pastor-Satorras, and A. Vespignani, Epidemics and immunization in scale-free networks. In: S. Bornholdt, and H. G. Schuster (eds.) Handbook of Graph and Networks, Wiley-VCH, Berlin, 2003; T. Zhou, Z. -Q. Fu, and B. -H. Wang, Prog. Nat. Sci. 16, 452 (2006); S. Boccaletti, V. Latora, Y. Moreno, M. Chavez, and D. -U. Hwang, Phys. Rep. 424, 175 (2006).
- (11) J. Joo, and J. L. Leboitz, Phys. Rev. E 69, 066105 (2004); R. Olinky, and L. Stone, Phys. Rev. E 70, 030902 (2004); T. Zhou, J.-G. Liu, W.-J. Bai, G.-R. Chen, and B.-H. Wang, Phys. Rev. E 74, 056109 (2006); R. Yang, B.-H. Wang, J. Ren, W.-J. Bai, Z.-W. Shi, W.-X. Wang, and T. Zhou, Phys. Lett. A 364, 189 (2007).
- (12) M. A. Jovanovic, Modeling large-scale peer-to-peer networks and a case study of Gnutella [M.S. Thesis], University of Cincinnati (2001).
- (13) Http://www.gnutella.com.
- (14) F. Liljeros, C. R. Edling, L. A. N. Amaral, H. E. Stanley, and Y. Åberg, Nature 411, 907 (2001); W. -J. Bai, T. Zhou, and B. -H. Wang, Int. J. Mod. Phys. C (to be published).
- (15) B. J. Kim, T. Jun, J. Y. Kim, and M. Y. Choi, Physica A 360, 493 (2005).
- (16) Http://mail.google.com/mail/help/intl/en/about.html.
- (17) Note that, if the connections of the underlying networks are localized (e.g. lattices), then the mean-field approximation is incorrect and the threshold value is not equal to .
- (18) M. Molloy, and B. Reed, Random Struct. Algorithms 6, 161 (1996); M. Molloy, and B. Reed, Combinatorics, Probab. Comput. 7, 295 (1998).
- (19) R. Pastor-Satorras and A. Vespignani, Phys. Rev. E 65, 035108 (2002); D. -U. Hwang, S. Boccaletti, Y. Moreno, and R. Lopez-Ruiz, Math. Biosci. & Eng. 20, 317 (2005).
- (20) B. Derrida and H. Flyvbjerg, J. Phys. A 20 5273 (1987).
- (21) J. Müller, SIAM J. Appl. Math. 59, 222 (1998); D. S. Callway, M. E. J. Newman, S. H. Strogatz, and D. J. Watts, Phys. Rev. Lett. 85, 5468 (2000); R. Cohen, K. Erez, D. ben-Avraham, and S. Havlin, Phys. Rev. Lett. 85, 4626 (2000).
- (22) Z. Dezsö, and A.-L. Barabási, Phys. Rev. E 65, 055103 (2002).
- (23) R. Pastor-Satorras and A. Vespignani, Phys. Rev. E 65, 036104 (2002).
- (24) Z. H. Liu, Y. C. Lai, and N. Ye, Phys. Rev. E 67, 031911 (2003); D. H. Zanette, and M. Kuperman, Physica A 309, 445 (2002); Y. C. Lai, Z. H. Liu, and N. Ye, Int. J. Mod. Phys. B 17, 4045 (2003); H. Zhang, Z. H. Liu, and W. C. Ma, Chin. Phys. Lett. 23, 1050 (2006).
- (25) N. Madar, T. Kalisky, R. Cohen, D. ben-Avraham, and S. Havlin, Eur. Phys. J. B 38, 269 (2004); T. Zhou, and B. -H. Wang, Chin. Phys. Lett. 22, 1072 (2005); F. Takeuchi, and K. Yamamoto, Lect. Notes Comput. Sci. 3514, 956 (2005); W. -J. Bai, T. Zhou, and B. -H. Wang, arXiv: physics/0610138.