Effects of ion drift on time-over-threshold charge estimates using first-order integrators in thermal neutron MWPC.
Abstract
Time-over-threshold measurements of the output of a first order integration amplifier can be used as a cheap way to estimate the charge deposited on a wire in an MWPC. Even if the time scale of the first order system is seemingly much larger than the signal development time, we noticed experimentally a significant deviation from the relationship of time-over-threshold and the charge, as would be naively expected from the exponential response of the amplifier. We strongly suspect the current induced by the residual ion movement to be at least partially responsible for this observation. It is of course well-known that the ion movement is responsible for the bulk of the signal generation in a wire chamber, this is not the point ; however, the surprise is rather that this movement has influences on time scales which are so long that the finite ion movement could be thought negligible. In this paper we will treat theoretically the influence of ion movement and of AC coupling on the expected time-over-threshold relationship and confront this to the measurements on a small test MWPC in thermal neutron detection.
1 Introduction.
In thermal neutron detection in gas detectors, a relatively short trace of charge is generated as a result of the nuclear interaction between the thermal neutron and an active component in the gas such as He-3. If this charge trace is detected in a MWPC, it can be that several anode wires are hit. When treating the individual wire signals by pure discrimination, some information gets lost and deteriorates the accuracy of the position measurement. Although accurate charge measurements on each wire are possible, this is sometimes considered as an overkill. A ”poor man’s ADC”, such as a measure of time-over-threshold can maybe convey enough information in order to improve the accuracy of the measurement, while keeping the simplicity of a discrimination signal. The relationship of collected charge versus time-over-threshold (t-o-t) is deduced by the authors of ([1] and [2]) purely based on the simulation of the electronic part of the signal chain, which is probably justified because they use a fast detector. However, in this paper we will try to show that the relationship between the t-o-t and the charge in a MWPC cannot just be extracted from the impulse response of the amplifier alone. For a first-order amplifier transfer function, the t-o-t is significantly influenced by the ion movement that induces the current signal in the anode wire. Also AC-coupling has a strong influence on this t-o-t measurement.
2 Experimental setup and electrostatics.
A small prismatic MWPC has been build where 16 anode wires of 25 micron diameter and 16 cathode wires of 75 micron diameter form two parallel planes, at 2 resp. 6 mm from the rear of the detector wall. All wires are parallel and are spaced by 2.5 mm in each plane. The total detector gap is 36 mm, and a negative potential can be applied to the front window of the detector. The detector is filled with 1 bar of CF4 and 100 mbar of He-3. The anodes are polarized at 1750 V and the cathodes are put to ground potential, as are the walls of the detector except for the front window, which is put to -500V.
The calculation of the potential can be done analytically in this prismatic set up, if one uses the conformal mapping (with the elliptic integral of the first kind111, see p 43 of [4] and its inverse function, the Jacobi Amplitude):
| (1) |
and its inverse:
| (2) |
which maps the rectangle in of width 100mm and height 36mm describing the detector cross section into the upper half plane in , see [3].
The potential in the plane takes on the form [6], [8]:
| (3) | |||||
where the are the charges222We make here the approximation that we can neglect the dipole and higher multipole field contributions of the charge distribution on the surface of the wire, which is justified by the small diameter of the wire. on the wires and are their transformed positions in the -plane. is the potential applied to the front window. Imposing the potentials at the transformed wire radii then solves for the charges, giving us the solution in the -plane, and hence the correct electrostatic potential in the detector volume.
The drift field (between the front window and the cathode plane) then turns out to be equal to 216 V/cm, which gives rise to an electron drift speed of about according to Magboltz [9]. Given that in the gas mixture, the ionization trace has a total length of about 5.6mm [10], this means that the longest charge deposition times (when the trace is parallel to the drift field) are about 140ns.
3 Experimental observation of d-t-o-t.
We have a first order trans-impedance amplifier, with unit response
| (4) |
being equal to 120ns in our case (this has been verified experimentally).
We can expect, from the signal maximum onward, an exponentially decreasing signal, assuming that, as long as there is an avalanche going on, the signal will still rise (during a time which is less than 140ns). There is then a very simple relationship between this decrease-time-over-threshold (d-t-o-t) as a function of the ratio of the threshold and the signal maximum:
| (5) |
It would be the same as the genuine time over threshold (t-o-t) if the rise time were negligible (impulse response). So is a theoretical relationship between the ratio of the maximum amplitude of a signal to a fixed threshold value, , and a duration, and this duration ought to be equal to the t-o-t of a first order system when the rise time is negligible, or equal to the d-t-o-t of a first order system, even when the rise time is not negligible. The t-o-t, in such a case, will then be the sum of the d-t-o-t and the rise time.
Signals have been recorded using a digital oscilloscope with 8 bit vertical resolution and a sample period of 5ns. We will work with the ’decrease time over threshold’, which is the time measured from the moment the signal reaches its maximum to the time it falls below the threshold value. As said before, for a first order system, t-o-t and d-t-o-t are equal when the rise time is negligible. We now define the ratio of the experimentally measured d-t-o-t to what we expect using equation 5, with ,
| (6) |
measures the deviation from the exponential model; we expect if the simple exponential model is correct. Experimentally, we find the result displayed in figure 1. Clearly, some aspect of the signal is not understood, because equation 5 seems to predict times which are about a factor of 2 below the measured values. We strongly suspect that the residual induced currents by ion movement are at least partially responsible for this prolongation, and we will work out their effect theoretically using a simple model to verify whether we obtain the right order of magnitude correction.

4 The induced signal.
The electrostatic situation around wire 8 in our test chamber allows us to establish the current induction from radial ion movement. Looking at the applied potential around anode wire 8, we see that up to about we have a nice isotropic ln(r) behavior as shown in figure 2 ; after that, the potential becomes more involved and direction-dependent.

If, in order to apply the Shockley-Ramo theorem [7], we bring the 8th anode wire to 1V and all the rest to 0V, we see in figure 3 that the sensing potential around that anode goes in to a significant distance from the wire (at least ).

So up to about 20 anode wire radii333In figure 3 it is also clear that at 20 anode wire radii, the ions have induced about half of their charge., we can write, for the applied electric field: and for the sense field: , where and are respectively the applied electric field and the sense field at the surface of the anode wire (and which are proportional to the respective charges calculated on the wire). For the applied field in the test detector, we find .
Next we determine the ion movement in this field. Let us first treat the low field case and assume constant ion mobility . In that case, the induced current in the anode wire is given by:
| (7) |
and we are in exactly the same situation as the standard signal development in a cylindrical proportional counter, treated for example in [7]. The solution is given by:
| (8) |
We can define the ”drift time constant” as:
| (9) |
The problem the authors have for the CF4-He-3 gas mixture is that no value for the ion mobility seems to be available in the literature. However, if we assume a mobility of the order of which is a typical mobility for many gasses in n.c. [11] we find . The amplifier time constant (of the first order system) is 120 ns, so at first sight, is about 2 orders of magnitude smaller than and can be thought to be negligible.
If we treat the high field limit, which is probably more appropriate for the actual field strengths, and where the ion velocity is proportional to the square root of the field, we can write:
| (10) |
Working out the differential equation, we find again the same structure for the time dependence:
| (11) |
so we can again define a constant :
| (12) |
The authors didn’t find any indication of the value of this constant in the literature. We can make an educated guess in the following way: in the high field limit over in the low field limit is equal to with the field strength which separates the high field and the low field region (of the order of ). This then leads to a high field value of the order of .
The important point, however, is that no matter whether we work with the high field or the low field approximation, the analytical form of the induced current is the same.
5 Electronic response with first-order system.
In the previous section, we tried to argue that the impulse response of the linear system ”electron arrives in avalanche region” to ”current induced in anode wire” takes on the form:
| (13) |
and this both in the low field case and the high field case (but with different values of ).
Using our first order electronic response as in equation 4 which converts this current signal into a voltage signal, we obtain as an overall impulse response:
| (14) |
with the exponential integral function444, see p 925 of [5]. Often, there’s an extra AC coupling present (RC high pass filter) which takes on the form (in the Laplace domain) . Taking this into account, the overall impulse response becomes:
| (15) | |||||
6 Time-over-threshold in our model.
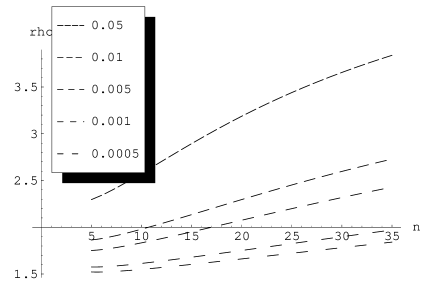
We will now calculate the ratio of the d-t-o-t of our model given in equation 14 over the simple result of equation 5. The results are shown in figure 4, for different values of the ratio .

In our measurements, we had an amplifier which was AC coupled, with a time constant . This AC coupling has a time constant which is more than two orders of magnitude larger than and could be thought of being negligible. If we use equation 15 with this value, we see in figure 5 that there is nevertheless a very strong influence on the d-t-o-t due to this AC coupling as compared to DC coupling in figure 4.
Comparing these model predictions to our experimental results of figure 1, although one cannot talk about a fully quantitative agreement555The fact that for small values of , the experimental curve rises is simply due to the finite charge collection time (which can be of the order of 140 ns) which lengthens the experimental d-t-o-t for small values of and hence small values of time., the calculated values of are in the right ballpark (around a factor of 2) for reasonable values of the unknown parameter . This strongly suggests that the ion movement has a non-negligible influence on the t-o-t measurements.
7 Conclusion
Starting from the observation that a first order model of the electronics makes predictions of t-o-t which are about a factor of 2 smaller than what is experimentally measured on a test MWPC, we tried to explain the origin of this discrepancy with a simple model of the current induced by the ion movement. This comparison indicates that the signal induced by residual ion movement has to be taken into account when modeling t-o-t systems using a MWPC, even when time scales of and differ by 2 orders of magnitude. As a side result, it is also shown that an AC coupling, even with a large time constant, also has a strong influence on the t-o-t; in this case, the t-o-t values are shortened.
References
- [1] R. Becker et al., Nucl. Instr. Meth. A 377 (1996), 459-464
- [2] P.F. Manfredi et al.,Nucl. Instr. Meth. A 439 (2000), 361-367
- [3] Murray R. Spiegel, Complex Variables, ©1964 Mc Graw Hill.
- [4] Jahnke, Emde and Lösch, Tables of Higher Functions, 6th edition ©1960 Mc Graw-Hill Book Company Ltd.
- [5] I.S. Gradshteyn and I.M. Ryzhik, Tables of Integrals, Series and Products, 4th edition ©1965 Academic Press.
- [6] Walter Appel, Mathématiques pour la physique, ©2002, HK Editions.
- [7] Glenn F. Knoll, Introduction to Radiation Detectors ©2000 Wiley
- [8] John David Jackson, Classical Electrodynamics ©1999 J.D. Jackson.
- [9] S.F. Biagi, Nucl. Instr. Meth. A283 (1989) 716
- [10] J. F. Ziegler, J. P. Biersack and U. Littmark, The Stopping and Range of Ions in Solids ©Pergamon Press, New York, 1985
- [11] F. Sauli, CERN Yellow Report 77-09