A Comparison of the Performance of Compact Neutrino Detector Designs for Nuclear Reactor Safeguards and Monitoring
Abstract
There has been an increasing interest in the monitoring of nuclear fuel for power reactors by detecting the anti-neutrinos produced during operation. Small liquid scintillator detectors have already demonstrated sensitivity to operational power levels, but more sensitive monitoring requires improvements in the efficiency and uniformity of these detectors. In this work, we use a montecarlo simulation to investigate the detector performance of four different detector configurations. Based on the analysis of neutron detection efficiency and positron energy response, we find that the optimal detector design will depend on the goals and restrictions of the specific installation or application. We have attempted to present the relevant information so that future detector development can proceed in a profitable direction.
I Introduction
Recently, there has been an increasing interest in the monitoring and safeguarding of nuclear power reactors. Over the last few years, a group from Livermore and Sandia National Laboratories has been demonstrating the feasibility of a small simple detector to monitor the anti-neutrino production during the operation of a nuclear power reactor located in San Onofre, CaliforniaBernstein:2001cz . By using the anti-neutrinos which are produced by the uranium and plutonium fuel itself during the fission process, the reactor fuel can be continuously monitored in a non-invasive way. The ability to monitor the nuclear fuel composition in real-time has advantages for both limiting the proliferation of nuclear material as well as increasing the operational efficiency of power generationr-mon ; r-mon2 .
The current experience at San Onofre has demonstrated that a small neutrino detector located within 25 m of the reactor core is easily sensitive to the power level at which the nuclear reactor is being operated. However, more sensitive tests to determine the fuel burn-up and fuel composition, while showing promising results, have shown the limitations of the detector design.
This work is an attempt to evaluate several possible directions for improved compact neutrino detector designs using the latest simulations available to the reactor neutrino community. The detectors are based on the conventional technology of liquid scintillator and photomultiplier tubes. The anti-neutrino event signature is the inverse beta-decay process: . This yields a coincident event signature, from the prompt positron annihilation and the delayed neutron capture, which is relatively free from background contamination. The use of a liquid scintillator that is doped with gadolinium improves the signal to background further by reducing the neutron capture time and increasing the energy which that capture releases.
The simulations were based on the open-source libraries of the Generic Liquid-scintillator anti-neutrino detector Geant4 simulation (GLG4sim)glg4sim ; geant4 which have been extensively used in the KamLAND experimentAraki:2004mb . In addition, we have made use of several of the improvements that have been developed within the Double Chooz collaborationArdellier:2006mn . Specifically, the development of high quality Gd doped liquid scintillator has been carefully studied and implemented within the simulation, as well as detailed improvements in material properties and PMT performance.
For this study, it was considered that there are two major features of the detector response which will be important for reactor monitoring. The first concerns the efficiency for detecting events in which the neutron is captured on Gd within the fiducial volume of the detector. The overall acceptance for anti-neutrino events is a product of positron and neutron identifications. However, the positron detection efficiency is largely a function of the environmental conditions and can more directly be improved by shielding the detector to allow a reduction in the minimum energy threshold for acceptance. The neutron efficiency, on the other hand, can be improved through design features of the detector—ensuring that the photons released through the n-Gd capture are all detected within the scintillator to allow good separation between neutron-like and positron-like energy depositions.
The second detector performance characteristic studied was the uniformity of energy response for positron events. If sufficient statistical power is available, the positron energy spectrum—which is directly related to the parent neutrino spectrum—will contain all needed information to extract the specific fuel compositions in real-time. This, however, requires that the detector itself does not contribute any meaningful distortion to the energy spectrum, whether it be a non-linear response or a non-uniformity based on position dependence.
II Detector Designs
The detector designs that were studied were intended to explore various methods of reducing the overall size of a detector while maintaining sufficient statistical acceptance to be relevant for the desired monitoring. The baseline fiducial volume of 2 m3 (2 tons) was chosen for all designs to provide a sufficient event rate for any detector within 60 m of a reactor core. In addition, an attempt was made to keep the overall size of the detector small—all dimensions less than 3–4 m.
The four designs, described in detail below, make use of the latest technological developments which have been implemented within the reactor neutrino community. All of the designs include a fiducial “target” region which is filled with a Gd doped liquid scintillator. Some of the designs include a “gamma-catcher” which is an un-doped liquid scintillator region surrounding the target whose purpose is to completely absorb the photons released by the n-Gd capture. Acrylic is used wherever a volume boundary requires optical transparency. Also, in all designs, 8” PMTs have been used and are installed within a 1 m mineral oil buffer whose purpose is to reduce the singles background by attenuating the radioactive photons emitted by the 40K in the PMT glass.
Design 1: Miniature Physics Design
![[Uncaptioned image]](/html/physics/0610257/assets/x1.png)
This design is a scaled down version, based on the state-of-the-art detectors that have been developed for the next generation reactor based neutrino oscillation measurement at Double Chooz. The detector uses nested acrylic cylinders to contain the target and gamma-catcher volumes. The 2 m3 target has a height of 1.5 m and diameter 1.3 m while the gamma-catcher has a uniform thickness of 35 cm. The 1 m thick mineral oil buffer completely surrounds the active scintillator regions and is contained within a stainless steel vessel. The stainless steel is considered to be polished with a reflectivity of 40%. A total of 282 PMTs are installed on the inner wall of the stainless steel vessel for an active coverage of 15%.
The total dimension of this detector design is 4.2 m in height and 4 m in diameter. While this is a little larger than the stated goal, it is expected that this design will provide the optimal detector performance and is therefore a useful benchmark against which the other detector designs can be compared.
Design 2: Two Sided Cylinder Design
![[Uncaptioned image]](/html/physics/0610257/assets/x2.png)
This design attempts to reduce the overall footprint and cost of the previous design by using reflective walls to eliminate most of the PMT coverage and the associated mineral oil volume. Identical to Design 1, this design has a 2 m3 target cylinder of 1.5 m height and 1.3 m diameter and a uniform 35 cm gamma-catcher. However, in this design, PMTs are only located at the top and bottom of the detector. Therefore, the outer vessel matches the diameter of the gamma-catcher, but extends an extra meter at the top and bottom to house the mineral oil buffer and the PMTs. The barrel region of the outer vessel is defined to have a diffuse reflective surface—approximating Tyvek—with reflectivity of 90%, while the top and bottom are defined to be non-reflective. A total of 30 PMTs (15 each at the top and bottom) provide an effective covering of 15%. The overall dimension of this detector is 4.2 m in height and 2 m in diameter.
Design 3: Two Sided Minimal Design
![[Uncaptioned image]](/html/physics/0610257/assets/x3.png)
In an attempt to reduce further the footprint of Design 2, this detector has eliminated the gamma-catcher entirely. To compensate for the expected efficiency loss at the edge of the target, the target volume has been expanded to match the diameter of the gamma-catcher in Designs 1 and 2. Thus the target has dimensions of 1.5 m height and 2 m in diameter for a total volume of 4.71 m3—more than double the previous values. This provides a good test of the relative benefit of increased efficiency vs. increased fiducial volume. Similar to Design 2, a 1 m mineral oil buffer and PMTs are placed at the top and bottom of the detector. As in Design 2, the barrel region of the outer vessel has a diffuse reflective surface consistent with Tyvek (90% reflectivity) and the top and bottom of the outer vessel are non-reflective. A total of 30 PMTs (15 each at the top and bottom) provide 15% coverage. The total dimension of this detector is 3.5 m in height and 2.0 m in diameter.
Design 4: Single Sided Design
![[Uncaptioned image]](/html/physics/0610257/assets/x4.png)
This detector is an alternate attempt to reduce the footprint of the detector, while maintaining the use of a gamma-catcher. In this design, PMTs are only used at the top of the detector. The target region has the same 2 m3 volume as Designs 1 and 2—1.5 m height and 1.3 m diameter. In order to improve light collection at the single end, the gamma-catcher is now a conic section with a base diameter of 2 m, a height of 2.2 m, and a top diameter of 2.50 m. This provides a thickness of 35 cm or greater around the target region. With a diffuse reflective surface similar to Tyvek (reflectivity 90%) the chosen 6.5∘ angle of the outer vessel ensures that light from anywhere in the target volume will have a path length of less than 14 m to the plane of the PMTs. While the bottom of the detector is now also reflective, the top is still defined to be non-reflective. A total of 24 PMTs are installed at the top of the 1 m mineral oil buffer providing 15% active converage. This design has a total dimension of 3.2 m in height and 2.5 m in diameter.
III Neutron Identification Efficiency
The identification of an inverse beta-decay event is largely dependent on the ability to identify the signature of the neutron capture by gadolinium. The n-Gd capture process releases between 3–10 photons with a total energy of 8 MeV. Since the positron energy deposition is usually between 1–6 MeV, it is common to define a neutron capture signature as any energy deposition of 6–10 MeV. In addition to inefficiencies which are caused by losses of some of the photons from the n-Gd capture, there will also be some neutrons which will instead be captured on free protons in the scintillator. This n-proton capture releases a single photon of energy 2.2 MeV and would not satisfy the selection criteria.
For this study, we generated a uniform distribution of neutrons within the target volume. The neutrons were generated with a kinetic energy of 2.5 MeV in a random direction. This kinetic energy is higher than that expected from inverse beta-decay events, but subsequent cross-checks demonstrated that the results presented here are consistent with those of lower energy neutrons. The simulation libraries described above were used to montecarlo the neutron thermalization and eventual capture. The ensuing optical photons from the scintillator were tracked to the photocathodes of the PMTs. Within the simulation, the PMTs used a radially dependent quantum efficiency which is consistent with experimental testing. This yielded a photon hit-count per PMT that is roughly equivalent to a number of photoelectrons. This photon hit-count has been used for all comparisons of detector response—avoiding the complications of varying electronics and data acquisition systems.
By using the truth information from the montecarlo simulation, events were selected in which the neutron was stopped or captured within the target volume. All PMT hits recorded within 100ns were summed together to create an effective total charge deposition. Fig. 1 shows the photon hit spectrum for these events from Design 1.
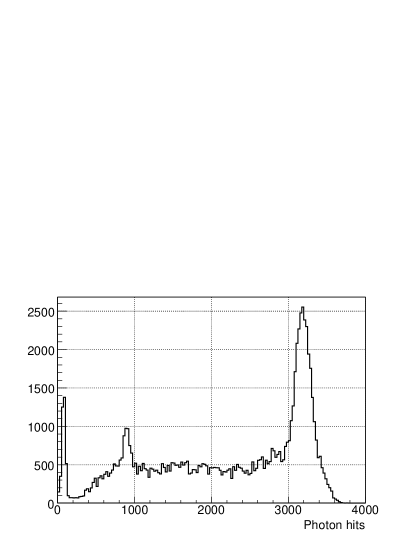
One can quite clearly see the n-Gd capture peak at around 3200 photon hits (representing 8 MeV) and the n-p capture peak at around 900 photon hits (representing 2.2 MeV).
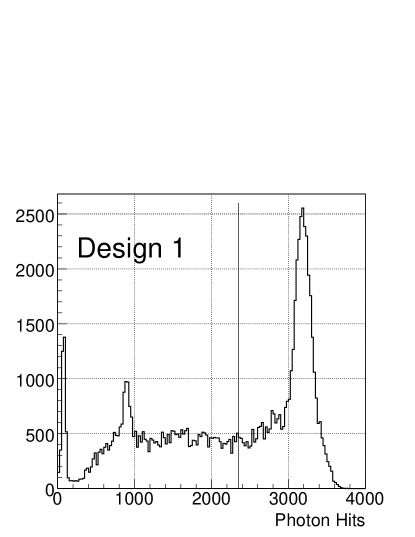
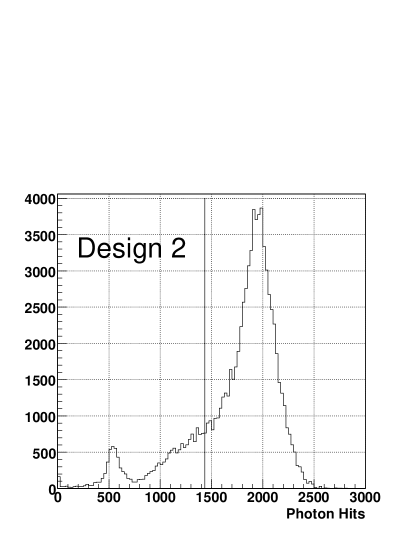
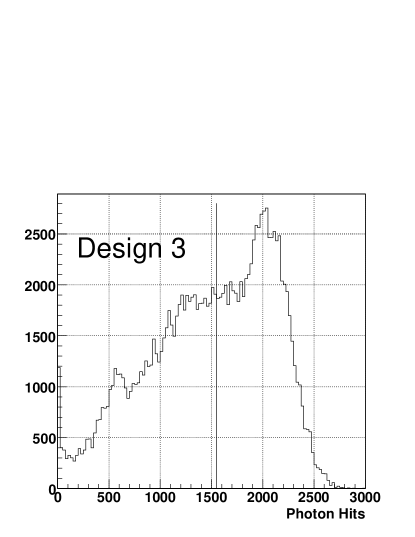
To avoid uncertainties in the quality of calibrations or the variations in the linearity of response for the various detector designs, it was decided that the minimum threshold for n-Gd capture identification would be defined as the number of photon hits located at the point between the fitted peak values of the n-Gd and n-p captures. This value would be roughly equivalent to 6 MeV and provided a very robust and uniform definition to be applied to all four designs. In Fig. 2 the photon hit spectrum for each of the four detector designs is shown with the applicable threshold value superimposed.
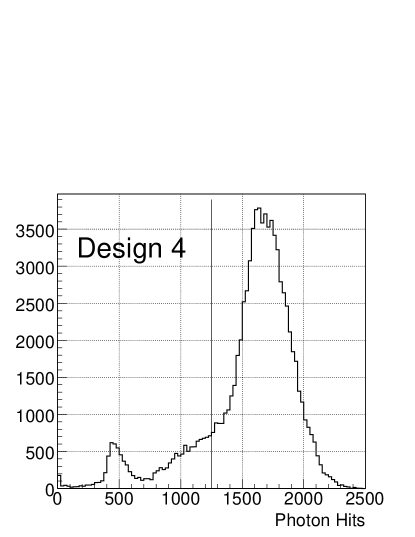
With the application of these thresholds, the overall neutron detection efficiency for each design is shown in Table 1. It was an initial surprise that Design 1 had such a low efficiency. After further investigation, it was understood that the small dimension of the target and gamma-catcher allow many of the photons from the n-Gd capture to penetrate to the inactive mineral oil buffer before depositing their energy. In the other three designs, these photons are being absorbed in the outer wall of the vessel and some of that energy is re-emitted back into the active scintillator volumes. This quite clearly demonstrates that while Design 1 is optimized for larger detectors with fiducial volume of greater than 10 m3, it is not necessarily optimal for a more compact design.
| Detector | Efficiency |
|---|---|
| Design 1 | 51.6% |
| Design 2 | 80.4% |
| Design 3 | 50.2% |
| Design 4 | 83.4% |
Uniformity of Neutron Identification
To better understand the specific characteristics of each design, we investigated the dependence of the neutron capture identification efficiency on position within the target volume. The truth information from the montecarlo simulation was used to identify the vertex position of the neutron capture. The events were binned in the vertical (z-position) and radial distances from the center of the target volume. Using the same threshold described above for the definition of an accepted neutron capture event, the efficiencies, as a function of both z-position and radius, are plotted for all detector designs in Fig. 3.


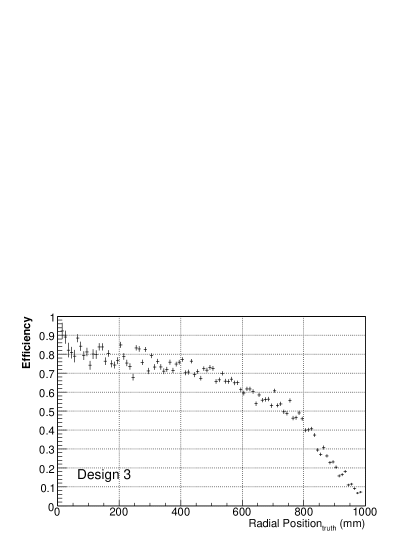


As expected, one can quite clearly see that, despite the low overall efficiency, Design 1 shows the most uniform response. In a similar fashion, Design 3, with the lack of any gamma-catcher, shows significant degradation in the efficiency as it nears the boundaries of the target volume. Perhaps more interesting is to compare the radial performance of Design 2 and Design 3. Their efficiencies are relatively similar out to the nominal radius of just over 600 mm. However, in the additional target volume of Design 3 (radius 650 mm) the efficiency drops off quit radically. Perhaps the most surprising observation is the relatively good performance of Design 4. Its z-position dependence is not as good as Designs 1 or 2, but for most of the range, its efficiency for accepting neutron capture events is significantly higher— 10% higher than Design 2 and 80% higher than Design 1. It is only in the bottom 25–30 cm that the efficiency of Design 4 drops off to values equal to those of Design 2. Radially, Design 4 appears to maintain better uniformity than all other designs with the exception of Design 1, only showing a declining efficiency for the last 10 cm.
Of course, most of the volume of the target cylinder is at the larger radii where the efficiencies are dropping off. In fact, the efficiencies shown in Table 1 are under-weighted at large radii due to the loss of 2–3% of the generated neutrons which have leaked out of the fiducial volume. In a real detector, these events would be compensated by an almost equal number of events, occurring outside of the fiducial volume, for which neutrons would be captured within the target region. To better evaluate the total effective volume of each of these designs, we assumed a uniform distribution of neutron captures and integrated the differential efficiencies over the total volume of each design’s target region with the following results: Design 1 = 0.93 m3; Design 2 = 1.42 m3; Design 3 = 2.15 m3; Design 4 = 1.51 m3. Recall that the nominal target volume was 2 m3 and that Design 3 actually had a volume of 4.72 m3.
IV Positron Energy Response
The positrons from a reactor induced inverse beta-decay event will deposit between 1–6 MeV of energy into the scintillator with a maximum likelihood value of 2.5 MeV. We performed some simple studies of the linearity of the energy response to positrons with kinetic energies between 0–5 MeV and did not see any significant energy dependence. We therefore concentrated on two specific positron samples—one with kinetic energy of 1.5 MeV corresponding to the peak energy deposition and one with kinetic energy of 3.5 MeV which would be in the high energy tail—which we used to study in detail the position dependence of the different detector designs.
Each positron sample was generated uniformly within the target volumes of each detector design. The simulation libraries described above were used to montecarlo the ionization losses and the eventual positron annihilation. The ensuing optical photons from the scintillator were tracked to the photocathodes of the PMTs. Within the simulation, the PMTs used a radially dependent quantum efficiency which is consistent with experimental testing. This yielded a photon hit-count per PMT that is roughly equivalent to a number of photoelectrons. This photon hit-count has been used for all comparisons of detector response—avoiding the complications of varying electronics and data acquisition systems. All PMT hits recorded within 100ns were summed together to create an effective total charge deposition. An example of the total energy deposition from these two samples in Design 1 is shown in Fig. 4.
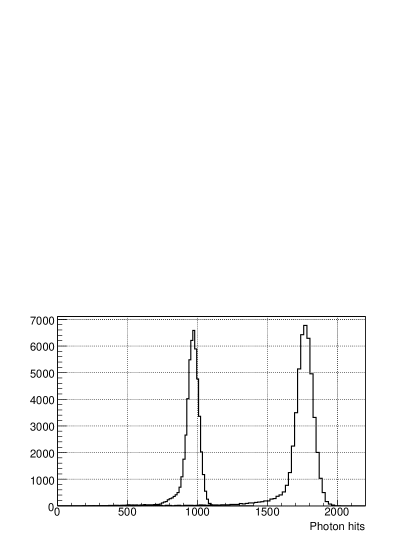
The truth information from the montecarlo simulation was used to identify the vertex position of the positron event. The events were binned in the vertical (z-position) or radial distances from the center of the target volume. The recorded photon hit-counts were fitted to a Gaussian for each bin in either radial distance or z-position. These data, for all detector designs, are shown in Fig. 5 as a percent difference from the mean response of the detector. The errors shown represent the Gaussian sigma of the fit.


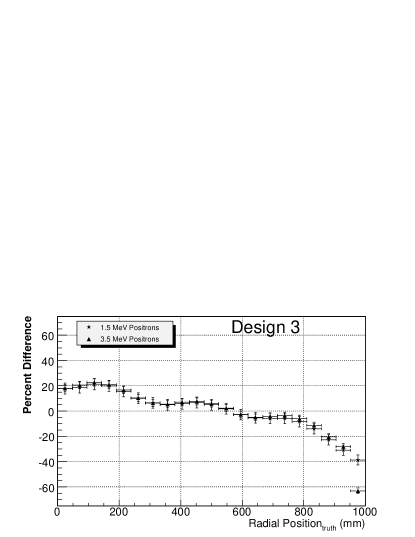
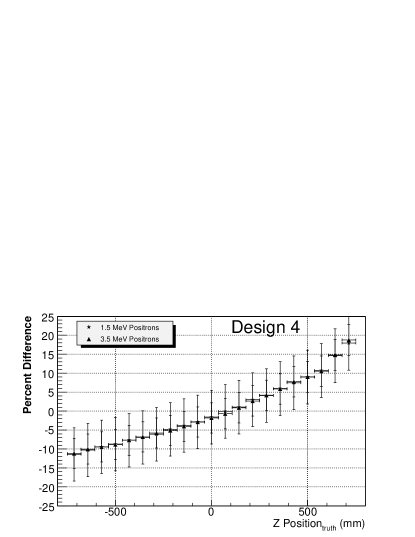
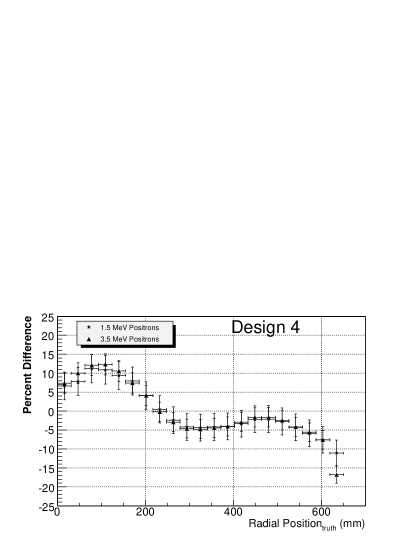
The first thing to notice when looking at these distributions is that the responses to the 1.5 MeV and 3.5 MeV positrons is quite nearly identical. Also, the errors are consistent with the expected energy resolution from the liquid scintillator. As with the neutron capture efficiencies, Design 1 shows the most uniform response of all detector designs. It was a bit surprising to see the large variations in the radial responses for Designs 2–4. After some further investigation, it was understood that this structure is consistent with the ring-like implementation of the PMTs at the top and bottom of the detectors. The additional PMTs on the barrel of Design 1 are clearly serving to reduce these variations. Also, as was expected, the detector designs which incorporate two-sided readouts (Designs 2–3) show more uniform response relative to z-position than is seen in Design 4. However, given that the radial responses of these detector designs show such large variations, it is not clear that the z-position uniformity provides a significant gain. In fact, it appears that Design 4, with a slightly larger surface area of PMTs at the single end, provides a more uniform response with respect to radial position than Design 2— 12% compared to 15%. In addition, this appears well matched to the z-dependent response of Design 4 which is relatively similar.
Simple Energy Calibration
An attempt was made to see if the variations in detector response could be reduced by implementing a simple energy calibration as a function of vertex position. Clearly Design 1, while providing sufficient PMTs to reconstruct a vertex position with good accuracy, provides a good uniformity of response and was therefore not attempted. On the other hand, Design 4 demonstrated that readout from only one side was insufficient to consistently reconstruct a vertex position that would be useful for correcting the energy response.
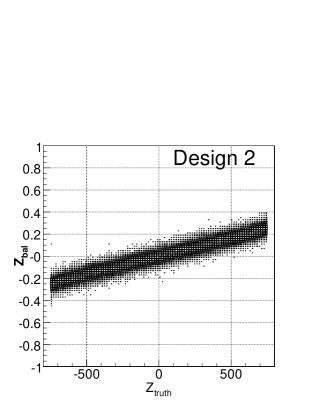
For Designs 2 and 3, we attempted various methods to reconstruct the radial position. However, the reflectivity of the side walls made this unreasonably difficult. We did find, however, that a simple charge balance between the top and bottom PMTs provided a very good correlation to the true z-position. We define the measurable quantity z-balance () in the following way:
| (1) |
where and refer to the total number of photon hits recorded by the PMTs at the top and bottom of the detector, respectively. The correlation of this value to the true z-position for Designs 2 and 3 can be seen in Fig. 6 and the relative positron energy response (similar to Fig. 5) is plotted relative to this variable in Fig. 7.


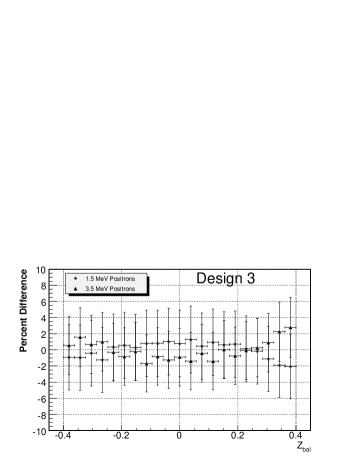
Using the data from Fig. 7, a multiplicative calibration constant for each bin in was constructed to give the mean response. Rather than creating an energy dependent calibration, the relative responses of the 1.5 and 3.5 MeV positron samples were averaged to provide a single calibration constant for each bin. This procedure was repeated for both detector designs and the calibration constants were applied event-by-event.
As expected, after calibration the uniformity of the response for both designs is improved (See Fig. 8). Especially in the region of between -.3 and .3, the relative differences are kept within 1%—consistent with the uncalibrated performance demonstrated in Design 1. One can also note the larger error for Design 3 which arises from the large response variation with radial position.

V Conclusion
This work was an attempt to better understand the design features that would affect the response of a compact liquid scintillator detector to anti-neutrinos from nuclear power reactors. There are some interesting trade-offs that can be identified. For example, Designs 2 and 4 offer an interesting compromise in efficiency and uniformity while Design 1 shows that very good uniformity of response can be achieved at the cost of a larger total detector size and an efficiency for event selection of only 50%. On the other hand, Design 3 demonstrates the maximum effective fiducial volume for the minimum total detector size at the cost of energy distortions as large as 40%. The optimal design will depend on the goals and restrictions of the specific installation.
Clearly improvement can be made to any and all of these designs. It was perhaps interesting to note that the expected uniformity from the two-sided designs was hampered by the large radial variations in energy response. Some more clever design of the PMT distribution might be able to improve this. Similarly, one might consider some judiciously placed additional PMTs in Design 4 to allow for some minimal reconstruction and calibration.
In general, however, it appears that a compact neutrino detector with overall dimensions on the order of 3 m can be built with reasonably good performance. Given that the energy resolution of the scintillator is usually 7–10%, the 15% variation in energy response is not extreme. It is the hope of the authors that this work will prove useful to those working on nuclear reactor monitoring and can provide fruitful directions for future detector development.
References
- (1) A. Bernstein, Y. f. Wang, G. Gratta and T. West, arXiv:nucl-ex/0108001.
- (2) P. Huber and T. Schwetz, arXiv:hep-ph/0407026.
- (3) M. M. Nieto et al., Nucl. Science and Eng. 149, 270 (2005).
- (4) http://neutrino.phys.ksu.edu/~GLG4sim/.
- (5) http://geant4.web.cern.ch/geant4/.
- (6) T. Araki et al. [KamLAND Collaboration], Phys. Rev. Lett. 94, 081801 (2005).
- (7) F. Ardellier et al. [Double Chooz Collaboration], arXiv:hep-ex/0606025.