Study of the ATLAS central calorimeters response to pions in 2004 combined test beam
Abstract
During summer 2004, a testbeam for the ATLAS experiment was performed at CERN. A full slice of the ATLAS detector was tested with the final version of the acquisition electronics. In the talk presented at Calor06 conference, the ATLAS calorimeters response to high and low energy pions was presented.
Keywords:
ATLAS; Testbeam; Calorimetry; Pions:
01.30.Cc; 29.40.Vj1 Description of the 2004 combined test beam of the ATLAS detector
1.1 Central calorimetry in ATLAS
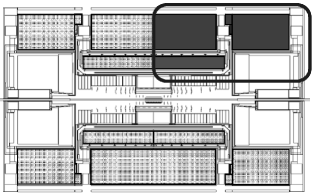
The whole calorimetry in ATLAS is contained within a 12 m long cylinder with an outer radius of about 4.2 m. This volume is divided into 3 part along . The central part called barrel, covers . The electromagnetic calorimeter (LAr calorimeter) uses lead as absorber and the active material is liquid argon. For the hadronic calorimeter (TileCal) the absorber is iron and the active part consists of scintillating tiles. For mechanical reason the central hadronic calorimetry is separated in 3 parts : 1 long barrel for and 2 extended barrels for . Figure 1 shows the calorimetry in ATLAS. The central calorimetry which will be the subject of the present document has a light-grey color. The dark-grey circled region represents the part that have been exposed to the beam during the 2004 combined test-beam.
1.2 Central calorimetry in 2004 combined test beam
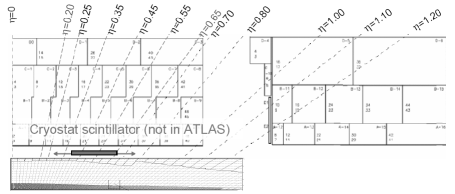
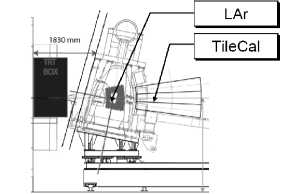
The 2004 combined test-beam is the first test of a full ATLAS slice (inner detector, calorimetry and muon spectrometer). In the following only the calorimeter response will be discussed. A top view of the calorimetry setup is shown on Figure 2. The LAr calorimeter is on the bottom. Half a barrel of TileCal and 1 TileCal extended barrel are also shown. The modules were laying on a rotative Table giving the possibility to shoot the beam at various positions (represented in Figure 2). Comparing with Figure 1 it can be observed that the test-beam geometry is similar to the ATLAS one. Figure 3 shows a side view of the calorimetry on the Table. We can see the LAr calorimeter within its large cryostat, and 3 TileCal modules. The -coverage is 0.4 in LAr and 0.3 in TileCal.
1.3 Data sample and energy reconstruction
During summer 2004, central ATLAS calorimeter modules have been exposed to muons, pions and electron beams with different energies. In the following only the results obtained using the pion beams are reported. The High Energy (HE) pions had the following energies : 50, 100, 150, 180, 200, 250, 320 and 350 GeV. They had an impact angle with respect to the surface of the detector corresponding to the pseudo-rapidity values : =0.20, 0.25, 0.35, 0.45, 0.55, 0.65. The Very Low Energy (VLE) pion beams had energies ranging between 1 and 9 GeV and the same values.
In LAr calorimeter the energy scale is obtained using the features of a discharging capacitor. For TileCal, the energy scale is determined using the response of the detector to electron beams. In the present analysis the energy that is deposited by pions in calorimeters is reconstructed summing the energy of cells in a limited window around the direction of the beam. It has been checked that the pion showers are well contained in volume in LAr and volume in LAr.
2 Pions that do not interact in the electromagnetic calorimeter
Around 20% of the high energy pions reach the hadronic calorimeter without producing a shower in the electromagnetic section. These pions constitute an interesting probe to check the performances of TileCal standalone and to establish the absolute energy scale in TileCal. In this section the response (ratio between the reconstructed and the beam energy) and the resolution of TileCal will be reported for high energy pions.
2.1 Event selection
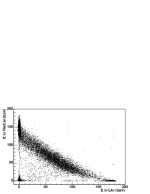
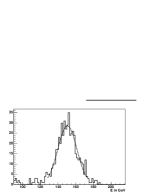
Figure 4 shows the correlation between the deposited energy in the electromagnetic and hadronic calorimeters for a 180 GeV beam. It can be seen on this plot that the high energy pion beam contains a significant fraction of muons and electrons. Muons give a very small energy in both calorimeters while electrons deposit all their energy in LAr. Muons and electrons can be easily rejected looking at the longitudinal profile of the energy in calorimeters. Pions showering in both calorimeters are visible in the center of Figure 4 (anti-correlation between LAr and TileCal). Pions interacting only in TileCal can be selected requesting a signal compatible with the one of a minimum ionizing particle (mip) in each of the 4 longitudinal compartments of the LAr. This is not enough to select pions reaching TileCal without early interaction. Indeed pions passing through the LAr at their minimum of ionization can interact in the outer cryostat wall. In order to reject such events an additional scintillator (called cryostat scintillator) has been placed between the outer cryostat wall and the front face of TileCal (see Figure 2). A mip-like signal is then requested also in the cryostat scintillator. Figure 5 shows the energy distribution in TileCal for 180 GeV pions that pass the cuts described above (ie mip-like signal in each LAr layer and in the cryostat scintillator). A Gaussian fit has been applied in order to estimate the mean reconstructed energy and the width of the distribution. The fit was performed in a region of 2 sigmas around the peak value.
2.2 Response and resolution
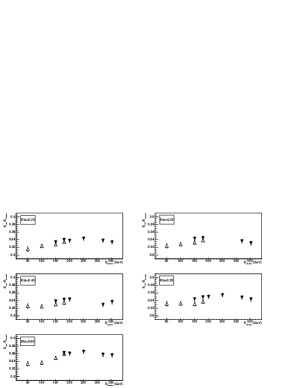
Figure 6 shows the ratio between and the beam energy for different positions. Two different beams have been used during the data taking. One has a negative polarity and is expected to contain only negative pions while the other one is a positive beam for which a proton contamination is expected. It is a well known fact that protons produce a lower response than pions in a non-compensating calorimeter like TileCal TileCal-2001-005 . For this reason and because it was not possible to separate pions and protons in 2004 combined test-beam, the response for positive and negative beams have been represented separately in Figure 6. It can be noticed that, as expected, the response for the positive beam, (150 and 180 GeV) is systematically lower than the negative beam one at the same energy. The effect is around 1%. Looking at Figure 6 it can be noticed that the calorimeter response is increasing with the beam energy. This behavior is typical of a non-compensating calorimeter. At high energy (320 and 350 GeV), due to the transversal and longitudinal leakage, the response decreases slightly. So far two sources of systematic effect have been considered. The beam incident energy is known with a 0.5% precision. The influence of the selection cuts has been estimated to be of the order of 0.2%. This gives a global systematic uncertainty of around 0.5%. The statistical error on the reconstructed energy is around 1%. It means that the statistical error dominates the estimation of the TileCal response to pions.
The evolution of the resolution defined as as a function of it shown in Figure 7. This study has been done using the negative beam (no protons) except at 50 and 100 GeV. A fit function has been applied in order to estimate the sampling term and the constant term :
The obtained parameters are given in Table 1. It has to be stressed that these results have been obtained without any correction for leakage or non-compensation. For this reason the resolution is not the best that can be achieved. The results of Table 1 are in good agreement with results obtained in the same conditions during previous TileCal standalone test-beams TILECAL-99-020 .
| Sampling term () | Constant term (%) | |
|---|---|---|
| 0.510.03 | 5.90.2 | |
| 0.520.02 | 5.70.3 | |
| 0.480.02 | 5.80.2 | |
| 0.440.03 | 5.50.2 | |
| 0.490.03 | 5.10.1 |

3 Combined calorimetry response to pions
3.1 Energy reconstruction
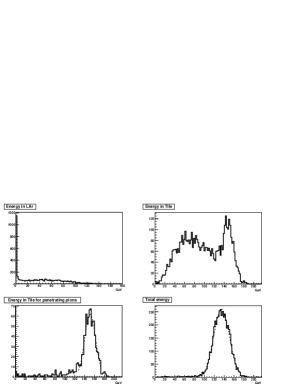
The study of combined calorimetry response to pions is done only using beams with a negative polarity in order to get rid of any proton contamination. The energy in calorimeters is computed as the sum of energy in LAr and energy in TileCal. No correction for non-compensation, dead material or leakage has been applied. The aim of this analysis is to provide the combined response that can be used to fix the absolute hadronic scale and that can be reproduced by the simulation. Figure 8 shows the energy distribution in LAr, TileCal, and the sum of the energies in the two calorimeters for 180 GeV pions at . The reconstructed energy for pions that start showering in TileCal (called penetrating pions) is also shown (bottom left). As before a Gaussian fit is applied on the total energy distribution and the mean reconstructed energy is obtained from the fit.
3.2 Combined response
Figure 9 shows the ratio between the mean reconstructed pion energy and the beam energy for different positions. Again the response is showing the typical behavior of a non-comensating calorimeter : the response increases as the beam energy increases (due to the increase of the fraction of in the showers). The error on the pion response is around 0.5%. It comes from the uncertainty on the beam energy.

4 Calorimeters response to very low energy pions
4.1 Motivations
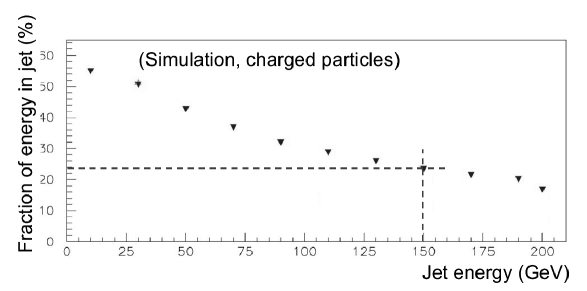
In addition to the high energy program, very low energy data have been taken during the 2004 combined testbeam. From the calorimetry point of view this is motivated by the fact that very low energy particles (namely E¡10 GeV) have an important contribution in jets. Figure 10 shows a simulation of the fraction of energy brought by charged particles with E¡10 GeV as a function of the jet energy. One observes that about 25% of the energy in a 150 GeV jet is brought by particles with less than 10 GeV. Therefore we need a good knowledge of the calorimeters response to very low energy particles in order to check and tune the simulation of jets.
4.2 Selection of the very low energy pions
Very low energy (VLE) data have been taken at 0.2, 0.25, 0.35, 0.45, 0.55, 0.65 for energies between 1 and 9 GeV. The VLE beam is a mixture of low energy pions, electrons and muons from pion decay. Due to the configuration of the beam line, a large contamination by high energy muons is also expected.
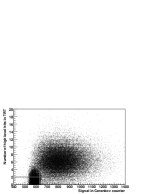
The different particle separation has been performed using a Cerenkov counter111Not an ATLAS detector. and the Transition Radiation Tracker222TRT is an ATLAS detector. (TRT) that was in the beam line during the 2004 combined test-beam. Both TRT and Cerenkov counter were used to separate pions from electrons. The scatter plot in Figure 11 shows on the x-axis the signal (in adc channel) in the Cerenkov counter and on the y-axis the number of hits in TRT. In TRT, pions are expected to produced less transition radiation X-ray than electrons. In the Cerenkov counter a lower signal is expected for pions than for electrons. Electrons and pions (together with muons) can be clearly identified on Figure 11. The following cuts have been applied to select pions : and number of hits (grey lines on Figure 11).
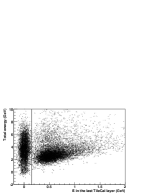
Once electrons have been rejected we still have to deal with the contamination of high energy muons. High energy muons give a higher signal than very low energy pions in the last TileCal layer. Indeed VLE pions are expected to lose most of their energy before reaching the end of TileCal. High energy muons can be rejected asking less than a given energy in the last TileCal layer. Above 5 GeV this cut can introduce a bias because some pions can reach this layer. Nevertheless such a cut is easy to reproduce in the simulation. Figure 12 shows the distribution of the total energy as a function of the energy in the last TileCal layer. A large cloud with a total energy around 2 GeV is observed. This is the expected signal for high energy muons. The following cut has been chosen to select pions : E in the last TileCal layer ¡ 150 MeV (grey line in Figure 12). Once pions have been separated from electrons and muons, the energy is determined fitting the total energy distribution with a Gaussian function. corresponds to the mean of the function. Again no corrections have been applied to take into account the dead material effects.
4.3 Calorimeters response to VLE pions
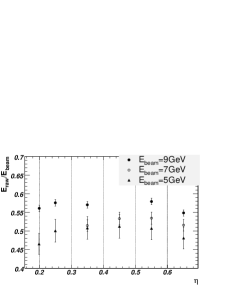
Very low energy pions have been selected as described above for various energies and positions. Figure 13 gives the dependence of the response () as a function of . Due to the low number of pions available, the uncertainty on the response is dominated by the statistical error on the mean reconstructed energy. This statistical error varies from 1% at 9 GeV to 4% at 5 GeV. The error on the knowledge of the beam energy is 0.3%. Systematic effects of the selection cuts have to be studied.
5 Conclusions and outlooks
In this note results concerning the response of ATLAS central calorimeter to pions have been presented. Data collected during a CERN testbeam were used. The results were obtained studying :
-
•
all high energy pions (energy larger than 50 GeV)
-
•
high energy pions that start showering in TileCal
-
•
very low energy pions (energy lower than 9 GeV)
The study of pions which start to produce a shower in TileCal has been performed in order to determine the hadronic absolute scale for TileCal and to compare TileCal performances in 2004 with the results obtained during previous standalone TileCal test-beams. From this analysis one can conclude that the resolution obtained in 2004 is compatible with the values obtained during previous test-beams. The uncertainty on TileCal response to pions is around 1% (dominated by the statistical error).
For the combined LAr+TileCal response to high energy pions, the uncertainty is less than 1%. It is dominated by the error on the beam energy.
For very low energy pions, the error on the LAr+TileCal response ranges from 1% at 9 GeV to 4% at 5 GeV. Work is still in progress for the determination of the systematic error introduced by the selection cuts (pion/electron separation, pion/muon separation, beam profile…).
At the end of the talk possible jet calibration strategy in ATLAS were discussed. The response of the ATLAS calorimeters has been obtained (in the 2004 testbeam configuration). The next step, which is already in progress, is to compare these results to the simulation in the same conditions (simulation of the test beam geometry). If needed the simulation will be tuned according to the testbeam results (amount of dead material, shower development…). Once a good agreement will be achieved, correction for dead material, leakage, will be derived from simulation. Algorithms could be proposed in order to improve the calorimeters performances for single pions (like weighting techniques to improve linearity and resolution). The final objective is to obtain the jet absolute energy scale with a good linearity and resolution.
References
- (1) S. Constantinescu, S. Dita, A. Henriques, M. Nessi, R Stanek, Comparative analysis of the ATLAS tile hadronic calorimeter response to pions and protons, TILECAL-2001-005, CERN, (2001)
- (2) V. Castillo, S. González, Analysis of the 1998 test of the TileCal barrel prototype, TILECAL-99-020, CERN, (1999)