Prisoner’s Dilemma on community networks
Abstract
We introduce a community network model which exhibits scale-free property and study the evolutionary Prisoner’s Dilemma game (PDG) on this network model. It is found that the frequency of cooperators decreases with the increment of the average degree from the simulation results. And reducing inter-community links can promote cooperation when we keep the total links (including inner-community and inter-community links) unchanged. It is also shown that the heterogeneity of networks does not always enhance cooperation and the pattern of links among all the vertices under a given degree-distribution plays a crucial role in the dominance of cooperation in the network model.
keywords:
Community networks, Prisoner’s Dilemma, Cooperation, HeterogeneityPACS:
89.75.Hc, 02.50.Le, 87.23.Ge, ,
1 Introduction
Cooperation is an essential ingredient of evolution. Understanding the emergence and persistence of cooperation among selfish players in evolution is one of the fundamental and central problems. As one typical game, the Prisoner’s Dilemma game (PDG), has become a world-wide known paradigm for studying the emergence of cooperative behavior between unrelated individuals. In the original PDG, two players simultaneously decide whether to cooperate or defect. The defector will always have the highest reward (temptation to defect) when playing against the cooperator which will receive the lowest payoff (sucker value). If both cooperate they will receive a payoff (reward for cooperation), and if both defect they will receive a payoff (punishment). Moreover, these four payoffs satisfy the following inequalities: and . It is not difficult to recognize that it is best to defect for rational players to get the highest payoff independently in a single round of the PDG, but mutual cooperation results in a higher income for both of them. Therefore, this situation creates the so-called dilemma for selfish players.
To find under what conditions the cooperation emerges on the PDG, various mechanisms of enforcing cooperation have been explored [1]. Departure from the well-mixed population scenario, Nowak and May introduced a spatial evolutionary PDG model in which players located on a lattice play with their neighbors [2]. In each round, players adopt the strategy of their most successful neighbors’ in term of their payoff. It has been shown that the spatial effect promotes substantially the emergence of cooperation.
In the past few years, the evolutionary PDG has been studied on different network models such as small-world structure [3], regular and random graphs by using other mechanisms to enhance cooperation [4, 5, 6, 7, 8]. In all these models, each player occupies one vertex of the networks. The edges denote links between players in terms of game dynamical interaction. Each player just interacts with its adjacent players. Santos et al. have studied the PDG and snowdrift game (SG) on scale-free networks [9] and found that cooperation dominates in both the PDG and the SG, for all values of the relevant parameters of both games [10]. Their results show that the heterogeneity of networks favors the emergence of cooperation. In addition, Much attention has been given to the interplay between evolutionary cooperative behavior and the underlying structure [11, 12].
In this paper, we focus on the PDG on community networks which can reflect a lot of real-world complex networks such as social and biological networks. The community network model and update rule for the PDG are introduced in Sec. 2. Simulation results are shown for some parameters and their corresponding explanations are provided in Sec. 3. At last, conclusions are made in Sec. 4.
2 The Model
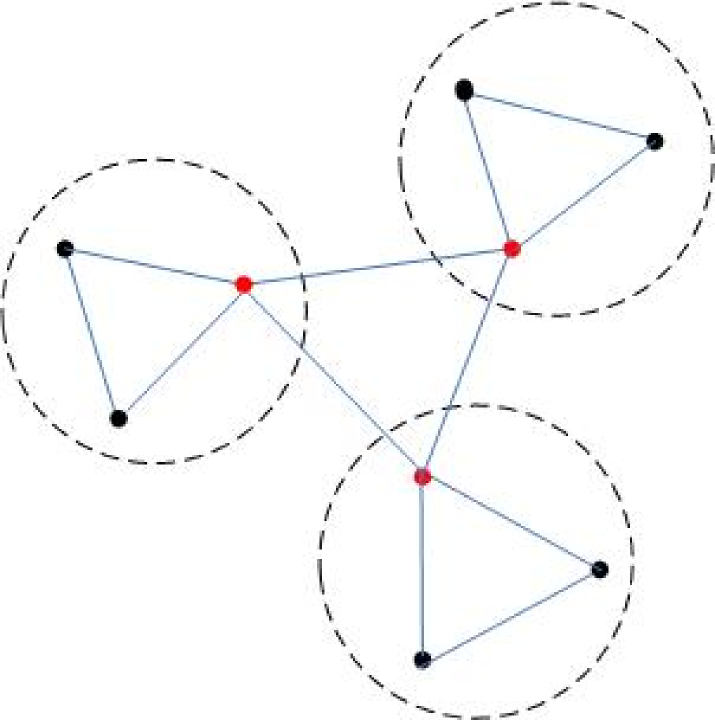
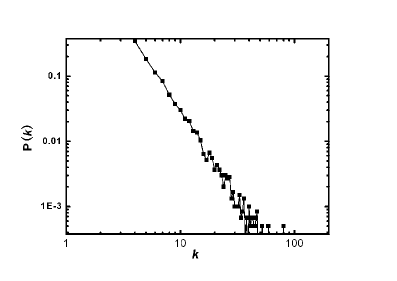
We first construct the evolving network model which exhibits community structure and scale-free properties [13]. We assume that there is a total of () communities in the network model. The evolving model is defined by the following steps: (1) Starting from () fully connected vertices in each community; and at the same time, there is a inter-community link between every two different communities. The vertex to which the inter-community links connect are selected fixedly in each community (the red points in Fig. 1). (2) A new vertex is added to a randomly selected community at each time step. The new vertex will be connected to () existing vertices in the same community through inner-community links, and to () existing vertices in other communities through inter-community links (growth). (3) When choosing the vertices to which the new vertex connects in the same communities through inner-community links, one assumes that the probability that a new vertex will be connected to node in community depends on the degree of that vertex: ; When choosing the vertices to which the new vertex connects in the other communities through inter-community links, one assumes that the probability that a new vertex will be connected to node in the community () also depends on the degree of that vertex: (preferential attachment). After time steps this algorithm produces a grape with vertices and edges, in which older vertices in each community in the generation process are those which tend to exhibit larger values of the connectivity. And the average degree of the networks model is about . For example, Fig. 1 shows an initial network with and . The degree-distribution of the network model is shown in Fig. 2, and we observe that the degree distribution obeys a power-law form.
The model is generated via growth and preferential attachment, then we set up a system of players arranged at the vertices of this network model. Each player who is a pure strategist can only follow two simple strategies: C (cooperate) and D (defect). In one generation, each player plays a PDG with its neighbors. Let’s represent the players’ strategies with two-component vector, taking the value for C-strategist and for D-strategist. The total payoff of a certain player is the sum over all interactions, so the payoff can be written as
| (1) |
where is the set of neighbors of element and is the payoff matrix.
| (2) |
Introduced by Nowak and May [2, 14], the payoff matrix can be written as a simplified version
| (3) |
where represents the advantage of defectors over cooperators and . Therefore, we can rescale the game depending on the single parameter .
After this, the player will inspect the payoff collected by its neighbors in the generation, and then update its strategy for the next generation to play by the following rule [10]. It will select one player randomly from its neighbors. Whenever , player will adopt the strategy of player with probability given by:
| (4) |
where and . And and are the connectivity numbers of player and , respectively. We use a synchronous update, where all the players decide their strategies at the same time. All pairs of players and who are directly connected on the network model engage in each generation of the PDG by using the update rule of Eq. (4).
3 Simulations and Discussion
In the following, we show the results of simulations carried out for a population of players occupying the vertices of the networks with same size of communities. The initial strategies (cooperators or defectors) are randomly distributed with equal probability. Then more than generations are played to allow for equilibrium frequency of cooperators and defectors which are achieved by averaging over the last 1000 generations. The simulation results of the frequency of cooperators as a function of for the PDG has been shown. Moreover, each data point averages over 40 realizations of both the networks and the initial conditions.
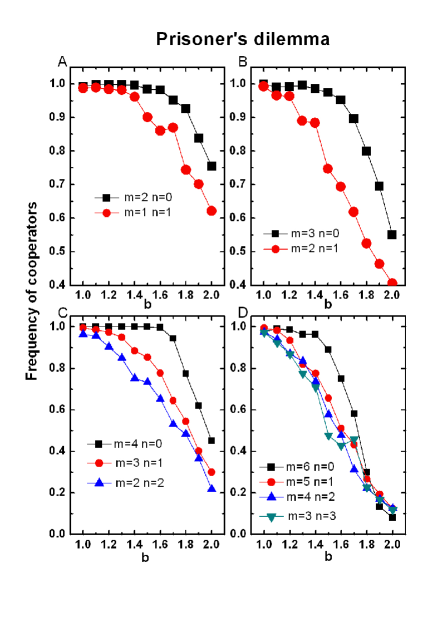
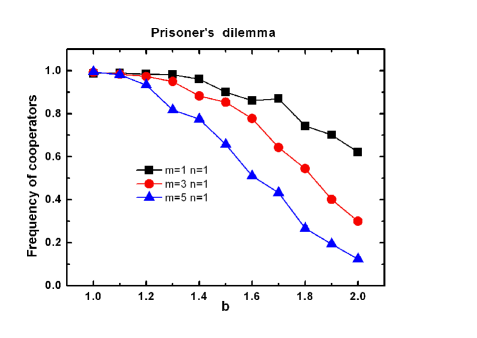
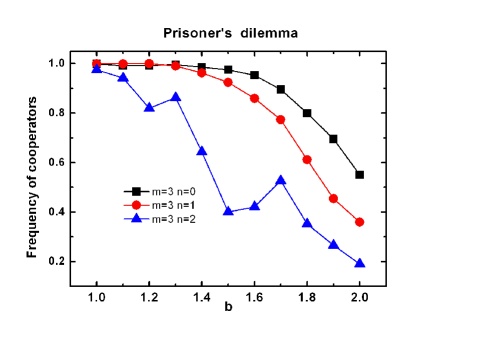
In Fig. 3, we show the results for the PDG on the network model for different values of the average degree . It shows that the higher the value of the average degree , the more unfavorable cooperation becomes, especially for a large value of the parameter . From Fig. 3A to Fig. 3D, we have found that the larger the value of the parameter is, the more favorable cooperation becomes over the large range of when the average degree is unchanged. Moreover, for small , cooperation dominates in the PDG when the value of the parameter is small; however, the frequency of cooperators decreases rapidly over the entire range of the parameter when the value of the parameter is high. Fig. 4 shows the frequency of cooperators as a function of with different when we keep . The frequency of cooperators decreases when the value of the parameter increases for a given fixed . Fig. 5 shows the frequency of cooperators as a function of with different when we keep . The frequency of cooperation decreases when the value of the parameter increases for a given fixed .
From the simualtion results, we have found that the smaller the value of the parameter , the more favorable cooperation becomes; besides, the smaller the value of the parameter , the more unfavorable cooperation becomes for a given fixed . These results can be explained in the following ways. The average degree of the network models can affect the frequency of cooperators [10, 15]. On this community network model, the small value of is benefit to cooperation. On the one hand, the heterogeneity of the network structure can promote cooperation; the direct inter-connections of hubs play an significant role in enhancing cooperation [10, 16, 17, 18]. On this network model, the initial-fixed vertices connected to between each community are expected to be the largest hubs in each community. We have found that these fixed vertices are always hubs with largest degree in each community for small by data analysis. However, if we increase the value of or , the expected hubs may not have the largest connectivity any more, though the degree distribution still obeys a power-law form. More and more older vertices would compete to be the hubs for high , and then the number of direct links among hubs would decreases. It is because if there are no direct links connecting to any two vertices belonging to different communities initially, they would become unconnected forever. Therefore, large or leads to the case that the number of direct links among hubs decreases. This would inhibit cooperation since the number of direct links among larger hubs from different communities decreases. On the other hand, higher connectivity should reduce cooperation; in particular, more cooperation should emerge if connectivity is low [15]. Our simulation results confirm this conclusion. When we increase the value of or , players will have more neighbors, but having more neighbors for players does not pay at all. Beacuse it would lead the community network to the high connectivity, and then the cooperative behaviour becomes inhibited.
It is well-known that scale-free networks promote cooperation [10]. And scale-free networks have most of their connectivity clustered in a few vertices, like the amplifier structures, such as loops and circulations which are potent for cooperation [19]. While for a given fixed , the best one for promoting cooperation is to keep . In this situation, it apparently becomes to be similar to three hubs which are connected to each other. And all the newly growing vertices only connect to other vertices belonging to the same community. Each community is a standard BA scale-free network, so the whole network consists of amplifier structures to promote cooperation. As the ratio m/n decreases, the inner-community links number decreases and the inter-community links number increases. Due to the community structure, in general, the vertices in different communities may not have direct links connecting to each other, then these vertices from different communities do not form loops through inter-community links. As a result, the number of loops on the community network decreases and the whole network does not favor cooperation. Therefore, when the ratio decreases for a fixed , the cooperation becomes unfavorable.
Therefore, it is not surprising that the small number of links on this community networks can promote cooperation by considering these factors. Community sturcture is an ubiquitous phenomena in all kinds of complex networks, especially in human society. From our results, taking account into the effect of community structure, some certain community structures promote cooperation greatly; besides, different patterns of links among all the vertices under a given degree-distribution can affect cooperation, especially connections between hubs can enhance cooperation greatly. Moreover, we have confirmed that all the simulation results are valid for different population size and community size .
4 Conclusions
To sum up, we have studied the cooperative behavior of the evolutionary PDG on the community networks and found that reducing inner-community and inter-community links can promote cooperation. The heterogeneity of networks is not always positive to enhance cooperative behavior and the situation of connections among all the vertices, especially some certain structures and direct connections between hubs plays a more significant role in the dominance of cooperation. Graph topology plays a determinant role in the evolution of cooperation [20]. However, it is necessary to explore more direct and essential factors that facilitate cooperation to dominate for future work.
Acknowledgements
This work was supported by National Natural Science Foundation of China (NSFC) under grant No. 60674050 and No. 60528007, National 973 Program (Grant No. 2002CB312200), and 11-5 project (Grant No. A2120061303).
References
- [1] M. Doebeli and C. Hauert, Ecology Letters 8, 748 (2005).
- [2] M. A. Nowak and R. M. May, Nature (London) 359, 826 (1992).
- [3] D. J. Watts and S. H. Strogatz, Nature (London) 393, 442 (1998).
- [4] F. C. Santos, J. F. Rodeigues, and J. M. Pacheco, Phys. Rev. E 72, 056128 (2005).
- [5] J. Vukov, G. Szabȯ, and A. Szolnoki, Phys. Rev. E 73, 067103 (2006).
- [6] O. Durán and R. Mulet, Phys. D 208, 257 (2005).
- [7] M. Tomochi, Social Networks 26, 309 (2004).
- [8] G. Szabó and C. Töke, Phys. Rev. E 58, 69 (1998).
- [9] A. L. Barabási and R. Albert, Science 286, 509 (1999).
- [10] F. C. Santos and J. M. Pacheco, Phys. Rev. Lett 95, 098104 (2005).
- [11] M. G. Zimmermann, V. M. Eguiluz, and M. S. Miguel, Phys. Rev. E 69, 065102 (2004).
- [12] M. G. Zimmermann and V. M. Eguiluz, Phys. Rev. E 72, 056118 (2005).
- [13] C. G. Li and P. K. Maini, J. Phys. A: Math. Gen. 38, 9741 (2005).
- [14] M. A. Nowak, S. Bonhoeffer and R. M. May, Int. J. Bifurcation Chaos 3, 35 (1993).
- [15] H. Ohtsuki, C. Hauert, E. Lieberman, and M. A. Nowak, Nature (London) 441, 502 (2006).
- [16] G. Szabó and G. Fáth, arXiv: physcis/0607344, 2006.
- [17] F. C. Santos and J. M. Pacheco, J. Evol. Biol. 19(3), 726 (2006).
- [18] J. M. Pacheco and F. C. Santos, AIP Conference Proceedings 716, 90 (2005).
- [19] E. Lieberman, C. Hauert, and M. A. Nowak, Nature (London) 433, 312 (2005).
- [20] F. C. Santos, J. F. Rodrigues, and J. M. Pacheco, Proc. R. Soc. B 273, 51 (2006).