Detection of radio frequency magnetic fields using nonlinear magneto-optical rotation
Abstract
We describe a room-temperature alkali-metal atomic magnetometer for detection of small, high frequency magnetic fields. The magnetometer operates by detecting optical rotation due to the precession of an aligned ground state in the presence of a small oscillating magnetic field. The resonance frequency of the magnetometer can be adjusted to any desired value by tuning the bias magnetic field. We demonstrate a sensitivity of in a 3.5 cm diameter, paraffin coated cell. Based on detection at the photon shot-noise limit, we project a sensitivity of .
pacs:
PACS. 07.55.Ge, 32.80.Bx, 42.65.-kI Introduction
Detection of small oscillating magnetic fields is the cornerstone of experimental techniques such as nuclear magnetic resonance (NMR), magnetic resonance imaging (MRI), nuclear quadrupole resonance (NQR) Garroway01 and has been used in tests of physics beyond the standard model Bradley03 . Most atomic magnetometers (for example, see Refs. Kom03 ; Budker2000PRA ; Acosta06 ; AlexandrovMag ) are designed to detect slowly varying magnetic fields and hence are not ideally suited for the aforementioned applications. In recent work, Savukov et al Savukov05 demonstrated a tunable, radio-frequency (RF) alkali vapor magnetometer, achieving a sensitivity of , with the sensor operating at C.
Here we present an RF atomic magnetometer based on nonlinear magneto-optical rotation (NMOR) arising due to the response of an aligned atomic ground state to a small RF magnetic field near the Zeeman resonance frequency. The Zeeman resonance frequency can be tuned to any desired value by adjusting the bias magnetic field, yielding sensitivity to signals of arbitrary frequency. The measurement involves a single low-power light beam (), and based on photon shot-noise limited polarimetry, achieves a sensitivity of about . The magnetometer has a bandwidth of about 50-100 Hz depending on light power. Based on experimentally observed signal-to-noise ratio, we demonstrate a sensitivity of . Despite somewhat lower sensitivity than reported in Ref. Savukov05 , for many applications, the magnetometer described here has the significant advantage that the sensor operates much closer to room temperature (the highest temperature used in this work was C). Additionally, using an aligned state rather than an oriented state produces smaller external magnetic fields which can potentially have a back reaction on the sample of interest. Furthermore, the low power requirements and single beam arrangement facilitate the use of microfabrication techniques, promising for the development of compact portable atomic magnetometers Schwindt04 .
Such a magnetometer may find application in NQR as suggested in Ref. Savukov05 where the signal occurs at a fixed resonance frequency or in NMR spectroscopy where high spectral resolution is required to observe small splittings of NMR lines, due to, for example, scalar spin-spin coupling between nuclei of the form . Such couplings can yield valuable information on molecular structure McDermott2002 ; Appelt2006 and can be difficult to access in high field environments where the absolute field homogeneity and differences in diamagnetic susceptibility limit the spectral resolution. Hence, recent attention has been given to performing such measurements in a low field environment using broadband, low transition-temperature superconducting quantum interference devices (SQUIDs) McDermott2002 or inductive detection Appelt2006 . As inductive detection becomes less efficient at low frequencies, the technique described in this letter offers the possibility of significant gains in signal-to-noise ratio without requiring cryogenics.
II Radio frequency NMOR resonance
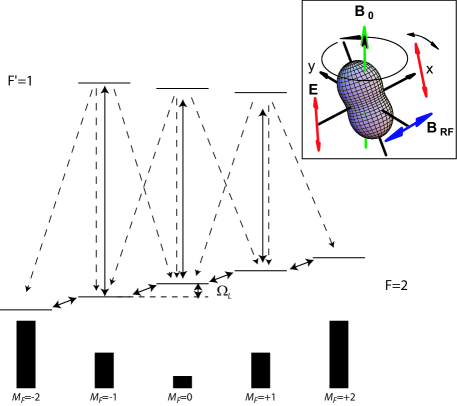
An alkali-metal vapor contained in a glass cell with anti-relaxation coated walls is placed in a directed bias field , corresponding to Larmor frequency where is the Bohr magneton and is the Landé factor. Linearly polarized light propagating in the direction with polarization in the direction, tuned to the D1 () transition, passes through the cell, optically pumping an aligned state, as illustrated in Fig. 1. We apply a small oscillating magnetic field transverse to the bias field, and we work in the regime where so that the RF magnetic field induces only ground state transitions with .
We begin by assuming the light power is weak enough so that the saturation parameter relating the optical excitation rate to the ground state relaxation rate NMOEreview
| (1) |
is small compared to unity. In Eq. (1), is the electric dipole matrix element of the optical transition, is the light electric field, is the Doppler broadened width of the optical transition, is the ground state relaxation rate, is the volume of the cell and is the volume contained within the intersection of beam and cell. When only the rank 2 (quadrupole) polarization moment is pumped by linearly polarized light.
The oscillating RF magnetic field can be resolved into components co- and counter-rotating (parallel or antiparallel to the direction of Larmor precession respectively), each of magnitude . Transforming to the co-rotating frame the counter-rotating component rapidly averages to zero and the magnetic field is
| (2) |
In steady state, an equilibrium is reached between optical pumping of alignment along the axis, precession around and relaxation, resulting in an aligned state tilted away from the axis, as shown inset in Fig. 1. When , the component in Eq. (2) vanishes resulting in the maximum angle between the aligned state and the axis. When we transform back into the lab frame, the tilted alignment precesses about the axis. The tilted alignment generates optical rotation through linear dichroism (see, for example, Ref. Kanorsky93 ), maximal when the alignment is in the plane and none when it is in the plane, resulting in polarization rotation of the light beam that is modulated at . The amplitude of the polarization rotation is linear in in the range considered here, as we have verified experimentally.
The description becomes slightly more complicated for conditions of high light power and light frequency detuned from optical resonance. Under these conditions, AC Stark shifts can lead to differential shifts of the ground state energy levels. In conjunction with precession in the RF magnetic field, this results in alignment-to-orientation conversion (AOC) (see Ref. Budker2000PRL and references therein) in the rotating frame and a splitting of the RF NMOR resonance as discussed briefly below. Doppler broadening can also lead to AOC effects, even for resonant light Budker2000PRL . An additional high light power effect is the generation of hexadecapole (rank 4) polarization moments Yashchuk2003 . We find experimentally that optimal sensitivity is achieved when the saturation parameter is close to unity, and density matrix calculations indicate that the hexadecapole contribution to the ground state polarization is small compared to that of the quadrupole contribution for these conditions.
III Experimental setup
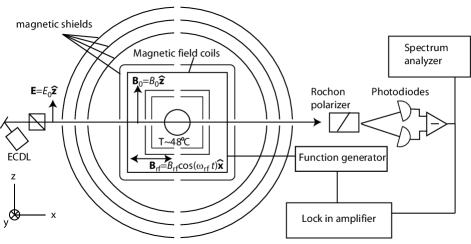
A schematic of the experimental setup is shown in Fig. 2. The measurements reported in this work were performed with an evacuated, paraffin-coated spherical cell ( diameter) containing isotopically enriched 87Rb (nuclear spin ). The paraffin coating enables atomic ground-state polarization to survive tens of thousand wall collisions Rob58 ; Bou66 , leading to ground-state polarization lifetimes in a 10 cm diameter cell Bud98 . The cell is placed inside a double-wall oven, temperature-controlled by flowing warm air through the space between the walls of the oven so that the optical path is unperturbed. A set of four nested -metal layers provides a magnetically shielded environment, with a shielding factor of approximately shieldref . Inside the innermost shield (cubic in profile) is a set of coils for the control of all three components of the magnetic field. Image currents in the magnetic shields create an “infinitely” long solenoid. The atoms traverse the cell many times during the course of one relaxation period, effectively averaging the magnetic field over the cell, leaving our measurements insensitive to field gradients Pustelnygrad . We apply a static magnetic field in the direction and a small oscillating magnetic field in the direction (unless stated otherwise, and ). A well collimated beam with diameter from an external-cavity diode laser, propagates in the direction with polarization vector in the direction. Unless stated otherwise, these measurements were performed with the light tuned to the center of the transition (henceforth referred to as optical resonance). The polarization of the light leaving the cell is monitored using a balanced polarimeter and detected synchronously using a lock-in amplifier. Number density was determined by monitoring the transmission of a low-power beam through the cell as a function of laser frequency. For the measurements reported here, the cell temperature was C and the measured number density was (within 20% of that expected from the saturated vapor pressure at this temperature), corresponding to approximately 1 absorption length for resonant light.
IV Experimental results and discussion
In Fig. 3a we plot the in-phase component of the synchronously detected optical rotation as a function of light frequency for . For these data, the light power was . In Fig. 3b we plot the partially saturated transmission curve under the same experimental conditions. The background slope of the transmission curve is due to varying laser intensity as the diode laser feedback grating is swept. The largest optical rotation occurs for light tuned near the center of the transition, similar to observations of non-linear Faraday rotation induced by a static magnetic field Bud02 . At the light powers for which we obtained optimal sensitivity on the component, optical rotation on the component was at least an order of magnitude smaller than that produced by the component.


In the main panel of Fig. 4 we show the synchronously detected in-phase (stars) and quadrature (squares) components of optical rotation for light tuned to optical resonance and incident light power of . Overlaying the in-phase (quadrature) component is a fit to a single absorptive (dispersive) Lorentzian. As mentioned previously, under conditions of high light power and detuning far from optical resonance, differential AC Stark shifts can lead to a modification of the quantum beat frequency for different transitions resulting in a splitting of the resonance, as shown inset in Fig. 4. The overall shift of the resonance compared to that shown in the main panel is because the bias magnetic field differed by a factor of 5. AC Stark shifts were discussed in some detail in Ref. Acosta06 in the context of NMOR with frequency modulated light. It was found that magnetometric sensitivity was reduced when the resonance was split and hence we do not focus on this behavior any further. However, we point out that AC Stark shifts may provide some degree of optical tunability of the Zeeman resonance and we will explore this possibility in future work.
In Fig. 5a we plot , the half-width at half-maximum, of the in-phase component of the RF NMOR resonance, as a function of light power (the distance from the center of the resonance to the extrema of the quadrature signal is also given by ). Overlaying the data is a linear fit with zero-power width . The intrinsic polarization relaxation rate is related to via nmor_RF_width_comp . Ground state relaxation in paraffin coated cells is typically dominated by electron randomization during collisions with the cell walls and through alkali-alkali spin exchange collisions (see for example Budker2005 ; Graf05 and references therein). The relaxation rate for the latter process is given by spinexref
| (3) |
Here is the spin-exchange cross section, and is the average relative speed of the atoms, is the reduced mass. The factor of in Eq. (3) represents the approximate nuclear “slowing down” factor appropriate for a spin 3/2 nucleus. For a density , Eq. (3) gives , roughly a factor of 2 smaller than the experimentally measured relaxation rate. We attribute the excess relaxation to collisions with the walls.
In Fig. 5b we plot the amplitude of the RF NMOR resonance shown in Fig. 4 (defined as the maximum of the in-phase component) against the left axis as a function of input light power. The amplitude increases as a function of light power for low light power, until reaching a maximum at around corresponding to . Beyond saturation the amplitude decreases due to light broadening. Against the right axis in Fig. 5b we plot the sensitivity of the magnetometer assuming a photon shot-noise limited polarimeter sensitivity where is the number of photons per second exiting the cell. Light power is measured both before and after the beam passes through the cell to accurately take into account optical absorption. Optimum sensitivity of about is reached at about input light power bandwidth . The bandwidth of the magnetometer (the range of frequencies over which the signal is greater than half the value when ) is given by the full-width at half-maximum, about 50 Hz at . By increasing light power to the bandwidth may be doubled with little loss in sensitivity.

Atomic shot noise places a fundamental limit on the magnetometer sensitivity, given by
| (4) |
The factor of 2 is due to the fact that the magnetometer is sensitive only to the co-rotating component of an oscillating magnetic field. For an optimized magnetometer, one would expect that photon shot noise (adding in quadrature to the atom shot noise) would be comparable to the atomic shot noise Auzinsh and hence Eq. (4) must be multiplied by a factor of for a fair comparison. Thus, for optimized light power, the sensitivity based on photon shot noise in Fig. 5 is within a factor of 2 or 3 of the fundamental limit. This indicates that the optical pumping and probing scheme in this work is an efficient method for detecting spin precession, despite the fact that atoms can be pumped into the optically dark state. Some improvement in sensitivity may be achieved by increasing number density, however, in the regime where spin-exchange is the dominant relaxation process, scales inversely with density so that the shot-noise limit is independent of density at sufficiently high densities. We point out that increasing the number density can yield higher bandwidths.
A complete theoretical treatment of NMOR is difficult because of the presence of hyperfine structure, Doppler broadening, velocity mixing and evolution in the dark. Following the method outlined in Ref. NMOEreview we performed a simplified steady-state density matrix calculation on an transition which neglects these issues, but qualitatively reproduces the salient features of our experimental data. The hamiltonian is written in the rotating-wave approximation, neglecting terms counter rotating at either the optical or radio frequencies. The density matrix evolution equations are then formed, including terms describing spontaneous decay of the excited state, and atoms entering and leaving the interaction region (transit relaxation), and solved numerically. For conditions of high light power and detuning far from optical resonance, the model reproduces the splitting of the RF NMOR resonance shown inset in Fig. 4. When the light is tuned to optical resonance, a single feature is observed in the RF dependence of the optical rotation. The calculated power dependence of the amplitude of the resonance is similar to the experimentally observed behavior shown in Fig. 5. The model indicates that for light power that maximizes optical rotation (saturation), the hexadecapole contribution to the ground state polarization is small, (roughly 10%) compared to that of the quadrupole contribution.
V RF magnetometer performance

In Fig. 6 we plot the noise spectrum as measured by an SRS770 spectrum analyzer at the output of the balanced polarimeter. The large peak is an applied field of to calibrate the magnetometer. Baseline noise is about , falling somewhat short of the sensitivity estimates based on photon shot noise detection in Fig. 5b. Deformation of the beam by the cell resulted in a factor of roughly 5 loss of light power, pointing towards an obvious improvement for future work. In order to asses the performance of the polarimeter, shown inset in Fig. 6 is the measured noise floor (squares) as a function of light power incident on the polarimeter. The dashed line represents photon shot-noise . Polarimeter noise can be parameterized by
| (5) |
Here is the power incident on the polarimeter and and parameterize photon shot noise and amplifier noise respectively. The solid line overlaying the data is a fit based on Eq. (5), resulting in and , close to the theoretically predicted value. Hence, amplifier noise is the dominant contribution for incident light power less than about and photon shot-noise dominates for higher light power.
VI Conclusion
In conclusion, we have demonstrated a simple atomic magnetometric technique for the measurement of small RF magnetic fields based on a ground state Zeeman resonance and detection of non-linear magneto optical rotation in an alkali-metal vapor. Based on photon shot noise detection we estimate a sensitivity of approximately in a 3.5 cm diameter cell with a bandwidth of approximately 100 Hz. Estimates of the atom shot noise limit are within a factor of 2-3 of this limit, confirming that the present optical pumping and probing scheme is an efficient method for probing spin precession. Based on the actual signal to noise ratio, we have achieved a sensitivity of about . With several technical improvements, we anticipate a factor of 3-5 gain in sensitivity. Optimization of number density may yield some further gains in sensitivity as well as bandwidth. The magnetometer operates near room temperature, making it particularly attractive for applications in NMR. One possible such application is the measurement of a scalar, electron-mediated nuclear spin-spin coupling which can yield valuable information on molecular structure. The authors thank J. Higbie for useful comments and discussions. This work is supported by an ONR MURI program and KBN grant # 1 P03B 102 30.
References
- (1) A. N. Garroway et al. IEEE Trans. Geosci. Remote Sens. 39, 1108 (2001).
- (2) R. Bradley et al. Rev. Mod. Phys. 75, 777 (2003).
- (3) E. B. Alexandrov, M. V. Balabas, A. S. Pasgalev, A. K. Vershovskii and N. N. Yakobson, Laser Phys. 6, 244 (1996).
- (4) D. Budker, D. F. Kimball, S. M. Rochester, V. V. Yashchuk, and M. Zolotorev, Phys. Rev. A, 62 043403 (2000).
- (5) V. M. Acosta et al., Phys. Rev. A 73, 053404 (2006).
- (6) I. K. Kominis, T. W. Kornack, J. C. Allred, and M. V. Romalis, Nature 422, 596 (2003).
- (7) I. M. Savukov, S. J. Seltzer, M. V. Romalis, and K. L. Sauer, Phys. Rev. Lett. 95, 063004 (2005).
- (8) P. D. D. Schwindt et al. App. Phys. Lett 85, 6409 (2004).
- (9) R. McDermott et al. Science 295, 2247 (2002).
- (10) S. Appelt, H. Kuhn, F. W. Hasing and B. Blumich, Nature Physics 2, 105 (2006).
- (11) D. Budker, W. Gawlik, D. F. Kimball, S. M. Rochester, V. V. Yashchuk, and A. Weiss, Rev. Mod. Phys. 74, 1153 (2002).
- (12) S. Rochester and D. Budker, American Journal of Physics, 69(4), 450-4 (2001).
- (13) S. I. Kanorsky, A. Weis, J. Wurster, and T. W. Hänsch, Phys. Rev. A 47, 1220 (1993).
- (14) D. Budker, D. F. Kimball, S. M. Rochester and V. V. Yashchuk, Phys. Rev. Lett. 85, 2088 (2000).
- (15) V. V. Yashchuk et al. Phys. Rev. Lett. 90, 253001 (2003).
- (16) H. G. Robinson, E. S. Ensberg, and H. G. Dehmelt, Bull. Am. Phys. Soc. 3, 9 (1958).
- (17) M. A. Bouchiat and J. Brossel, Phys. Rev. 147, 41 (1966); M. A. Bouchiat, Ph. D. Thesis, University of Paris, 1964.
- (18) V. Yashchuk, D. Budker and M. Zolotorev, in Trapped Charged Particles and Fundamental Physics, edited by D. H. E. Dubin and D. Schneider (American Institute of Physics, New York, 1999), pp. 177-181.
- (19) D. Budker, V. Yashchuk, and M. Zolotorev, Phys. Rev. Lett. 81, 5788 (1998).
- (20) S. Pustelny, D. F. Jackson Kimball, S. M. Rochester, V. V. Yashchuk, and D. Budker, physics/0608109.
- (21) D. Budker, D. F. Kimball, V. V. Yashchuk, and M. Zolotorev, Phys. Rev. A 65, 055403 (2002).
- (22) M. T. Graf et al. Phys. Rev. A 72, 023401 (2005).
- (23) D. Budker et al., Phys. Rev. A 71, 012903 (2005).
- (24) M. Auzinsh et al. Phys. Rev. Lett. 93, 173002 (2004).
- (25) E. B. Aleksandrov, M. V. Balabas, A. K. Vershovskii, A. I. Okunevich, and N. N. Yakobson, Optics and Spectroscopy, 87, 329 (1999), 93, 488E (2002).
- (26) D. Budker, L. Hollberg, D. F. Kimball, J. Kitching, S. Pustelny, V. V. Yashchuk, Phys. Rev. A 71, 012903 (2005).
- (27) For NMOR in the Faraday geometry (see, for example, Ref. Bud98 ), the relaxation rate is where represents twice the distance from the center of the resonance to the extrema of the optical rotation. In the present work, represents the distance from the center of the resonance to the extrema of the optical rotation. The reason for this difference is that the angle between the aligned state and the initial light polarization vector is always small in this work, in contrast to NMOR in the Faraday geometry.
- (28) Estimates are based on a bandwidth of 1 Hz corresponding to a measurement time of 0.5 s.