High-precision Absolute Distance Measurement using Dual-Laser Frequency Scanned Interferometry Under Realistic Conditions
Hai-Jun Yang∗ and Keith Riles†
(∗yhj@umich.edu, †kriles@umich.edu)
Department of Physics, University of Michigan, Ann Arbor, MI 48109-1120, USA
Abstract
In this paper, we report on new high-precision absolute distance measurements performed with frequency scanned interferometry using a pair of single-mode optical fibers. Absolute distances were determined by counting the interference fringes produced while scanning the frequencies of the two chopped lasers. High-finesse Fabry-Perot interferometers were used to determine frequency changes during scanning. Dual lasers with oppositely scanning directions, combined with a multi-distance-measurement technique previously reported, were used to cancel drift errors and to suppress vibration effects and interference fringe uncertainties. Under realistic conditions, a precision about 0.2 microns was achieved for a distance of 0.41 meters.
OCIS codes: 120.0120, 120.3180, 120.2650, 120.6810
1 Introduction
We reported previously on single-laser measurements of absolute distance with a frequency scanned interferometry apparatus, carried out under controlled laboratory conditions. Here we report on dual-laser measurements carried out under less favorable conditions, more representative of the interior of a high energy physics detector at a collider. The motivation for these studies is to design a novel optical system for quasi-real time alignment of tracker detector elements used in High Energy Physics (HEP) experiments. A.F. Fox-Murphy et.al. from Oxford University reported their design of a frequency scanned interferometer (FSI) for precise alignment of the ATLAS Inner Detector . Given the demonstrated need for improvements in detector performance, we plan to design and prototype an enhanced FSI system to be used for the alignment of tracker elements in the next generation of electron-positron Linear Collider detectors. Current plans for future detectors require a spatial resolution for signals from a tracker detector, such as a silicon microstrip or silicon drift detector, to be approximately 7-10 . To achieve this required spatial resolution, the measurement precision of absolute distance changes of tracker elements in one dimension should be no worse than about 1 . Simultaneous measurements from hundreds of interferometers will be used to determine the 3-dimensional positions of the tracker elements.
Detectors for HEP experiment must usually be operated remotely for safety reasons because of intensive radiation, high voltage or strong magnetic fields. In addition, precise tracking elements are typically surrounded by other detector components, making access difficult. For practical HEP application of FSI, optical fibers for light delivery and return are therefore necessary. The power of front-end electronics depends on the event occupancy levels and trigger rates during the collider and detector operation. It is possible that the temperature distribution between heat sources and cooling system will vary enough to cause significant shape changes of the silicon detector in a relatively short period of time. Hence, it is critical to design a high precision optical alignment system that performs well under unfavorable environmental conditions.
Absolute distance measurements using FSI under controlled conditions have been reported previously by other research groups.
The University of Michigan group has constructed several demonstration Frequency Scanned Interferometer (FSI) systems with the laser light transported by air or single-mode optical fiber, using single-laser and dual-laser scanning techniques for initial feasibility studies. Absolute distance was determined by counting the interference fringes produced while scanning the laser frequency. The main goal of the demonstration systems has been to determine the potential accuracy of absolute distance measurements that could be achieved under both controlled and realistic conditions. Secondary goals included estimating the effects of vibrations and studying error sources crucial to the absolute distance accuracy. Two multiple-distance-measurement analysis techniques were developed to improve distance precision and to extract the amplitude and frequency of vibrations. Under well controlled laboratory conditions, a measurement precision of 50 nm was achieved for absolute distances ranging from 0.1 meters to 0.7 meters by using the first multiple-distance-measurement technique (slip measurement window with fixed size). The second analysis technique (slip measurement window with fixed start point) has the capability to measure vibration frequencies ranging from 0.1 Hz to 100 Hz with amplitude as small as a few nanometers, without a priori knowledge. The multiple-distance-measurement analysis techniques are well suited for reducing vibration effects and uncertainties from fringe & frequency determination, but do not handle well the drift errors such as from thermal effects.
The dual-laser scanning technique was pioneered by the Oxford group for alignment of the ATLAS Semi-conductor tracker; it was demonstrated that precisions of better than 0.4 m and 0.25 m for distances of 0.4 m and 1.195 m, respectively. In our recent studies, we combine our multi-distance-measurement analysis technique (slip measurement window with fixed size) reported previously with the dual-laser scanning technique to improve the absolute distance measurement precision. The multi-distance-measurement technique is effective in reducing uncertainties from vibration effects and interference fringe determination, while the dual-laser scanning allows for cancellation of drift errors. We report here on resulting absolute distance measurement precisions under more realistic conditions than in our previous, controlled-environment measurements.
2 Principles
We begin with a brief summary of the principles of frequency scanned interferometry and our single-laser measurement technique. The intensity of any two-beam interferometer can be expressed as , where and are the intensities of the two combined beams, and and are the phases. Assuming the optical path lengths of the two beams are and , the phase difference is , where is the optical frequency of the laser beam, and c is the speed of light.
For a fixed path interferometer, as the frequency of the laser is continuously scanned, the optical beams will constructively and destructively interfere, causing “fringes”. The number of fringes is , where is the optical path difference between the two beams, and is the scanned frequency range. The optical path difference (OPD for absolute distance between beamsplitter and retroreflector) can be determined by counting interference fringes while scanning the laser frequency.
If small vibration and drift errors occur during the laser scanning, then , , Assuming and , the measured distance can be written as,
where is a magnification factor: .

3 Demonstration System of FSI
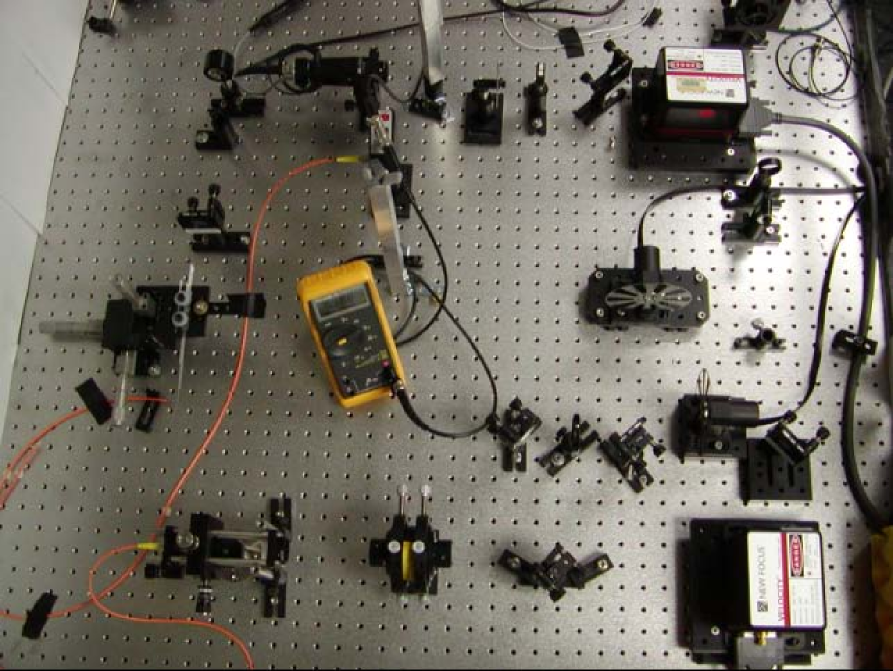
A schematic of the FSI system with a pair of optical fibers is shown in Figure 1. The light sources are two New Focus Velocity 6308 tunable lasers (Laser 1 - 665.1 nm 675.2 nm; Laser 2 - 669.2 nm 679.3 nm ). Two high-finesse () Thorlabs SA200 Fabry-Perot are used to measure the frequency range scanned by the laser. The free spectral range (FSR) of two adjacent Fabry-Perot peaks is 1.5 GHz, which corresponds to 0.002 nm. A Faraday Isolator was used to reject light reflected back into the lasing cavities. The laser beams were coupled into a single-mode optical fiber with a fiber coupler. Data acquisition is based on a National Instruments DAQ card capable of simultaneously sampling 4 channels at a rate of 5 MS/s/ch with a precision of 12-bits. Omega thermistors with a tolerance of 0.02 K and a precision of 0.01 are used to monitor temperature. The apparatus is supported on a damped Newport optical table.
The beam intensity coupled into the return optical fiber is very weak, requiring ultra-sensitive photodetectors for detection. Given the low light intensity and the need to split into many beams to serve a set of interferometers, it is vital to increase the geometrical efficiency. To this end, a collimator is built by placing an optical fiber in a ferrule (1mm diameter) and gluing one end of the optical fiber to a GRIN lens. The GRIN lens is a 0.25 pitch lens with 0.46 numerical aperture, 1 mm diameter and 2.58 mm length which is optimized for a wavelength of 630nm. The density of the outgoing beam from the optical fiber is increased by a factor of approximately 1000 by using a GRIN lens. The return beams are received by another optical fiber and amplified by a Si femtowatt photoreceiver with a gain of .
4 Dual-Laser Scanning Technique
A dual-laser FSI system was built in order to reduce drift error and slow fluctuations occurring during the laser scan, as shown in Figure.1. Two lasers are operated simultaneously; the two laser beams are coupled into one optical fiber but isolated by using two choppers. The advantage of the dual-laser technique comes from cancellation of systematic uncertainties, as indicated in the following. For the first laser, the measured distance , and is drift error during the laser scanning. For the second laser, the measured distance . Since the two laser beams travel the same optical path during the same period, the drift errors and should be very comparable. Under this assumption, the true distance can be extracted using the formula , where, , the ratio of magnification factors from two lasers. If two similar lasers scan the same range in opposite directions simultaneously, then , and can be written as,
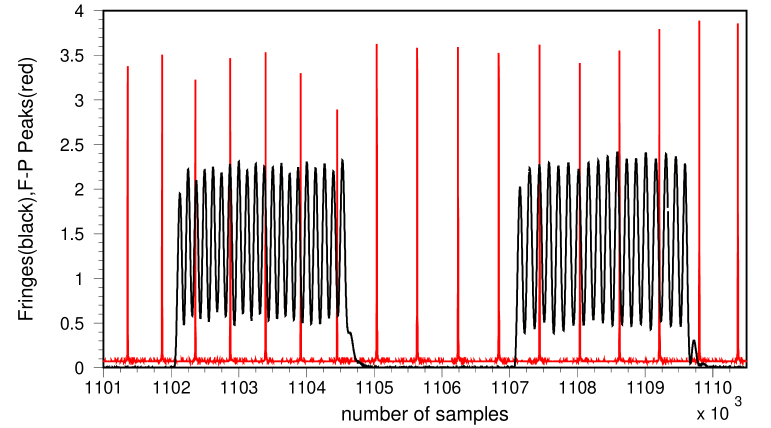
Unfortunately, there are disadvantages too in the dual-laser technique. Because the laser beams are isolated by periodic choppers, only half the fringes are recorded for each laser, degrading the distance measurement precision, as shown in Figure 2. Missing fringes during chopped intervals for each laser must be recovered through robust interpolation algorithms. Based on our studies, the number of interference fringes in a time interval with fixed number of Fabry-Perot peaks is stable. The measured number of fringes is nearly always within 0.5 (typically within 0.3) of the expected fringe number, which enables us to estimate the number of fringes in the chopper-off slots (when the laser beam is blocked by the chopper). In order to determine the number of fringes in one chopper-off slot, we need to identify two Fabry-Perot peaks within the two adjacent chopper-on slots closest to the chopper-off slot. If the fringe phases at the two Fabry-Perot peaks positions are and , where I and J are integers, and are fraction of fringes; then the number of true fringes can be determined by minimizing the quantity , where is an integer used to correct the fringe number in the chopper off slot, is the expected average number of fringes, based on a full laser scanning sample shown in Figure 3.
For the example shown in Figure 2, the number of Fabry-Perot intervals is 5 in the chopper-off slot, so the expected number of fringes shown in the 2nd plot of Figure 3 is about 20.6; The number of fringes measured in the chopper-off slot is 3.55, is 17 based on the above formula, meaning 17 fringes are missed in the chopper-off slot. So the total number of fringes in this slot is 20.55, well within the expected range .

5 Absolute Distance Measurement
Under realistic and deliberately generated hostile conditions of air flow and vibration, 40 dual-laser-scan data samples were collected as listed in the following. The “box” refers to a nested enclosure of plexiglass box covering the optical table and PVC pipe surrounding the interferometer beam path, used in previous measurements to isolate the interferometer from environmental fluctuations. Both the cover of the box and the pipe are removed for the measurements described here.
-
•
with open box (10 scans) and ambient room environment,
-
•
with open box and a chassis cooling fan (9 cm diameter) blowing air toward the beam splitter about 0.93 meters away from the retroreflector along the FSI (10 scans),
-
•
with open box and fan off (10 scans),
-
•
with open box and a vibration source (10 scans), with a PI piezoelectric translator (P-842.10) used to generate controlled vibrations with frequency of 1 Hz and amplitude of about 0.15 microns. (10 scans were collected, but 2 scans were found to have suffered a power glitch on one laser, invalidating the distance reconstructions. These 2 scans were excluded from the analysis.)
To verify correct tracking of large thermal drifts, another set of scans was carried out after remounting the interferometer on a Aluminum breadboard (Thorlabs) and placing the breadboard on a heating pad (Homedics). Twenty dual-laser-scan data samples with the heating pad off and on were collected as listed in the following,
-
•
with open box and the heating pad off (10 scans with one scan excluded because of a power glitch),
-
•
with open box and the heating pad on (10 scans).
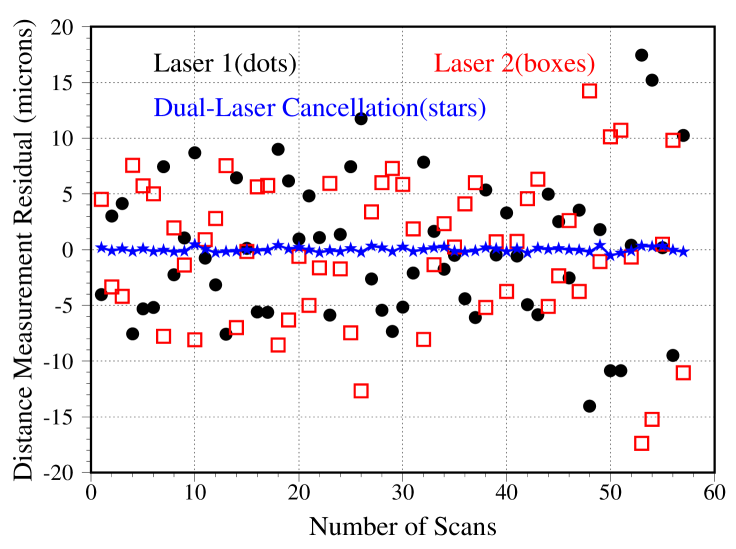
The two lasers were scanned oppositely with scanning speeds of 0.4 nm/s and a full-scan time of 25 seconds. The choppers have two blades with operation frequency of 20 Hz for these dual-laser scans. The measured precision is found to vary from about 3 to 11 microns if we use the fringes of these data samples from only one laser for a measured distance of 0.41 meters. The single-laser multi-distance-measurement technique does not improve the distance measurement precision in open box data because drift error dominates. If we combine the measured distances from two lasers using Eq.(2), then the dual-laser measurement precision is found to be about 0.2 microns for a number of multi-distance-measurements larger than 500, as shown in Figure 4 and Table 1. From Table 1, it is apparent that if we use fewer distance measurements/scan or a single-distance-measurement, then the measured precision worsens significantly. Combining the dual-laser scanning technique and multi-distance-measurement technique ensures that vibrations, fringe uncertainties and drift errors are greatly suppressed.
Under nearly identical conditions, the measured distances from laser 1 and laser 2 are slightly different, as expected from their slightly different FSRs (taken to be 1.5 GHz for the distance measurements) of the two Fabry-Perot interferometers. Since a high precision wavemeter is not available in our laboratory currently, we cannot calibrate the FSRs of two Fabry-Perot interferometers precisely. Instead, we use the measured distances from two lasers to determine the ratio (1.0005928) between the FSRs of the two Fabry-Perot interferometers, and then normalize all measured distances from the 2nd laser using the same factor. This correction method was validated previously with a different interferometer configuration by comparing the normalization factor to that inferred from measuring the transmission peaks of the two Fabry-Perot interferometers when monitoring the same laser. That check was limited in precision, however, to no better than 4 ppm.
In order to verify the correct tracking of large thermal drifts, we placed a heating pad on the Aluminum breadboard. Thermistors are taped to the breadboard but electrically isolated. The true temperature of the breadboard is inferred to be the 0.6 higher than the measured temperature from extrapolation of temperature gradient from 3 external thermistors. Four independent tests with different temperature increases are made, the results are shown in Table 2. Each test has 20 dual-laser scans for the distance measurement before (10 scans) and after (10 scans) the temperature increase. The expected distance changes agree well with the measured distance changes due to thermal extension. The uncertainty of the expected distance change comes mainly from the large error in temperature measurement of the Aluminum breadboard. Temperature fluctuations are found to be about in half a minute with the heating pad on (low - high level), about times larger than the temperature fluctuations with open box and the heating pad off.
In order to verify the distance measurement from FSI, a pizeoelectric transducer (P-842.10 from PI, with 20% tolerance) was used to generate controlled position shifts of the retroreflector. For instance, for an input voltage of 13.13 volts, the expected distance change is 1.97 0.39 microns. The measured distance change under controlled conditions is 2.23 0.07 microns, in good agreement.
6 Error Estimation
Based on the error estimation we reported previously, the distance measurement statistical uncertainty is about 0.05 microns under well controlled, closed box conditions. For the dual-laser scanning technique, only about 40% of the independent fringe measurements can be used in the multi-distance-measurement, giving an expected statistical uncertainty of the distance measurement from each laser of no better than about microns. The measurement errors from laser 1 and laser 2 propagate to the final distance measurement using Eq.(2), leading to a corresponding error of about microns.
Since manual scan starts give laser start times that may differ by as much as 0.5-1.0 seconds, expected differences in drift errors are expected to differ by as much as 2%-4%. Typically, the drift errors from single laser are found to be about 3 11 microns for different samples under open-box conditions, as shown in Table 1; so the expected uncertainty ranges from 0.03 0.22 microns.
Combining all above errors, the expected distance measurement statistical uncertainty ranges as high as 0.23 microns, consistent with the measured variations.
Some other sources can contribute to systematic bias in the absolute distance measurement. The major systematic bias comes from the uncertainty in the FSR of the Fabry-Perot used to determine the scanned frequency range. A high precision wavemeter(e.g. ) was not available for the measurements described here. The systematic bias from the multiple-distance-measurement technique is typically less than 50 nanometers. The systematic bias from uncertainties in temperature, air humidity and barometric pressure scale are estimated to be negligible.
| Data | Scans | Conditions | Distance(cm) | Precision(m) for multi-dist.-meas./scan | |||||
|---|---|---|---|---|---|---|---|---|---|
| open box | from dual-laser | 2000 | 1500 | 1000 | 500 | 100 | 1 | ||
| L1 | 10 | open box | – | 5.70 | 5.73 | 6.16 | 6.46 | 5.35 | 6.64 |
| L2 | 10 | open box | – | 5.73 | 5.81 | 6.29 | 6.61 | 5.66 | 6.92 |
| L1+L2 | 10 | open box | 41.13835 | 0.20 | 0.19 | 0.18 | 0.21 | 0.39 | 1.61 |
| L1 | 10 | with fan on | – | 5.70 | 4.91 | 3.94 | 3.49 | 3.29 | 3.04 |
| L2 | 10 | with fan on | – | 5.70 | 5.19 | 4.23 | 3.78 | 3.21 | 6.07 |
| L1+L2 | 10 | with fan on | 41.13841 | 0.19 | 0.17 | 0.20 | 0.22 | 0.31 | 3.18 |
| L1 | 10 | with fan off | – | 6.42 | 5.53 | 4.51 | 3.96 | 4.41 | 3.36 |
| L2 | 10 | with fan off | – | 6.81 | 5.93 | 4.86 | 4.22 | 4.63 | 5.76 |
| L1+L2 | 10 | with fan off | 41.13842 | 0.20 | 0.20 | 0.26 | 0.19 | 0.27 | 2.02 |
| L1 | 8 | with vibration on∗ | – | 4.73 | 4.82 | 3.60 | 3.42 | 4.62 | 8.30 |
| L2 | 8 | with vibration on | – | 4.72 | 4.66 | 3.66 | 3.65 | 4.63 | 5.56 |
| L1+L2 | 8 | with vibration on | 41.09524 | 0.17 | 0.21 | 0.17 | 0.15 | 0.39 | 1.75 |
| L1 | 9 | with heating pad off† | – | 3.88 | 3.90 | 3.57 | 3.65 | 3.28 | 3.84 |
| L2 | 9 | with heating pad off | – | 4.01 | 4.01 | 3.64 | 3.55 | 3.25 | 4.66 |
| L1+L2 | 9 | with heating pad off | 40.985122 | 0.14 | 0.14 | 0.11 | 0.12 | 0.19 | 1.86 |
| L1 | 10 | with heating pad on | – | 11.39 | 11.15 | 10.05 | 7.44 | 6.24 | 5.04 |
| L2 | 10 | with heating pad on | – | 11.42 | 11.21 | 10.23 | 7.39 | 6.47 | 6.30 |
| L1+L2 | 10 | with heating pad on | 40.987189 | 0.32 | 0.19 | 0.20 | 0.19 | 0.20 | 1.24 |
7 Conclusion
In this paper, high-precision absolute distance measurements were performed with frequency scanned interferometry using dual-laser scanning and multi-distance-measurement techniques. The dual-laser scanning technique is confirmed to cancel drift errors effectively, and the multi-distance-measurement technique is used to suppress the vibration and uncertainties from interference fringe determination. Under realistic conditions, a precision of about 0.2 microns was achieved for an absolute distance of 0.41 meters.
This work is supported by the National Science Foundation and the Department of Energy of the United States.
References
- [1] Hai-Jun Yang, Jason Deibel, Sven Nyberg, Keith Riles, “High-precision Absolute Distance and Vibration Measurement using Frequency Scanned Interferometry”, Applied Optics, Vol. 44, 3937-3944(2005). physics/0409110.
- [2] A.F. Fox-Murphy, D.F. Howell, R.B. Nickerson, A.R. Weidberg, “Frequency scanned interferometry(FSI): the basis of a survey system for ATLAS using fast automated remote interferometry”, Nucl. Inst. Meth. A383, 229-237(1996)
- [3] P.A. Coe, D.F. Howell, R.B. Nickerson, “Frequency scanning interferometry in ATLAS: remote, multiple, simultaneous and precise distance measurements in a hostile environment”, Meas. Sci. Technol.15 (11): 2175-2187 (2004)
- [4] P. A. Coe, “An Investigation of Frequency Scanning Interferometry for the alignment of the ATLAS semiconductor tracker”, Doctoral Thesis, St. Peter’s College, University of Oxford, Keble Road, Oxford, United Kingdom, 1-238(2001)
- [5] http://www.linearcollider.org/
- [6] American Linear Collider Working Group(161 authors), “Linear Collider Physics, Resource Book for Snowmass 2001”, Prepared for the Department of Energy under contract number DE-AC03-76SF00515 by Stanford Linear Collider Center, Stanford University, Stanford, California. hep-ex/0106058, SLAC-R-570 299-423(2001)
- [7] J.A. Stone, A. Stejskal, L. Howard, “Absolute interferometry with a 670-nm external cavity diode laser”, Appl. Opt. Vol. 38, No. 28, 5981-5994(1999)
- [8] Dai Xiaoli and Seta Katuo, “High-accuracy absolute distance measurement by means of wavelength scanning heterodyne interferometry”, Meas. Sci. Technol.9, 1031-1035(1998)
- [9] G.P. Barwood, P. Gill, W.R.C. Rowley, “High-accuracy length metrology using multiple-stage swept-frequency interferometry with laser diodes”, Meas. Sci. Technol. 9, 1036-1041(1998)
- [10] K.H. Bechstein and W Fuchs, “Absolute interferometric distance measurements applying a variable synthetic wavelength”, J. Opt. 29, 179-182(1998)
- [11] J. Thiel, T. Pfeifer and M. Haetmann, “Interferometric measurement of absolute distances of up to 40m”, Measurement 16, 1-6(1995)
- [12] H. Kikuta, R. Nagata, “Distance measurement by wavelength shift of laser diode light”, Appl. Opt. Vol. 25, 976-980(1986)