Send correspondence to H. Backe
E-mail: Backe@kph.uni-mainz.de, Telephone: ++49-6131-39-25563
Forward Diffracted Parametric X Radiation From a Thick Tungsten Single Crystal at 855 MeV Electron Energy
Abstract
Features of forward diffracted Parametric X-Radiation (PXR) were investigated at experiments with the 855 MeV electron beam of the Mainz Microtron MAMI employing a 410 m thick tungsten single crystal. Virtual photons from the electron field are diffracted by the (10) plane at a Bragg angle of 3.977∘. Forward emitted radiation was analyzed at an energy of 40 keV with the (111) lattice planes of a flat silicon single crystal in Bragg geometry. Clear peak structures were observed in an angular scan of the tungsten single crystal. The results were analyzed with a model which describes forward diffracted PXR under real experimental conditions. The experiments show that forward diffracted PXR may be employed to diagnose bending radii of lattice planes in large area single crystals.
keywords:
Parametric X radiation1 INTRODUCTION
If a charged particle passes an interface between two amorphous media with different dielectric susceptibilities broad band electromagnetic radiation is produced. The frequency spectrum of this so-called transition radiation (TR) has been calculated by Ginsburg and Frank [1] and Garibian [2, 3]. In the ultra relativistic case the radiation distribution resembles a Lorentz transformed dipole pattern with maximum intensity at an angle 1/ with the relativistic factor, , the electron velocity, and the speed of light. The energy spectrum extends up to a gradual cut-off energy with the plasma frequency. For an electron energy of 855 MeV, as available at the Mainz Microtron MAMI, the characteristic opening angle at = 1673 amounts to 0.6 mrad. The cut off energy for tungsten with = 80.4 eV is as high as 135 keV.
When a relativistic electron crosses the boundary between vacuum and a single crystal the TR propagates into the crystal in forward direction. A diffracted transition radiation (DTR) reflex with a wave vector is created if the wave vector associated with the virtual photon field of the electron fulfils approximately the well known Bragg law in vector form , with H a reciprocal lattice vector of a specific crystal plane, see e.g. [4]. Inside the crystal the TR field will be extinguished by Bragg scattering, photo absorption or Compton scattering. After a sufficiently long distance from the entrance interface its amplitude may become negligibly small. Finally, deep inside the crystal, only the virtual photon field associated with the electron remains. But also under these circumstances monochromatic X rays are emitted close to the Bragg direction. This kind of radiation was predicted in the framework of a kinematical theory by Ter-Mikaelian [5] in which only one diffracted wave is required. Baryshevsky and Feranchuk [6, 7], and Garibian and Yang [8, 9] explained this so-called parametric X-ray radiation (PXR) with dynamical theories in which an additional forward diffracted wave occurs. According to theoretical predictions PXR is quasi-monochromatic and features at a fixed observation angle narrow energy band characteristics. It was suggested that PXR is just a kind of Čerenkov radiation, see Ref. [10] and citations therein. Later on, kinematical theories were developed by Nitta [11, 12], Achim Richters group [13], and dynamical ones by Caticha [4, 14] and Artru et al. [15]. Experimentally PXR was studied in a number of papers, see e.g. for an overview up to the year 1997 Ref. [16] and references cited therein, as well as Ref. [17, 18, 19, 20].
It is very difficult to decide experimentally whether PXR emission is a kinematical or dynamical process. The reason has been discussed by Nitta [21]. He showed that the first-order approximation of the dynamical calculation gives the kinematical expression. Extremely accurate absolute intensity measurements would be required to detect a difference. Baryshevsky [22] proposed to search for the predicted forward diffracted wave which is associated to PXR and emitted close to the direction the electron travels. Similar proposals have also been communicated by Nasonov [23, 24]. A number of unsuccessful experiments were performed for the search of such a forward diffracted parametric X radiation (FDPXR) [25, 26, 27, 28]. First observations of interference phenomena in the TR emission spectrum close to a Bragg energy from thin silicon single crystal targets were reported by the Mainz group [29]. Later on, the forward diffracted PXR peaks were observed by the Tomsk-Belgorod [30] and the Mainz [31] groups.
In this contribution we describe results obtained with a 410 m thick tungsten single crystal at the Mainz Microtron MAMI. This crystal, cut with the direction perpendicular to the surface, was also used for experiments of Ref. [30]. In the experiments described in this contribution special emphasis was put on a more quantitative understanding of the forward diffracted PXR peak for which also the influence of the analyzing crystal spectrometer device on the signal generation had to be studied carefully.
2 BASICS
2.1 Parametric X Radiation as a Dynamical Process
Let us consider the radiation fields of a highly relativistic electron in a semi-infinite crystal. The electron is assumed to move on a straight trajectory with constant relativistic factor . If the electron crosses the boundary between vacuum and crystal transition radiation (TR) and transition diffracted radiation (TDR) is created, see e.g. [4]. The TR field propagates in the crystal in forward direction, the TDR field is assumed to be associated with a Laue reflection characterized by a reciprocal lattice vector H. Both fields will be attenuated in the crystal by photo absorption or Compton scattering and after a sufficient long distance from the entrance interface their amplitudes may become negligibly small. Finally, only the virtual photon field associated to the electron remains. We are interested in the interaction of this field with the crystal which can best be discussed in the framework of dispersion surfaces. Following the work of Caticha [4] in Fig. 1 dispersion surfaces of the electron field (DSEF) and of X-rays in the crystal (DSXC) are shown. In this picture a virtual photon is characterized by a wave vector , starting at a point V of the DSEF and pointing to the origin O, and the field amplitude . A particular situation happens if the point V approaches the intersection C between the DSEF and the DSXCH with its origin at the point H. In the surrounding of this intersection point C the virtual photon field of the electron is diffracted. The momentum transfer transforms into and a real photon in the crystal with a field amplitude is created. This is the well known PXR field. The corresponding forward diffracted field , however, remains a virtual one. A momentum transfer would be required to shift it on the DSXC0 which has its origin at point O. In this equation is the vacuum wave vector of the radiation field, the angle between v and , and the mean dielectric susceptibility of the crystal.
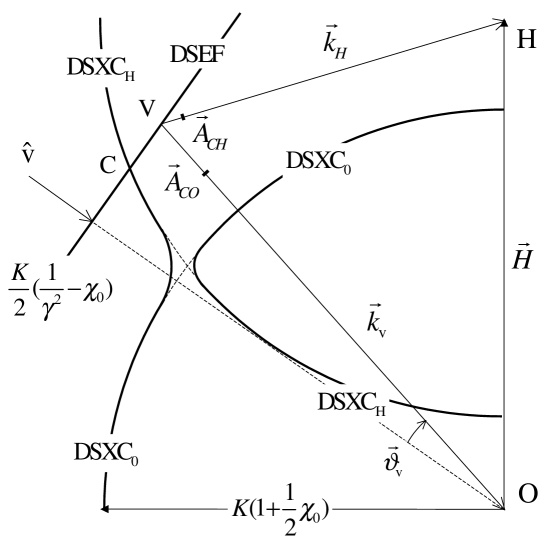 |
The fact that only one real field amplitude exists in the crystal at the intersection C between DSEF and DSXCH resembles a kinematical picture of PXR generation. But in reality the virtual field of the electron is diffracted into two field amplitudes and from which the former remains a virtual field. It must be concluded that in the framework of this picture PXR production is a dynamical process.
It remains to be discussed how the existence of the forward diffracted virtual field at the intersection C can be established experimentally. Of course, as a virtual field it can not be observed directly. However, let us assume that the electron exits the crystal at a second boundary again into vacuum. The continuity of the vector potential at this surface requires an additional radiation field in vacuum with the virtual field amplitude of the moving electron in vacuum. At a point V far off the intersection point C the emitted radiation is just again the well known TR. However, close to the intersection C the additional forward diffracted field amplitude will contribute in addition. The free X-ray field can be observed with an angular and energy resolving radiation detector system. It is expected that the amplitude and therefore also the radiation field exhibits a resonance behavior at well defined correlated photon emission angles and photon energies which we call in the following forward diffracted parametric X radiation (FDPXR). As will be discussed elsewhere in more detail, FDPXR can either be observed as an ”amplitude contrast” from a thick (semi-infinite) crystal or as a ”phase contrast” from a thin crystal slab. In the former only the amplitude from the exit interface remains, while in the latter the radiation amplitude created at the entrance interface survives and interferes coherently with the amplitude created at the exit interface. Both experiments have been performed at the Mainz Microtron MAMI [31].
2.2 Theoretical Background
Following the formalism of Caticha [4], the amplitude of the radiation in forward direction and for PXR, emitted from an electron exiting a semi-infinite crystal, are given by the Equations
| (1) |
and
| (2) |
respectively. Here
| (3) |
and
| (4) |
are the vacuum formation length and the mean formation length in the crystal, respectively. Notice that the latter is just the formation length for amorphous matter. The quantity is the relative energy deviation from the reference energy with , the Miller indices, and the lattice constant. The quantities , , , and are functions of various geometrical variables as the observation angle , the deviation of an individual electron from the nominal direction which coincides with the axis, the rotation angle around the vertical axis which describes a small deviation of the reciprocal lattice vector H from the nominal orientation in the plane, and the Fourier components and of the dielectric susceptibility of the crystal, see Ref. [33]. For our experimental conditions these quantities are sufficiently well approximated by
| (5) | |||||
| (6) | |||||
| (7) | |||||
| (8) |
Moreover, the factor is 1 or for or polarization, respectively, the desired polarization state, , and e the charge of the electron. Finally, the polarization factor must be calculated. We distinguish between polarization for which the polarization vector lies in the plane spanned by the vector and H, and polarization for which is perpendicular to this plane. Notice, that in both cases the polarization vector is perpendicular to the unit wave vector of the virtual photon. The result is
| (12) |
It is important to realize that the counterpart of the ”diffracted” PXR amplitude, Eq. (2), can be found in Eq. (1) in the ”primary” FDPXR amplitude
| (13) |
PXR and FDPXR amplitudes are intimately connected with each other. Both amplitudes have the same structure, in particular their poles are identical, and both amplitudes disappear for amorphous matter, i.e. for = 0. In this case the parameters and are zero, and the forward amplitude, Eq. (1), reduces to the expression for transition radiation from a single interface of amorphous matter. The same is true far off the resonance where the PXR and FDPXR amplitudes are negligibly small.
 |
If the polarization state is not observed the final result for the total number of photons emitted per relative energy band width into the solid angle is the incoherent sum of the and polarization contributions and reads
| (14) |
The intensity distribution of the forward emitted radiation for a single interface is depicted in Fig. 2. Panel (a) resembles the cross-section of resonance s-wave neutron scattering off heavy nuclei. Similar as in the latter, the smooth part of the formation length and the additional FDPXR resonance term interfere destructively at the low energy side of the resonance and constructively at the high energy side. The resulting structure has a very narrow width, in the order of 8 meV only. However, any angular distribution of the electrons at the exit of the crystal in the angle may deteriorate the line width. Assuming a Gaussian with an rms value = 5.32 mrad, which is expected from multiple scattering of the electrons in a tungsten crystal with a thickness of 410 m [34], the intensity distributions of each polarization state are the integrals
| (15) | |||||
| (16) |
In this approximation the double integral over and has been replaced by a single integral. The approximation is supposed to be sufficiently accurate as long as the observation angle is very small in comparison to . For the angles and enter in Eq. (14) symmetrically in second order as with the exception of a pre-factor and for and polarization, respectively, originating from Eq. (12). With the substitution the integration can be carried out in polar coordinates. The integral over results in a common factor which cancels in Eq. (15) and (16) with a factor in the de-nominator originating from the normalization of the two-dimensional Gaussian. The result is shown in Fig. 2 (c) in a linear scale. The line is still as narrow as about 8 eV or 2 with respect to the photon energy but has rather long tails. The reason of this quite unexpected result can again be found in the already mentioned fact that the quantities and enter in Eq. (14) in second order, see Eqns. (5), (6), (7), (8), and 12. Panels (b) and (d) show corresponding results of the intensity distribution at a fixed photon energy. It is noteworthy that even with the scattering distribution with an angular rms value of 5.32 mrad the angular width of the resonance amounts to only 14 rad.
The detection of such narrow structures is difficult. While the regular PXR peak is background free and can be observed with detectors of moderate energy resolution, the FDPXR structure is always located on top of the smooth transition radiation background. This TR background can clearly be seen in Fig. 2 (a) and (b). To find the narrow structures experimentally this background must be suppressed which requires for the detector a comparably very good energy resolution. As will be described in the next subsection, a silicon single crystal monochromator is well suited for this purpose.
 |
 |
 |
 |

2.3 Principle of the Experiment
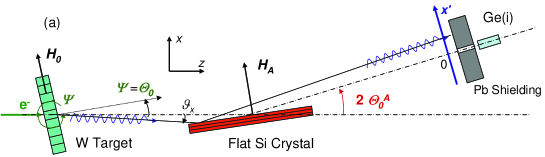
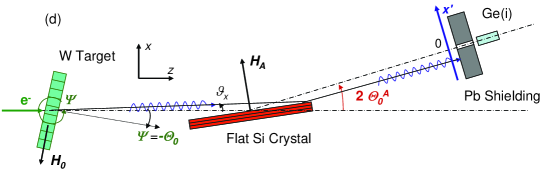
The signal generation will be explained by means of Fig. 3. The reciprocal lattice vector of the radiator crystal as well as of the analyzer crystal are located in the horizontal plane. The two possibilities to place vector in the plane, which are shown in Figs. 3 (a) and (d), correspond to quite different features of the FDPXR signals. The energy of the quasi-monochromatic FDPXR line as function of the emission angle is shown in panels (b) and (e) for three different rotation angles of the target crystal around the vertical axis, which are deviations from the nominal value . The middle line for = 0 corresponds to the nominal Bragg angle to which a positive or a negative sign is assigned, depending on the orientation of the vector. Notice, that for the positive orientation of the target crystal the FDPXR energy increases as function of the emission angle while for the negative orientation the energy decreases. This feature has the consequence that the energy characteristics of the flat analyzer crystal, which is assigned in Fig. 3 with Si, intersects the FDPXR line at quite different angles resulting in different intensities of the Bragg reflex for FDPXR. The energy has been calculated with the general relation
| (17) |
which holds for a cylindrically bent crystal with a bending radius and takes also into account a small deviation from the nominal Bragg direction . The quantity is the distance between target and analyzer crystal. For a flat crystal the bending radius is , and . In the following it is assumed that for = 0 also = 0 and the reflex enters the detector slit at the position = 0. If now the rotation angle is changed also must be varied in order that FDPXR and Si analyzer energies match again. As a consequence, the reflex appears at a different position at the detector plane. Again, the displacements are different for the positive and the negative orientation of the W target crystal as shown in panels (c) and (f).
In an experiment the count rate of a detector positioned behind a vertical slit is detected as function of the rotation angle . The intensity is given by the double integral
| (18) |
with the reflecting power ratio of the silicon monochromator crystal. The latter was calculated from the amplitude ratio [4, Eq.(3.2)]
| (19) | |||||
| (20) | |||||
| (21) |
The widthes are different for the two polarization states. In order to simplify the numerical calculations the reflecting power ratio was approximated by a Dirac- function as with the integrated reflecting power . The numerical values of the reflecting power ratios are and and differ only slightly from each other for the two polarization states at the small Bragg angle . For a cylindrically bent crystal the angle of incidence is given by with the factor . With the correlation , which follows from Eq. (21), Eq. (18) can be brought into the form
| (22) |
The integral must be taken over the angular region in which the detector accepts. Limitations originate from the finite analyzer crystal length and the slit aperture in front of the detector.
3 EXPERIMENTAL
3.1 Experimental Setup
The basic idea of our experiment was already explained in subsection 2.3. The details of the setup will be described in the following with the help of Fig. 5. The
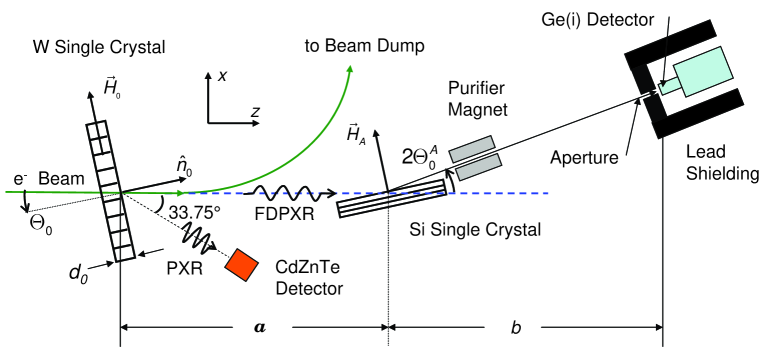 |
target tungsten single crystal, cut with the (111) plane parallel to the crystal surface, must be positioned in such a manner that the reciprocal lattice vector of the crystal plane is located in the plane of drawing. At a Bragg angle the photon energy amounts to keV for both, PXR emitted at twice the Bragg angle and FDPXR emitted close to the electron beam direction. The required energy resolution in the order of and at the same time a good angular resolution is achieved by a flat silicon single crystal in Bragg geometry. The monochromator crystal was cut with the (111) plane parallel to the crystal surface and was used to analyze the FDPXR with its (111) reflection. At a Bragg angle the analyzing energy amounted also to keV. The angular width of this reflection for a photon line with an assumed -function-like shape is about 7 rad, the energy width for an infinitesimal small accepted angular band about 1.4 . These numbers match well with the expected multiple scattering broadened FDPXR peak, see Figure 2. The observation angle is selected by a slit of 3.5 mm width in front of the photon detector. At target-monochromator and monochromator-detector distances of 7629 mm and 8436 mm, the angular interval accepted by such a slit aperture is = 0.22 mrad which is somewhat larger as the calculated FDPXR width of 14 rad. However, it should be mentioned that the energy-angle correlations of both, FDPXR and analyzer crystal, defines also the accepted angular band. The FDPXR resonance is sought by a variation of the rotation angle of the tungsten crystal around the vertical axis. As photon detector a Ge(i) detector with a resolution of 630 eV at 40 keV was used.
3.2 Measurements and Results
The experiments were performed at an electron beam energy of 855 MeV delivered by the Mainz Microtron MAMI. The beam current was about 2 nA. The beam spot size amounted to 48 m (rms) horizontally and 55 m (rms) vertically. At a beam emittance of mrad and mrad the angular divergence of the electron beam was 146 rad (rms) and 9 rad (rms) in horizontal and vertical direction, respectively. These numbers are small in comparison to the opening angle of the TR cone which is in the order of 1/ = 0.6 mrad. The [111] direction of the tungsten target crystal was aligned into the beam direction by means of a goniometric stage with angular resolution of . A signal which is sensitive to channeling was derived from an ionization chamber located 400 mm behind the analyzer crystal. After the [111] direction of the crystal was found, the reciprocal lattice vector H for one of the three crystal planes had to be placed into the horizontal plane. This was achieved by observation of the ordinary PXR with the aid of CdZnTe detector, see Fig. 5. The target crystal was rotated around the vertical axis by an angle in order to fulfill the Bragg condition. The PXR photon energy at this angle is 9.6 keV. At a rotation around the [111] crystal axis from 0-360∘ six PXR reflexes of equal intensity are expected which are separated by 60∘ from each other. However, we observed rather irregular intensities of these reflexes. The reason was found in the fact that the surface normal of the crystal and the reciprocal lattice vector for the [111] direction obviously do not coincide. Since the goniometric stage rotates the crystal around the axis, the Bragg angle varies at the rotation, i.e. the angle between beam direction and the various vectors of the family. The experimental intensities could be explained with the assumption that rotation axis of the goniometer and [111] direction of the crystal make an angle of 1.69∘. At a rotation of the crystal the Bragg angles are 16.80∘, 15.12∘, 14.11∘, 14.78∘, 16.46∘, and 17.47∘. Only two values are close to the nominal Bragg angle of 16.88∘ in accord with the experimental observation that only two strong lines and four rather weak ones were observed. The settings of the goniometer found for the strongest reflection was chosen.
A very simple check that the right lattice planes were found can be performed by a small displacement of the detector in direction, re-adjustment of the analyzer Bragg angle by the corresponding angle and a measurement of the angle at which the FDPXR peak reappears again. From Eqns. (5) and (17) it follows that the ratio of these angles is with the plus sign for the positive and the minus sign for the negative orientation. Experimentally we found mrad/mrad and mrad/mrad, respectively.
For the search of the FDPXR peaks angular scans around the vertical axis were carried out in the angular interval and . The scans are shown in Figure 6 (a) and (b).

|
 |
 |
 |
4 Discussion
The striking result of the experiment described in section 3 is the fact that for the negative orientation a clear peak with a peak-to-background ratio of 1:1 was observed, while for the positive orientation the peak is rather weak. This experimental finding is just the opposite of what was expected, see Fig. 4. A possible experimental mistake in the assignment of positive and negative orientation of the tungsten crystal was carefully checked and could safely be excluded as an explanation. Also the signs in the FDPXR formulas underlying the calculations were checked and a mistake could not be found. The only reasonable explanation for the reversed intensities was found in a residual bending of the ”plane” silicon analyzer crystal. Assuming a cylindrical shape of the analyzing crystal with a bending radius , the energy characteristics of the analyzer crystal changes its slope as function of . As shown in Fig. 7 a reversed situation in comparison to Figs. 3 can be achieved with a concave cylindrical shape of the analyzing crystal and a bending radius = 110 m. The corresponding calculated scans are shown in Fig. 6 (c) and (d). The line widthes are narrower and more intense. However, this fact must not be overrated since a number of line broadening effects have been disregarded as, e.g., the beam spot size, tungsten- and analyzer-crystal irregularities, etc. In addition, also the width of the aperture in front of the Ge(i) detector has an uncertainty which originates from misalignments of a 50 mm long lead aperture with a bore of 8 mm diameter by an angle of about 4∘.
This possible explanation prompted us to carry out experiments with a silicon single crystal with a length of 100 mm, a height of 50 mm and a thickness of 10 mm which was assumed to be really plane. The experimental setup was a little modified. The distances between W target-analyzer-detector were symmetrized and selected as m. A vertical slit aperture of 0.2 mm width was positioned just in front of the Si analyzer crystal. This aperture could horizontally be moved during the course of the experiment enabling us to investigate a possible local bending radius change over the crystal. In addition, the slit aperture in front of the Ge(i) detector was reduced to a width of 1 mm and the detector assembly was made moveable in direction. With this setup we found a quite strange behavior which we interpreted as rapidly changing wavy structures of the (111) lattice planes across the length of the Si crystal resembling somehow a mosaic structure. As a result, further experiments with this ”plane” crystal were abandoned.
Finally, we performed experiments with a third crystal again with a length of 150 mm, a height 40 mm and a thickness of 1 mm. The crystal was clamped on one of the shorter edges and could be distorted with a moveable pin which touched the crystal at the opposite side. This way the bending radius could be changed, though not homogeneously over the whole crystal since the crystal had not a triangular shape. All other experimental conditions were chosen as described above. In a first step of the experiment a scan was taken of the relaxed crystal. The result is shown in Fig. 8 (a). The corresponding calculation of Fig. 8 (d) indicates that also this crystal has a residual concave bending with a radius m. In a second step of the experiment the focus was searched for by changing systematically the bending radius and observing the TR intensity as function of the detector position . After the maximum was found a scan of the W-target crystal in positive orientation was carried out. The result is shown in Fig. 8 (b). The width of the FDPXR structure of 0.96 mrad matches well with the projection of the Si-analyzer crystal length = 150 mm on the axis. The corresponding accepted angle is /a = 0.97 mrad. (Notice, that in Eq. (5) which describes the energy of the FDPXR peak and - appear symmetrically.) Most remarkable is the double peak structure. Two additional scans of the aperture in front of the Si crystal for fixed values, chosen in the maxima of both peaks, revealed that they are correlated to two distinct regions, each of about 0.13 mrad width and separated by 0.39 mrad. This finding suggests that the 1 mm aperture in front of the detector was not wide enough to accept all rays reflected by the Si analyzer crystal. Obviously rays from certain regions are excluded from detection by the aperture. This conjecture was corroborated with calculations on the basis of our FDPXR model.


|
In the model calculations we adjusted the reciprocal lattice vector and the surface normal to = (0.997588, -0.00872654, -0.0688609) and = (0.0685897, -0.0400394, 0.996841), respectively, in order to take into account the experimental shift of the FDPXR peak from 3.977∘ to . The results of the calculations are shown in Fig. 8 (d), (e), and (f). In panel (e), for which a bending radius = 150 m was assumed, all of the radiation impinging on the Si crystal is focused into the 1 mm slit aperture and the FDPXR structure turns out to be rather flat. However, if an additional deformation is superimposed on the circular bending of the crystal, e.g. a sinusoidal shape with a period of the crystal length of 150 mm and an amplitude of only 1 m, a dip in the middle can be produced which resembles the dip in the measurement shown in panel (b).
A peculiar situation occurs if the bending radius of the Si analyzer crystal is chosen such that the slope of FDPXR and the analyzer energy characteristics are just the same, see Figs. 3 and 7 for illustration. This happens for bending radii = 535.52 m and 90.17 m for the positive and negative orientation of the W single crystal, respectively. For these magic radii the complete FDPXR spectrum will be focused on a single spot which is located for our symmetrical geometry according to the image equation , with the focal length , at distances of = -18.01 m and = 3.15 m from the Si analyzer crystal, i.e. the former is a virtual the latter a real focus. If the above condition is fulfilled the intensity originating from normal TR will be enhanced by the FDPXR contribution within an angular tuning range of the target crystal in the order of = 10 rad, see Fig. 2, which now must be convoluted with the reflecting power ratio of the analyzer crystal , Eq. (19). Since the analyzer crystal has never the ideal structure as mathematically assumed, on this basis a method could be developed to diagnose the surface bending radii of large area single crystals. In order to get familiar with the properties of the FDPXR radiation which is diffracted by the Si analyzer crystal we decreased the bending radius. An example is shown in Fig. 8 (c). As shown in panel (f) of this Figure 8 the experimental result is in accord with the assumption of a bending radius of minus 300 m, i.e. the crystal was bent from the concave into a convex shape. Alternatively, it could also be that a piece of the crystal acted as monochromator which had intrinsically a concave shape. Unfortunately, the beam-time allocated for the experiment was exhausted after this scan was taken and a search for the magic bending radii could not be carried out anymore.
5 Conclusions and Outlook
Clear forward diffracted PXR structures have been observed for a 410 m thick tungsten single crystal which was irradiated with the 855 MeV electron beam of the Mainz Microtron MAMI. For design and interpretation of the experiments the results of a dynamical formalism developed in Mainz, which predicts FDPXR from a semi-infinite crystal quite accurately and from crystal slabs approximately, were of crucial importance. From a comparison of the model predictions and the experimental results it can safely be concluded that PXR production is a dynamical rather than a kinematical process. The experimental procedure may be developed further to diagnose local crystal bending radii as large as 1 km of large area crystals.
An interesting question is whether TR from the entrance interface of the crystal may penetrate the 410 m thick crystal. The absorption length at a photon energy of 40 keV for amorphous tungsten amounts to 53.4 m [33] and only a fraction of of the radiation should transmit the crystal. However, the transmission may be much larger in a single crystal close to a resonance where the absorption length may be anomalously large [36]. In a next step, the (333) reflection of tungsten will be analyzed, which has been measured simultaneously with the (333) reflection of the Si-analyzer crystal. At a photon energy of 120 keV the absorption length amounts to 204.3 m [33] and a large fraction of 13.4 % of TR from the entrance interface transmits the crystal which superimposes with TR and FDPXR produced at the exit interface.
Acknowledgements.
We gratefully acknowledge support of M. Tabrizi and T. Weber during the course of the experiment. View graphs in the Mathematica 5.1 environment were generated with the LevelScheme figure preparation system of Ref. [35] version 3.21 (October 23, 2005). This work has been supported by Deutsche Forschungsgemeinschaft DFG under contract BA 1336/1-4.References
- [1] V.L. Ginsburg, I.M. Franck, J. Phys. (Moscow) IX, p. 353, 1945.
- [2] G.M. Garibian, “Contribution to the theory of transition radiation”, Zh. Exper. Teor. Fiz. 33 1403-1410, 1957; Sov. Phys. JETP 6, p. 1079-1085, 1958.
- [3] G.M. Garibian, “Radiation of a particle moving across the interface of two media with account of multiple scattering”, Zh. Exper. Teor. Fiz. 39 332-336, 1960; Sov. Phys. JETP 12, p. 237-239, 1961.
- [4] A. Caticha, “Transition-diffracted radiation and the Cerenkov emission of x rays”, Phys. Rev. A 40, p. 4322-4329, 1989.
- [5] M. Ter-Mikaelian, High-Energy Electromagnetic Processes in Condensed Media, Wiley-Interscience, New York, London, Sydney, Toronto, 1972.
- [6] V.G. Baryshevsky, Doklady Akad. Nauk BSSR 15 p. 306, 1971.
- [7] V.G. Baryshevsky and I.D. Feranchuk,“Transition radiation of rays in a crystal”, Zh. Exper. Teor. Fiz. 61 944-948, 1971; (Sov. Phys. JETP 34, p. 502-504, 1972; addendum, ibid 64, p. 760, 1973).
- [8] G.M. Garibian and C.Yang, “Quantum microscopic theory of radiation by charged particle moving uniformly in a crystal”, Zh. Eksp. Teor. Fiz. 61, p. 930-943, 1971, (Sov. Phys. JETP 34, p.495-501, 1972).
- [9] G.M. Garibian and C.Yang, “Lateral spots of X-ray transition radiation in crystals and their effect on the central spot”, Zh. Eksp. Teor. Fiz. 63, p. 1198-1211, 1972, (Sov. Phys. JETP 36, p. 631-637, 1973).
- [10] G.M. Garibian and C. Yang,“Quasi-Cherenkov radiation in crystals”, Nucl. Inst. Meth. A 248, p. 29-30, 1986.
- [11] H. Nitta, “Kinematical Theory of parametric X-ray radiation”, Phys. Lett. A 158, p. 270-274, 1991.
- [12] H. Nitta, “Theory of coherent X-ray radiation by relativistic particles in a single crystal”, Phys. Rev. B 45, p. 7621-7626, 1992.
- [13] J. Freudenberger, V.B. Gavrikov, M. Galemann, H. Genz, L. Groening, V.L. Morokhovskii, V.V. Morokhovskii, U. Nething, A. Richter, J.P.F. Sellschop, N.F. Shulga, “Parametric x-ray radiation observed in diamond at low electron energies”, Phys. Rev. Lett. 74, p. 2487-2490, 1995.
- [14] A. Caticha, “Quantum theory of the dynamical Cerenkov emission of x rays”, Phys. Rev. B 45, p. 9541-9550, 1992.
- [15] X. Artru, P. Rullhusen,“Parametric X-rays and diffracted transition radiation in perfect and mosaic crystals”, Nucl. Instr. Meth. in Phys. Res. B 145, p. 1-7, 1998; addendum, ibid B 173, p. 16, 2001.
- [16] K.-H. Brenzinger, C. Herberg, B. Limburg, H. Backe, S. Dambach, H. Euteneuer, F. Hagenbuck, H. Hartmann, K. Johann, K.H. Kaiser, O. Kettig, G. Knies, G. Kube, W. Lauth, H. Schöpe, Th. Walcher, “Investigation of the production mechanism if parametric X-ray radiation”, Z. Phys. A 358, p. 107-114, 1997.
- [17] J. Freudenberger, H. Genz, V.V. Morokhovskii, A. Richter, V.L. Morokhovskii, U. Nething, R. Zahn, J.P.F. Sellschop, “Lineshape, linewidth and spectral density of parametric x-radiation at low electron energy in diamond”, Appl. Phys. Lett. 70, p. 267-269, 1997.
- [18] K.-H. Brenzinger, B. Limburg, H. Backe, S. Dambach, H. Euteneuer, F. Hagenbuck, C. Herberg, K.H. Kaiser, O. Kettig, G. Kube, W. Lauth, H. Schöpe, Th. Walcher, “How narrow is the linewidth of parametric X-ray radiation?”, Phys. Rev. Lett. 79, p. 2462-2465, 1997.
- [19] V.V. Morokhovskii, K.H. Schmitt, G. Buschhorn, J. Freudenberger, H. Genz, R. Kotthaus, A. Richter, M. Rzepka, P.M. Weinmann, “Polarization of parametric X radiation”, Phys. Rev. Lett. 79, p. 4389-4392, 1997.
- [20] J. Freudenberger, H. Genz, V.V. Morokhovskii, A. Richter, J.P.F. Sellschop, “Parametric X rays observed under Bragg condition: Boost of intensity by a factor of two”, Phys. Rev. Lett. 84, p. 270-273, 2000.
- [21] H. Nitta,“Dynamical effect on parametric X-ray radiation”, Journ. Phys. Soc. Japan 69, p. 3462-3465, 2000.
- [22] V.G. Baryshevsky, “Parametric X-ray radiation at a small angle near the velocity direction of the relativistic particle”, Nucl. Instr. Meth. in Phys. Res. B 122, p. 13-18, 1997.
- [23] A. Kubankin, N. Nasonov, V. Sergienko, I. Vnukov, “An investigation of the parametric X-rays along the velocity of emitting particle”, Nucl. Instr. Meth. in Phys. Res., B 201, p. 97-113, 2003.
- [24] N. Nasonov, N. Noskov, “On the parametric X-rays along an emitting particle velocity”, Nucl. Instr. Meth. in Phys. Res. B201, p. 67-77, 2003.
- [25] L.C.L. Yuan, P.W. Alley, A. Bamberger, G.F. Dell, H. Uto,“A search for dynamic radiation from crystals”, Nucl. Instr. Meth. in Phys. Res. A 234, p. 426-429, 1985.
- [26] B.N. Kalinin, G.A. Naumenko, D.V. Padalko, A.P. Potylitsin, I.E. Vnukov,“Experimental search of parametric X-ray radiation in a silicon crystal at a small angle near the velocity direction of relativistic electrons”, Nucl. Instr. Meth. in Phys. Res. B 173, p. 253-261, 2001.
- [27] H. Backe, V.G. Baryshevsky, Th. Doerk, Th. Kerschner, H. Koch, G. Kube, W. Lauth, H. Matthäy, M. Schüttrumpf, A. Wilms, M. Zemter, unpublished.
- [28] Th. Kerschner, Entwicklung und Aufbau eines pn-CCD-Systems zum Einzelphotonnachweis im Bereich weicher Röntgenstrahlung, Dissertation am Institut für Experimentalphysik I der Ruhr-Universität Bochum, Bochum, 1998.
- [29] H. Backe, C.Ay, N. Clawiter, Th. Doerk, M. El-Ghazaly, K.-H. Kayser, O. Kettig, G. Kube, F. Hagenbuck, W. Lauth, A. Rueda, A. Scharafutdinov, D. Schroff, T. Weber in: W Greiner, A.Solov’yov and S. Misicu (Eds.),“Diffracted transition radiation and parametric X radiation from silicon single crystal slabs”, Proc. Symp. Channeling - Bent Crystals - Radiation Processes, Frankfurt (Germany) 2003, EP Systema, Debrecen, p. 41-58, 2003.
- [30] N. Aleinik, A.N. Baldin, E.A. Bogomazova, I.E. Vnukov, B.N. Kalinin, A.S. Kubankin, N.N. Nasonov,G.A. Naumenko, A.P. Potylitsin, A.F. Scharafutdinov, “Experimental Observation of Parametric X-Ray Radiation Directed Along the Propagation Direction Velocity of Relativistic Electrons in a Tungsten Crystal,”JETP Lett. 80, pp. 393-397, 2004 (Zh. Exper. Teor. Fiz. 80, pp. 447-451, 2004).
- [31] H. Backe, A. Rueda, W. Lauth, N. Clawiter, M. El-Ghazaly, P. Kunz, T. Weber, “Forward Diffracted Parametric X Radiation from a Silicon Single Crystal,” Nucl. Instr. Meth. in Phys. Res. B 234, p. 138-147, 2005.
- [32] H. Backe, W. Lauth, A. Rueda et al., to be published.
- [33] O.M. Lugoskaya, and S.A. Stephanov, “Calculation of the polarizabilities of crystals for diffraction of x-rays of the continuous spectrum at wavelengths of 0.1-10 ”, Sov. Phys. Crystallogr. 36, p. 478-481, 1991, and http://sergey.gmca.aps.anl.gov/cgi/X0h.html
- [34] G.R. Lynch and O.I. Dahl, “Approximations to multiple Coulomb scattering”, Nucl. Instr. Meth. in Phys. Res. B 58, p. 6-10, 1991
- [35] M.A. Capiro,“LevelScheme: A level scheme drawing and scientific figure preparation system for Matematica”, Comput. Phys. Commun. 171, p. 107-118, 2005. http://wnsl.physics.yale.edu/levelscheme/
- [36] N. Imanishi, N. Nasonov, K. Yajima, “Dynamical diffraction effects in the transition radiation of a relativistic electron crossing a thin crystal”, Nucl. Instr. Meth. in Phys. Res. B 173, p. 227-237, 2001.