Critical parameters for the partial coalescence of a droplet
Abstract
The partial coalescence of a droplet onto a planar liquid/liquid interface is investigated experimentally by tuning the viscosities of both liquids. The problem mainly depends on four dimensionless parameters: the Bond number (gravity vs. surface tension), the Ohnesorge numbers (viscosity in both fluids vs. surface tension), and the density relative difference. The ratio between the daughter droplet size and the mother droplet size is investigated as a function of these dimensionless numbers. Global quantities such as the available surface energy of the droplet has been measured during the coalescence. The capillary waves propagation and damping are studied in detail. The relation between these waves and the partial coalescence is discussed. Additional viscous mechanisms are proposed in order to explain the asymmetric role played by both viscosities.
pacs:
47.55.df, 47.55.D-, 47.55.dbI Introduction
Liquid droplets are more and more studied in the framework of microfluidic applications. Indeed, they allow to manipulate and transport very small quantities of liquids. Droplets coalescence is probably the most convenient way to mix liquids in microdevices without any power supply M. Wu et al. (2004); H.A. Stone et al. (2004). Both control and reproducibility of the droplet sizes are therefore very important. For instance, one of the main difficulties encountered is to obtain a single small droplet, with a typical size lower than 100 . Such a challenge is also present when dealing with the petrol injection in car motors. The smaller the droplets are, the more efficient the combustion is Thoroddsen (2006). The partial coalescence is a suitable way to achieve such a goal since it progressively empties a droplet N. Vandewalle et al. (2006).
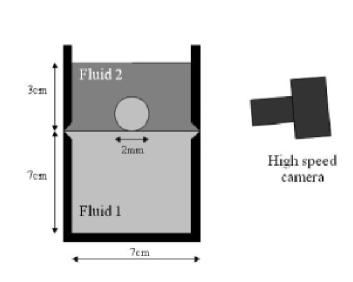
In order to investigate partial coalescence, Charles and Mason G.E. Charles and S.G. Mason (1960) have studied a system composed by two immiscible fluids 1 and 2 of different densities (fluid 1 is heavier than fluid 2). This experiment is schematically represented in Fig.1. A thick layer of the lighter fluid 2 is placed over the bulk of fluid 1. A millimetric droplet of fluid 1 is then dropped over the system. It crosses the fluid 2 layer and stays on the interface between fluid 1 and fluid 2 for a while depending on the viscosities. Suddenly, the droplet coalesces. In given conditions that will be discussed, the droplet experiences a partial coalescence. A smaller droplet remains above the 1,2 interface. The process may occur several times, like a cascade: it is possible to get as much as six partial coalescences before the final total one N. Vandewalle et al. (2006). Note that this experiment is totally equivalent to a droplet of fluid 1 (lighter than fluid 2) coming up through fluid 2, when apparent gravity (gravity + buoyancy forces) is considered.
Charles and Mason attempted to explain the occurrence of partial coalescence by considering the ratio of dynamical viscosities in both fluids. But this only parameter is not sufficient to fully understand partial coalescence mechanisms. This experiment was studied in 1993 by Leblanc Leblanc (1993). He was interested in the stability of emulsions. Indeed, partial coalescence considerably slows down the gravity-driven phase separation of two immiscible liquids, for instance when dealing with petrol demulsification. Leblanc identified every important parameters for a partial coalescence prediction, but his work remained unpublished. In 2000, Thoroddsen and Takehara S.T. Thoroddsen and K. Takehara (2000) studied this phenomenon in more details for an air/water interface. Same conclusions as Leblanc emerged concerning the impact of viscosity on the flow. In the same time, partial coalescence with a surfactant addition was described by Pikhitsa and Tsargorodskaya P. Pikhitsa and A. Tsargorodskaya (2000). More recently, in 2006, Blanchette and Bigioni F. Blanchette and T.P. Bigioni (2006) have explained the mechanism of pinch-off in partial coalescence by using a subtle combination of both experimental and numerical techniques. The convergence of capillary waves on the top of the droplet seemed to have a crucial importance on the coalescence outcome. Several other studies have been made about partial coalescence in 2006: Honey and Kavehpour E.M. Honey and H.P. Kavehpour (2006) have considered the bouncing height of the daughter droplet. Aryafar and Kavehpour H. Aryafar and H.P. Kavehpour (2006) have focused on the time scales of the partial coalescence. Chen, Mandre, and Feng X. Chen et al. (2006a) attempted to model these time scales, as well as the ratio between the daughter and the mother droplets. They recently extended their study to polymeric liquids X. Chen et al. (2006b).
Little is known about microflows occurring during the coalescence process. First, traditional experimental techniques are difficult to be applied at droplet scale. However, PIV experiments on droplet coalescence were made by Mohamed-Kassim and Longmire Z. Mohamed-Kassim and E.K. Longmire (2004). Unfortunately, the droplet was too large to allow partial coalescence. The simplest way to get experimental information about microflows is to observe the interface position, as in S.T. Thoroddsen et al. (2005) for instance. On a numerical point of view, free surface flows with changing topology (such as coalescence, break-down, and pinch-off) are really difficult and expensive to compute. Despite these difficulties, a lot of information have already been collected about microflows in a coalescence process.
The present paper consists in an experimental study made over many coalescence events, with various initial droplet sizes, viscosities, and densities of both fluids. Two main aspects are investigated: the ratio between the daughter and the mother droplets and the role of capillary waves on partial coalescence criteria. Moreover, using image processing, global variables such as the available potential surface energy are recorded during the coalescence process. Their evolution with time raise new questions and new challenges. The relation between capillary waves and partial coalescence is discussed. In appendix, the number of successive partial coalescences is theoretically computed for different pairs of fluids.
II Experimental setup
Our experimental setup consists in a glass vessel which is opened at the top. This container is half filled with the fluid 1. A centimetric layer of fluid 2 is then gently poured over the fluid 1 (see schematic view in Fig.1). A horizontal guide groove is dug in the vertical borders of the container in order to reduce the meniscus at the oil/water interface (and in order to get a quasi-planar interface), as interface curvature is known to modify the drainage time. Moreover, according to Blanchette F. Blanchette and T.P. Bigioni (2006), it can also influence the result of partial coalescence. A syringe is used to create a small droplet of fluid 1, colored by methylene blue for visualization purpose. By changing the needle diameter, the initial droplet radius can be changed. Between each experiment, the setup is washed with acetone to avoid interface contamination.
The cascade of partial coalescences is studied using a set of different silicon oils for the fluid 2 (Trimethylsilyl terminated polydimethylsiloxane, under the tradename Dow Corning 200 fluid). Their kinematic viscosity can be easily tuned from =0.65 to 100 cSt. Mixtures are made in order to obtain intermediate viscosities. The fluid 1 is made of a mixture of water and alcohol (glycerol or ethanol). The kinematic viscosity may be modified by the alcool/water ratio. Densities are also changed (see Table 1). The interfacial tension is measured by the pendant drop method. It is approximately 45 mN/m for any oil/water interfaces (a 5mN/m error is considered for each error bar). It is roughly 40mN/m when dealing with a glycerol/water mixture. The addition of ethanol greatly decreases the interfacial tension. It is approximately 25mN/m for 10%-ethanol, 19mN/m for 20%-ethanol, 13mN/m for 30%-ethanol, and 9mN/m for 40%-ethanol. We have explored the different regimes of partial and total coalescence.
| Liquid | ||
|---|---|---|
| W | ||
| 87.5%W + 12.5%G | ||
| 75%W + 25%G | ||
| 62.5%W + 37.5%G | ||
| 50%W + 50%G | ||
| 25%W + 75%G | ||
| 90%W + 10%E | ||
| 80%W + 20%E | ||
| 70%W + 30%E | ||
| 60%W + 40%E | ||
| DC-0.65cSt | ||
| DC-1.5cSt | ||
| DC-5cSt | ||
| DC-10cSt | ||
| DC-50cSt | ||
| DC-100cSt | ||
| 80%DC-10cSt + 20%DC-100cSt | ||
| 60%DC-10cSt + 40%DC-100cSt | ||
| 40%DC-10cSt + 60%DC-100cSt | ||
| 20%DC-10cSt + 80%DC-100cSt |
In order to ensure that no significant microflows are present at the beginning of the coalescence process, the experiments for which the film drainage time is less than one second are rejected. The vessel is big enough to avoid parasite reflections of capillary waves on the walls during the coalescence.
A fast video recorder (Redlake Motion Pro) is placed near the surface. A slight tilt (less than 10°) is needed to see the bottom of the droplet, since the interface is curved by the weight of the droplet. Movies of the coalescence have been recorded up to 2000 frames per second. Since the partial coalescence, scaled on the capillary time, is about 10 ms, a whole coalescence process is usually captured by about 20 images. The pixel size is about 30 . In normal conditions, a millimetric droplet is represented by about 30 pixels. About 150 coalescence events have been recorded. The droplet/camera distance is constant. Distances on the picture are measured with a relative error less than 5%. Since this error on distances is constant during a single coalescence experiment, ratios of distances are characterized by an error significantly smaller than forecasted.
Initial and final horizontal radii are measured for every experiment. In order to get information about the partial coalescence process, the whole interface is tracked on each snapshot for each experiments. Of course, we suppose that the interface (and even the whole flow) is axisymmetric. It is then possible to estimate global measurements such as the volume above the interface or the surface potential energy. An original, highly robust, and threshold-less interface detection method has been developed. Note that the reflected light can be detected as a part of the interface, generating high discontinuities in interface shape. These discontinuities are detected and deleted in the post-processing.
III Dimensional analysis
Once the thin film of fluid 2 below the droplet is broken, the dynamics of partial coalescence is macroscopically governed by only three kinds of forces: interfacial tension, gravity, and viscosity forces in both fluids. There are seven macroscopic parameters: surface tension , densities and , kinematic viscosities and , gravity acceleration , and the initial droplet radius .
As Dooley et al. B.S. Dooley et al. (1997) or Thoroddsen and Takehara S.T. Thoroddsen and K. Takehara (2000) have shown, the partial coalescence process is usually scaled by the capillary time. This time is the result of the balance between interfacial tension and inertia. It is given by
| (1) |
where is defined as the mean density . Therefore, the interfacial tension has to be the main force for partial coalescence to occur. In other words, a self-similar process is only possible when one force is dominant (the surface tension). That means that there is no natural length scale related to the balance of two forces.
According to the theorem (Vaschy-Buckingham), it is possible to build only four independent dimensionless numbers. Three of them are derived from the ratio of the characteristic time scales of the different forces with the capillary time. The gravity time is given by
| (2) |
( is the apparent gravity experienced by the droplet), and the viscosity times by
| (3) |
The Bond number is the square of the ratio between the capillary time and the gravity time
| (4) |
The Ohnesorge numbers are the ratio between the capillary time and the viscous times in both fluids
| (5) |
The last dimensionless number can be the relative difference of density
| (6) |
Ideally, any dimensionless quantity can be expressed as a function of these four parameters, especially the ratio between the daughter droplet radius and the mother droplet radius
| (7) |
For large droplets, gravity is known to be as important as surface tension. Therefore, gravity significantly accelerates the emptying of the mother droplet Leblanc (1993); F. Blanchette and T.P. Bigioni (2006). Moreover, it flattens the initial droplet. The ratio is monotonically decreasing with , and it suggests that a critical Bond number should exist for which for : coalescence becomes total.
As shown by Blanchette and Bigioni F. Blanchette and T.P. Bigioni (2006), the partial coalescence process is mainly due to the convergence of capillary waves at the top of the droplet. These waves are generated at the beginning of the coalescence, by the receding interface below the droplet. The viscosity forces in both fluids, mainly present for smallest droplets, damp these capillary waves and inhibit the partial coalescence Leblanc (1993); S.T. Thoroddsen and K. Takehara (2000); F. Blanchette and T.P. Bigioni (2006). The ratio also monotonically decreases with both increasing Ohnesorge numbers. Critical Ohnesorges numbers and may be defined; beyond which coalescence becomes total.
On the other hand, when the Bond (resp. Ohnesorge) number is much smaller than the critical Bond (resp. Ohnesorge) number, gravity (resp. viscosity) can be considered as negligible. The function does not depend on (resp. ) anymore. For droplets with negligible Bond and Ohnesorge numbers, becomes a function that only depends on , the relative difference of inertial effects generated by the interfacial tension in both fluids. In these conditions, the process is self-similar since the densities do not change between two successive partial coalescences.
The previous dimensional analysis is correct when the droplet is at rest at the beginning of the coalescence. The radius is the only key parameter to describe the droplet. Such an hypothesis is true when microflows due to the previous droplet fall are damped out. The timescale of these flows can be roughly estimated as the time needed for the thin film of fluid 2 to be drained out. When this time is much larger than the capillary time, the initial microflows can be considered as negligible compared to the microflows generated by the coalescence process. As already mentionned, this condition has been checked for each experiment of coalescence. Obviously, the film drainage time is shorter for a droplet surrounded by a gaz than for a droplet surrounded by a liquid. Therefore, it is easier to work with a liquid/liquid interface as evidenced by Mohammed-Kassim and Longmire Z. Mohamed-Kassim and E.K. Longmire (2004).
IV Results
IV.1 Qualitative description
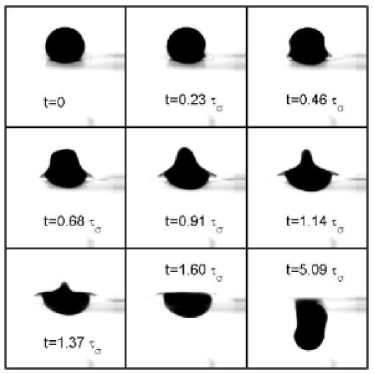
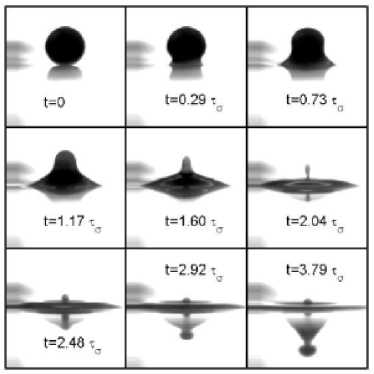
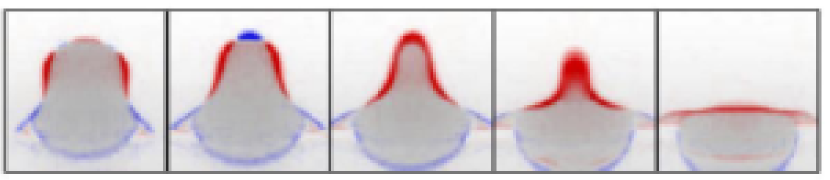
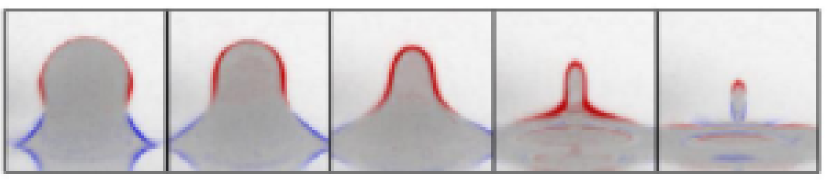
The different stages of a coalescence are shown on the snapshots of Fig. 2. Four experiments are presented. They have been chosen to evidence the influence of Ohnesorge numbers on the coalescence.
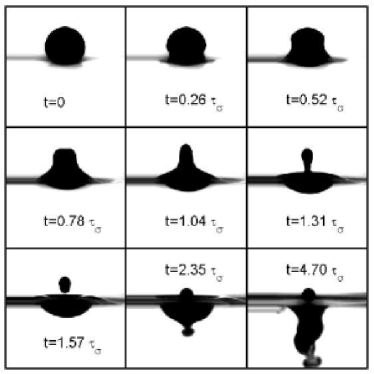
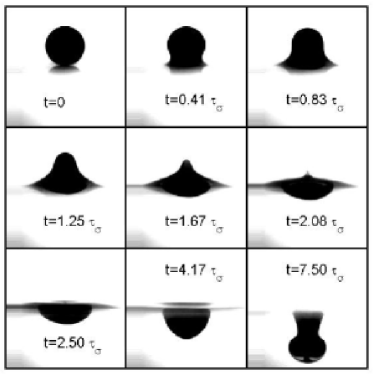
The first experiment (Fig. 2(a)) corresponds to a quasi self-similar partial coalescence, where the Bond number has a slight influence on the result, while the Ohnesorge numbers are negligible.
The film rupture usually occurs where the film is the thinnest. This latter is off-center, as it was shown experimentally by Hartland Hartland (1967) and theoretically by Jones and Wilson A.F. Jones and S.D.R. Wilson (1978). This off-centering effect is mainly due to the presence of a surrounding fluid, which generates an overpressure at the center while it is drained outward.
When the film is broken, it quickly opens due to high pressure gradients created by surface tension near the hole. Thoroddsen et al. S.T. Thoroddsen et al. (2005) have mentioned that for water droplets surrounded by air, the hole opening is dominated by inertia instead of viscosity. In this case, Eggers et al. J. Eggers et al. (1999) have proposed the following scaling law for the hole radius
| (8) |
This law is based on a balance between inertia and surface tension; the biggest curvature is given by . It is possible to rewrite this equation with the capillary time
| (9) |
Measurements of Menchaca et al. A. Menchaca-Rocha et al. (2001), Wu et al. M. Wu et al. (2004), and Thoroddsen et al. S.T. Thoroddsen et al. (2005) confirm this scaling. When the surrounding fluid is viscous oil instead of air, one can expect that viscosity effects are as much important as inertia effects, and the mentioned scaling can become obsolete.
During the retraction, a part of the bulk phase of fluid 1 comes up into the droplet, as shown by Brown and Hanson C. Hanson and A.H. Brown (1967). They observed a slightly colored daughter droplet when using a colorless mother droplet on a colored bath. This upward movement is depicted in B.S. Dooley et al. (1997).
Next, the emptying droplet takes a column shape, and then experiences a pinch-off that leads to the formation of the daughter droplet. Charles and Mason G.E. Charles and S.G. Mason (1960) have suggested this pinch-off was due to a Rayleigh-Plateau instability. Recently, Blanchette and Bigioni F. Blanchette and T.P. Bigioni (2006) have shown that this hypothesis was wrong. They have solved Navier-Stokes equations for a coalescing water droplet surrounded by air. When the top of the droplet reaches its maximum height, they stop the numerical simulation, set velocities and pressure perturbations to zero, and restart the computation. The coalescence, normally partial, was observed to be total with this flow reset. The pinch-off cannot be due to a Rayleigh-Plateau instability.
Leblanc Leblanc (1993), Thoroddsen et al. S.T. Thoroddsen and K. Takehara (2000), and Mohamed-Kassim et al. Z. Mohamed-Kassim and E.K. Longmire (2004) have already noted the existence of capillary waves generated at the bottom of the droplet after the film break-down. A part of these waves propagates far away, on the planar interface. The other part climbs over the droplet and converges at the top. According to Blanchette F. Blanchette and T.P. Bigioni (2006), such a convergence greatly deforms the droplet and delays its coalescence, the horizontal collapse (the pinch-off) can occur before the emptying. Gravity balances this delay by accelerating the emptying of the droplet. In other words, too much gravity effects lead to a total coalescence. Viscosities of both fluids damp the capillary waves, the convergence effect is reduced, and coalescence can also become total (Fig. 2(b) and 2(d)). The precise role played by viscosities in the capillary waves damping will be detailed in this paper.
The time at which the pinch-off occurs vary with the Bond and the Ohnesorge numbers. It is usually between 1.4 and 2 . After the pinch-off, the fluid below the droplet is ejected downward, due to the high remaining pressure gradients. This creates a powerful vortex ring that go down through the fluid 1 (Fig. 2(a) and 2(c)). Such a vortex is well described in A.V. Anilkumar et al. (1991), P.N. Shankar and M. Kumar (1995) and R.W. Cresswell and B.R. Morton (1995). Since this vortex is formed when the partial coalescence is finished, it cannot have any influence on the coalescence outcome.
IV.2 The law
In this section, the ratio between the daughter droplet radius and the mother droplet radius (the function) is investigated.
IV.2.1 Asymptotic regime
Thanks to the dimensional analysis, we have shown that for negligible , , and (surface tension is the only dominant force), only depends on the density relative difference. Experimental results show that one has
| (10) |
In our experiments, the relative difference in density is always less than 20%, and no relevant correlation between and has been underlined. Maybe the influence of the density relative difference is higher for a liquid/gaz interface.
IV.2.2 Influence of the Bond number
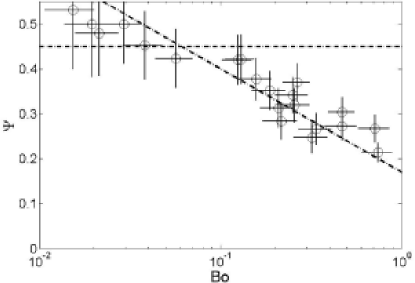
Figure 3 shows the observed influence of the Bond number on , when the Ohnesorge numbers are negligible (i.e. ). For small Bond numbers, the asymptotic regime is obtained. As noted in the dimensional analysis, an increase of the Bond number results in a decrease of . A cross over is observed at . According to our data, we cannot assess about the existence of any critical Bond number for which becomes zero. Mohamed-Kassim and Longmire Z. Mohamed-Kassim and E.K. Longmire (2004) have reported total coalescences for Bond numbers equal to 10. However, both Ohnesorge numbers were greater than 0.01, and viscosity played a significant part on the outcome of these coalescences.
IV.2.3 Influence of the Ohnesorge numbers
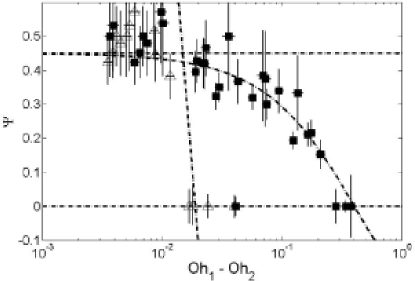
In Fig.4, the dependence of on Ohnesorge numbers is plotted: Triangles correspond to , and black squares to . For the (resp. ) curve, the selected data points correspond to and (resp. ). Viscous dissipation in fluid 2 leads to a smooth decreasing of with , starting from the asymptotic regime . The critical Ohnesorge for partial coalescence is about . Leblanc Leblanc (1993) have observed , which is in accordance with our results. The behavior of with increasing is totally different: the decrease of the ratio is very sharp. It immediately vanishes to zero when . This critical value was already obtained by Blanchette F. Blanchette and T.P. Bigioni (2006) (a factor is needed to have the same definition of the Ohnesorge number), and thirteen years ago by Leblanc Leblanc (1993) (who found 0.024). In the capillary waves scenario F. Blanchette and T.P. Bigioni (2006), the roles of both viscosities should be the same. The difference between their influences is then amazing and will be discussed later.
IV.2.4 Conjugated influences
In the previous sections, the law has been investigated by varying a single parameter, both others being negligible. Here, two parameters over three are varied, and the third one is taken negligible.
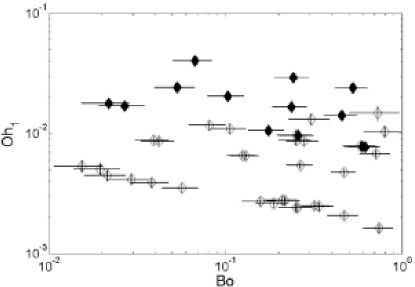
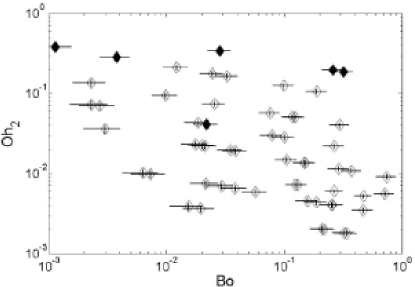
The conjugated influence of viscosities is shown in Fig. 5. While the boundary between partial and total coalescences is unambiguous for large and intermediate , it is quite fuzzy for large . It seems that, considering for example , the coalescence is total for small (as seen in the previous section). Then, it can be partial for around 0.02, and it becomes total again for greater values of . This unexpected outgrowth of the partial coalescence regime roughly corresponds to the straight line .
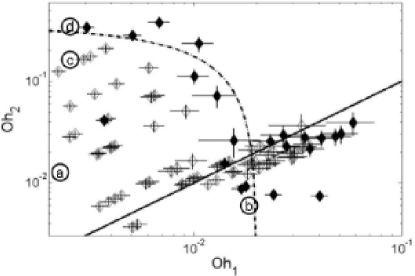
In order to take both viscosities into account, Leblanc Leblanc (1993) suggested that the critical parameter for partial coalescence occurrence is a linear combination of both Ohnesorge numbers. Partial coalescence takes place when
| (11) |
This law is compared to experimental results in Fig. 5. The law captures the general trend of the partial-to-total transition, but fails in describing the large part of the diagram.
IV.3 The global variables evolution
In order to get more information about the partial coalescence process, we have measured global quantities associated to the detected interface on each experimental image: the volume of fluid 1 above the mean interface level and the available surface potential energy (as in S.T. Thoroddsen et al. (2005)).
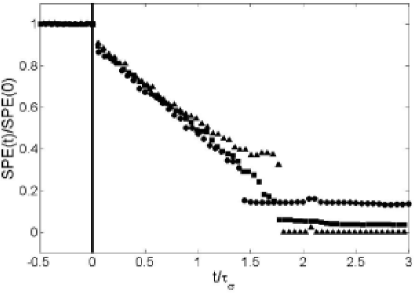
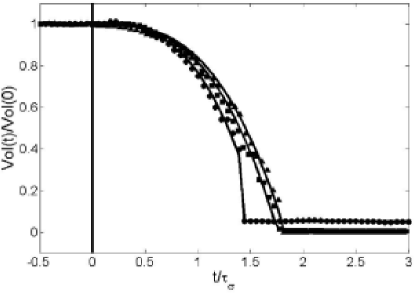
The available surface energy (resp. the volume of the droplet above the mean interface level), normalized by its initial value, is plotted as a function of time in Fig.7(a) (resp. in Fig.7(b)). Results of three experiments with different surrounding viscosities are presented: a partial coalescence (), an attenuated partial coalescence (), and a total coalescence (). The Bond and the Ohnesorge 1 are negligible for the three experiments.
Figure 7(a) and 7(b) show that the volume and the surface energy decreases are roughly independent of the coalescence issue.
During the main part of the coalescence process, the surface decrease is remarkably linear. Therefore, we can assess that surface potential energy is converted into kinetic energy at a constant rate 111The gravitational energy is negligible since the Bond number is smaller than unity. This rate does not seem to depend on , and corresponds to a 40%-decrease in surface energy during the capillary time. Such a linear decrease in surface energy was already observed when dealing with the initial hole opening, as seen previously.
The droplet starts to significantly empty at approximately . As seen in Fig. 7(b), it is possible to correctly fit data by the following empirical law
| (12) |
According to the fitting, the coefficient is approximately 0.2, and experiences a slight increase with . Indeed, in Fig.7(b), the Bond number is higher for the partial coalescence experiment than for the total one. Therefore, gravity enhances the droplet emptying. The flow rate through the mean interface level can be deduced by differentiate Eq.(12)
| (13) |
IV.4 Capillary waves
As shown by Blanchette F. Blanchette and T.P. Bigioni (2006), capillary waves that travel along the droplet are thought to be responsible for the delay in the vertical collapse. Since this delay allows the pinch-off process to occur on time (i.e. before the complete emptying), capillary waves have an important influence on the function. This section attempts to answer which modes make the convergence possible, and how they are damped by viscosity.
IV.4.1 Wave propagation
Considering axisymmetric perturbations of an ideal, irrotationnal, and incompressible droplet of radius , it is possible to find the dispersion relationship of potential capillary waves on a spherical interface 222A similar development is made in the Fluid Mechanics course of Landau and Lifchitz L. Landau and E. Lifchitz (1959).
| (14) |
where is the capillary time and is the pulsation of mode .
The interface is given by
| (15) |
where is the perturbation amplitude component associated to , the Legendre polynomial of degree .
Assuming relatively small wavelengths 333When , the approximation of Eq.(14) by Eq.(16) leads to a relative error smaller than 10%, no matter the relative difference in density., we can assess that and the dispersion relationship becomes
| (16) |
Since this relation is independent on , a difference in density between both fluids does not generate any significant delay in the wave propagation to the top.
Experimentally, capillary waves can be detected by subtracting two successive images, as shown in Fig. 8. A progressing front appears in blue, while a receding one appears in red.
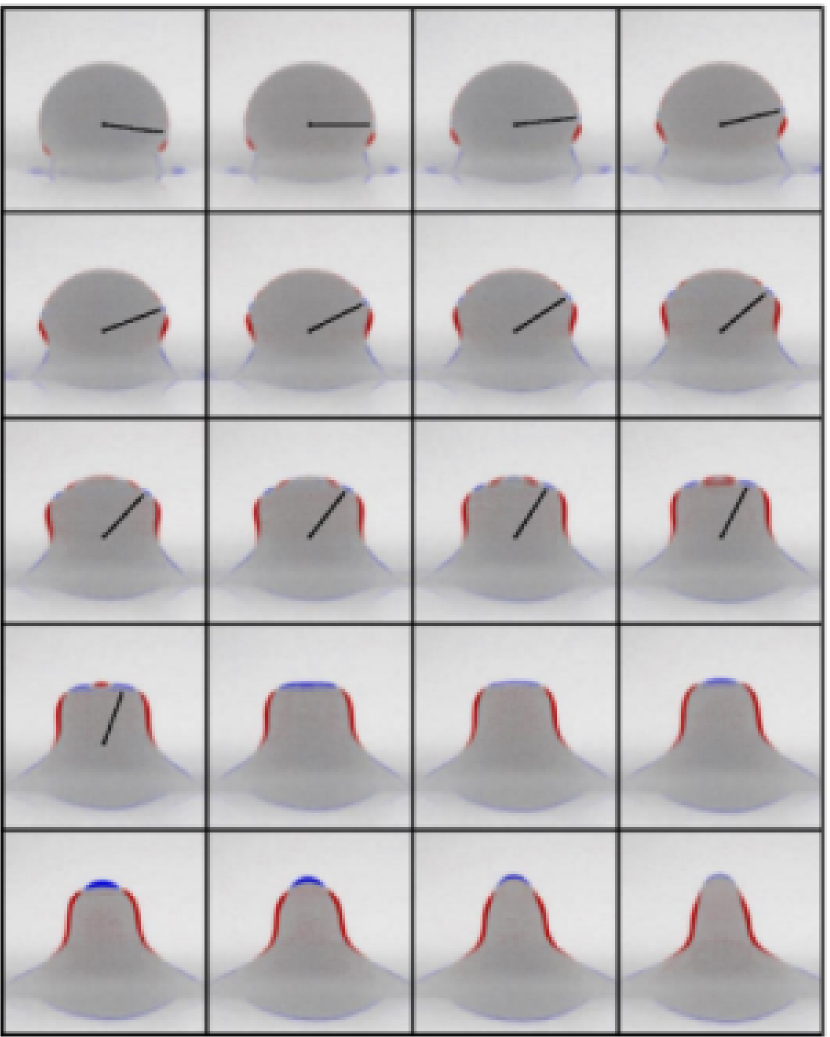
According to these pictures, the dominant mode can be estimated to . It is created during the initial hole opening, roughly 7.5° below the equator. The linear theory predicts a phase velocity
| (17) |
Pictures give a constant angular phase velocity about 2.52 radians per capillary time unit, which corresponds to .
The propagation time of the waves from bottom to top is roughly proportional to . This means that higher modes () arrive on top in the same time, while lower modes () arrive later, separately. Therefore, the convergence cannot be due to these modes. Indeed, they are still on the way when the convergence is observed.
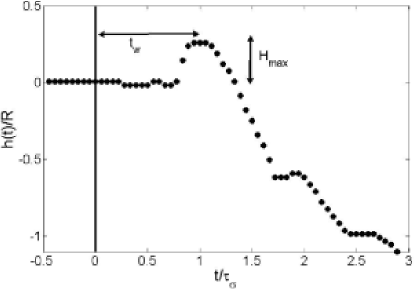
The relative elevation of the top of the droplet is plotted as a function of time in Fig. 9. Such a parameter was already studied by Mohamed-Kassim and Longmire Z. Mohamed-Kassim and E.K. Longmire (2004); A. Menchaca-Rocha et al. (2001). At the beginning of coalescence, the relative elevation is nearly zero since only the bottom of the droplet moves. When the capillary waves are not too damped (partial coalescence), they converge at the top, and the elevation increases until , sometimes more than 30% of the initial radius. The propagation time can be estimated from these data as the time between the film rupture and the point of maximal elevation. Both quantities and are illustrated in Fig. 9.
In Fig.10, it can be seen that this time is roughly , and it is independent of and .
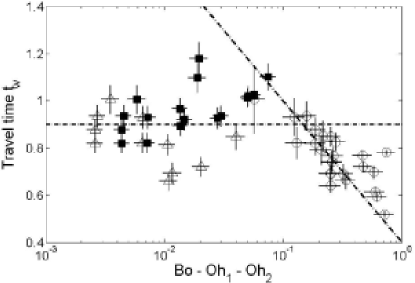
On the other hand, a significant decrease is experienced with increasing Bond number. For example, Mohamed-Kassim and Longmire Z. Mohamed-Kassim and E.K. Longmire (2004) obtained a propagation time approximately equal to 0.6 capillary time units. The dispersion relationship of surface-gravity waves on a planar interface between two semi-infinite media is given by
| (18) |
where is the angular momentum , the wave number, and the initial droplet radius. For , the influence of on this dispersion relationship is negligible compared to . The phase velocity is a priori unaffected by the Bond number, and this cannot explain the observed decrease in the propagation time. Another explanation could reside in the flattening of the droplet on the interface before the coalescence when (especially since the horizontal radius is used for the computation of the capillary time unit).
As a conclusion, convergence is mainly due to the effect of modes , the dominant one being . Waves converge to the top at approximately .
IV.4.2 Wave damping
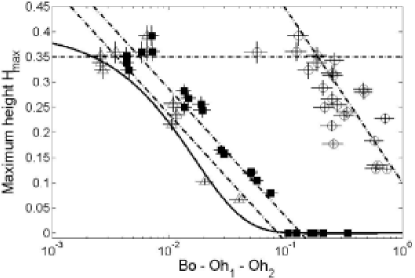
Since the amplitude is small during the wave propagation, it is difficult to assess about wave damping by only observing Fig. 8. A better indicator is the dimensionless maximal elevation of the top of the droplet. In Fig.11, is plotted with respect to , or (both other parameters being negligible). It can be seen that both viscosities play the same part in damping the waves 444The ’damping’ due to an increase of the Bond number is less relevant, since it is most probably the result of a flattening of the droplet instead of a real dissipative mechanism.: viscosity in fluid 1 is only 1.5 times more efficient than in fluid 2.
The viscous dissipation can be estimated according to the potential wave solution L. Landau and E. Lifchitz (1959) 555Since the Reynolds number (the inverse of the Ohnesorge number) is high, the vorticity can be supposed to be concentrated in a thin boundary layer. The potential solution is valid elsewhere and the viscous dissipation can be estimated on the potential flow..
The velocity potential is given by
| (19) |
The local energy dissipation rate is analytically computed as
| (20) |
The dimensionless total dissipated power is then given by
| (21) |
The total amount of mechanical energy is given by
| (22) |
According to Landau and Lifchitz L. Landau and E. Lifchitz (1959), the wave amplitude is decreasing as
| (23) |
where
| (24) |
On a spherical interface, the damping factor is given by
| (25) |
Therefore, according to the linear theory, one should expect
| (26) |
where corresponds to the maximal height reached without viscous dissipation (). As it can be seen on the snapshot in Fig. 8, the 0.6 factor is the time needed by the waves to travel from bottom to top (in capillary time units).
As shown in Fig. 11, the linear theory seems to give a representative picture of the wave damping. However, it is not able to explain why fluid 2 is 1.5 times less efficient in damping waves than fluid 1. Additional effects such as non-linearities and dissipation during the wave formation have to be taken into account.
IV.4.3 Capillary waves and partial coalescence
Although the delay in vertical collapse due to the convergence of capillary waves is important to get a partial coalescence, it is not the only determinant factor. Indeed, in Fig. 12, coalescence with an important viscosity in fluid 1, the coalescence is total, despite the presence of capillary waves. On the other side, in Fig. 13, coalescence with an important viscosity in fluid 2, the coalescence is partial, although the capillary waves are fully damped.
V Discussion
The outcome of a coalescence is influenced by the viscosity of both fluids. Critical Ohnesorge numbers has been identified for which a partial coalescence becomes total.
Until now, the partial coalescence was thought to be directly related to the convergence of capillary waves on the top of the droplet. The critical Ohnesorge to get fully damped capillary waves is similar in fluid 1 and in fluid 2, and is about . Surprisingly, the critical Ohnesorge for the partial-to-total coalescence transition is about 4 times higher in fluid 2 and 4 times lower in fluid 1: it is possible to observe waves without partial coalescence and vice versa.
Therefore, the convergence of capillary waves cannot be the only mechanism responsible for partial coalescence. When is high, a mechanism has to be activated to enhance the emptying of the droplet, resulting in a premature total coalescence. Inversely, when is high, another mechanism has to give advantage to the horizontal collapse. However, when is too high, this advantage have to become a drawback.
When and are similar, the additional mechanisms balance themselves and the capillary waves remain the only dominant factor. This could explain the outgrowth of the partial coalescence region on the solid line of the map (Fig. 5).
The main trend of movement during a coalescence is a powerful rotation, as it was shown in the PIV experiments of Mohamed-Kassim et al. Z. Mohamed-Kassim and E.K. Longmire (2004), as well in the numerical simulations of Blanchette et al. F. Blanchette and T.P. Bigioni (2006) and Yue et al. P. Yue et al. (2006b). This nominal movement is schematically represented with solid arrows in Fig. 14.
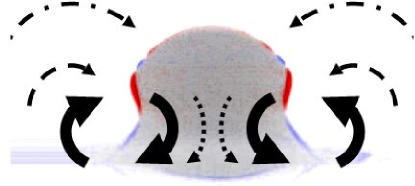
The fluid motion is due to the conversion of interfacial energy into kinetic energy. As it was shown in section IV.3, the kinetic energy supply rate is constant, and does not greatly depend on viscosities. This energy is distributed in each fluid such as the normal velocity has to be continuous at the interface. When viscosities are negligible, it gives rise to an ’ideal fluid’ movement.
In presence of viscosity, the regions of high velocity gradients (visible on the numerical simulations of Blanchette F. Blanchette and T.P. Bigioni (2006)) are diffusing momentum and energy. Since the motion is imposed by the interface, the higher the viscosity is, the bigger the mass of fluid is displaced. In fluid 1, this additional movement (represented by dotted arrows in Fig. 14) tends to accelerate the emptying of the droplet. Note that other movements in fluid 1 can be enhanced by viscous diffusion when is increased, especially the collapse of the final column as a whole.
In fluid 2, such a induced movement enhances the horizontal collapse. This could explain the amazingly thin aspect of the column-shaped interface on the latest stages of coalescences when is high (see snapshots in Fig. 2(c) and 2(d)). When is intermediate, the horizontal collapse is confined to regions lower than the equator of the initial droplet, and this ensure a partial coalescence (dashed arrows in Fig. 14, snapshot in Fig. 2(c)). When increases, the viscous diffusion entrains fluid at higher latitudes, and the vertical extension of the horizontal collapse is bigger: coalescence becomes total (dashdot arrows in Fig. 14, snapshot in Fig. 2(d)). The boundary between these two opposite influences is approximately reached when energy is diffused on a scale of the order of , the initial radius of the droplet. The critical Ohnesorge in fluid 2 was found to be about 0.32. This means that during the coalescence (), the energy is spread on a scale roughly equal to , which is coherent with the previous assumptions.
Further investigation is needed (for example a complete P.I.V. study) in order to confirm the existence of these mechanisms, and to assess about the precise impact of viscosities on the flow.
VI Conclusions
Partial coalescence only depends on four dimensionless parameters, the Bond number (gravity/surface tension), the Ohnesorge numbers in both fluids (viscosity/surface tension), and the density relative difference. The partial coalescence can occur only when the Bond and the Ohnesorge numbers are below critical values , , and , since surface tension has to be the only dominant force. Otherwise, the coalescence is total.
An experimental work on 150 coalescence events has been made in order to study the impact of viscosity and gravity on the coalescence process. The droplets were filmed and the images post-processed in order to determine the droplet radii, the capillary waves, but also quantities such as the potential surface energy along any coalescence process. Surprisingly, it seems that this surface energy is converted into kinetic energy at a constant rate, that does not depend on the coalescence outcome. This observation has no explanation until now.
The law, which represents the ratio between the daughter and the mother droplet radii, has been investigated as a function of , , and . When these numbers are small enough, becomes equal to approximately 0.5. Gravity is known to accelerate the emptying of the droplet, while viscosity damps the waves during their propagation. The critical Ohnesorge for the partial-to-total transition is more than one order of magnitude higher in fluid 2 than in fluid 1.
Blanchette and Bigioni F. Blanchette and T.P. Bigioni (2006) have argued that partial coalescence was due to the waves convergence on the top of the droplet. The propagation and the damping of these waves has been investigated. The dominant modes are . The damping of these waves is roughly the same in fluid 1 and in fluid 2. It cannot explain the huge difference between critical Ohnesorges in both fluids. Therefore, other viscous mechanisms has been suspected to enhance or to avoid partial coalescence.
In appendix, a prediction of cascade features was made for a great number of different fluids. The record is probably a 11-step cascade, when using an interface between mercury and another non-viscous liquid. Such a cascade has not been observed for now. It would imply the use of advanced microscopy technique to observe the late stages of the cascade.
Although partial coalescence begins to be understood, many questions remain unexplored. A P.I.V. study should address a lot of these problems.
Acknowledgements.
T.G. benefits of a FRIA grant (FNRS,Brussels); S.D. is a research associate of FNRS (Brussels). This work has been financially supported by Colgate-Palmolive Inc. The authors would like to thank especially Dow Corning S.A., Dr. G. Broze, Dr. H. Caps, Dr. M. Bawin, PhD Student S. Gabriel, and S. Becco for their fruitful help. This work has been also supported by the contract ARC 02/07-293.Appendix A Number and size of daughter droplets
It is possible to estimate the maximum number of daughter droplets for a couple of fluids starting from their physical properties (available in G.W.C. Kaye and T.H. Laby (1973) and Lide (2005) for instance). The maximum droplet size (limited by gravity - Eq.(4)) has a radius of the order of
| (27) |
while the minimum droplet radius (viscosity limited - Eq.(5)) is of the order of
| (28) |
Supposing that during the whole cascade, the upper bound of the possibles numbers of steps in the cascade is given by
| (29) |
When , the coalescence is total.
The capillary time can be estimated for the largest and the smallest droplet. Moreover, we have to ensure that this time is always very short compared to the drainage time (when the droplet stays at rest on a thin film of fluid 2). When the fluid 2 has a dynamical viscosity significantly smaller than the fluid 1, the film drainage does not entrain the fluid 1 (neither in the droplet, nor in the bulk phase). The Reynolds’model Leblanc (1993), based on the lubrication equation, is of application. The lifetime is given by
| (30) |
where is the critical film thickness when the film breaks. When dynamical viscosities are similar, the film drainage entrains fluid 1, and the Reynolds’theory have to be replaced by Ivanov and Traykov’s equation I.B. Ivanov and T.T. Traykov (1976)
| (31) |
This equation is used to provide a crude estimation of the lifetime of the droplets in Table 2. Note that the drainage time is highly influenced by several factors: surfactant Leblanc (1993), electric fields J.S. Eow and M. Ghadiri (2003), vibrations Y. Couder et al. (2005), and initial conditions among others.
Tables 2 and 3 give predicted orders of magnitude of , , , the associated lifetimes and capillary times, and the number of steps for different fluids 1. The fluid 2 is air (A), water (W) or mercury (M). When fluid 2 is heavier than fluid 1, the droplet crosses the interface from bottom to top. When the symbol * is used, fluids 1 and 2 are inverted (for example a droplet of mercury surrounded by benzene instead of a droplet of benzene surrounded by mercury). The results in bold have been approximately checked experimentally (by Charles and Mason G.E. Charles and S.G. Mason (1960), Leblanc Leblanc (1993) or our results).
| Name | Chemical | Other | |||||||||||
|---|---|---|---|---|---|---|---|---|---|---|---|---|---|
| formula | phase | ||||||||||||
| Acetic acid | A | ||||||||||||
| Acetone (25°C) | A | ||||||||||||
| M | |||||||||||||
| M* | |||||||||||||
| Aniline | A | ||||||||||||
| W | 4.4 | 7.6[3] | 1 | ||||||||||
| W* | |||||||||||||
| Benzene | A | ||||||||||||
| M | |||||||||||||
| M* | |||||||||||||
| W | 4.5 | ||||||||||||
| W* | 67 | 6 | |||||||||||
| Carbon disulphide | A | ||||||||||||
| Carbon tetrachloride | A | ||||||||||||
| W | 2.3 | ||||||||||||
| W* | |||||||||||||
| Chloroform | A | ||||||||||||
| W | |||||||||||||
| W* | |||||||||||||
| M | |||||||||||||
| M* | |||||||||||||
| Cyclohexane (25°C) | W | ||||||||||||
| W* | |||||||||||||
| DC200-0.65cSt (25°C) | A | ||||||||||||
| W | 3 | 28 | |||||||||||
| W* | 0.77 | 58 | 5 | ||||||||||
| DC200-1.5cSt (25°C) | A | ||||||||||||
| W | 3.5 | 37 | |||||||||||
| W* | 1.1 | 60 | 5 | ||||||||||
| DC200-10cSt (25°C) | A | ||||||||||||
| W | 5.7 | 77 | |||||||||||
| W* | 2.8 | 64 | 6 | ||||||||||
| DC200-50cSt (25°C) | A | ||||||||||||
| W | 7.3 | 110 | |||||||||||
| W* | 4.6 | 510 | 3 |
| Name | Chemical | Other | |||||||||||
|---|---|---|---|---|---|---|---|---|---|---|---|---|---|
| formula | phase | ||||||||||||
| DC200-100cSt (25°C) | A | ||||||||||||
| W | 7.8 | 130 | |||||||||||
| W* | 5.3 | 2000 | 1 | ||||||||||
| Di-ethyl ether | A | ||||||||||||
| M | |||||||||||||
| M* | |||||||||||||
| W | |||||||||||||
| W* | |||||||||||||
| Dodecane | W | 3.7 | 150 | 4 | |||||||||
| W* | |||||||||||||
| Ethanol | A | ||||||||||||
| Ethyl acetate | A | ||||||||||||
| Formic acid | A | ||||||||||||
| Glycerol | A | ||||||||||||
| M | 1.5 | ||||||||||||
| M* | 1 | ||||||||||||
| Mercury | A | ||||||||||||
| (25°C) | |||||||||||||
| Methanol | A | ||||||||||||
| n-Heptane | M | ||||||||||||
| M* | |||||||||||||
| W | 3.4 | ||||||||||||
| W* | 41 | 6 | |||||||||||
| n-Hexane | A | ||||||||||||
| n-Octane | A | ||||||||||||
| W | |||||||||||||
| W* | |||||||||||||
| Toluene | A | ||||||||||||
| W | 3.9 | ||||||||||||
| W* | 83 | 5 | |||||||||||
| Water | A | ||||||||||||
| A* | |||||||||||||
| (25°C) |
We can see in Tables 2 and 3 that, contrary to Thoroddsen’s predictions Thoroddsen (2006), the coalescence of a mercury droplet surrounded by air is done in only 6 stages. The maximum number of cascade steps is obtained for a mercury droplet surrounded by a non-viscous liquid, such as acetone, benzene, heptane, chloroform or ether. No more than 11 stages will be observed in this case. The record could be broken by working with giant droplets in microgravity. Note that a 11-stage cascade is really hard to observe with a traditional optical instrumentation, since the smallest droplets have a radius of about 0.6 micrometers. Moreover, these droplets have a lifetime about 0.5 milliseconds and they probably coalesce in less than 100 nanoseconds. The continuum media approach is usually valid. Indeed, when working with two liquids, the mean free path is clearly smaller than the last droplet, about 600 nanometers. And when working with a liquid surrounded by air, the air viscosity avoids droplets below 10 micrometers.
Data are not in agreement with our predictions concerning an aniline droplet surrounded by water. The aniline experiences as much as three partial coalescences, while our predictions state for a total coalescence. Therefore, the critical Ohnesorge is higher than 0.02 in this case. The reason is still unknown and needs further investigations.
References
- M. Wu et al. (2004) M. Wu, T. Cubaud, and C-M. Ho, Phys. Fluids 16 (2004).
- H.A. Stone et al. (2004) H.A. Stone, A.D. Stroock, and A. Ajdari, Annu. Rev. Fluid Mech. 36, 381 (2004).
- Thoroddsen (2006) S. Thoroddsen, Nat. Phys. 2, 223 (2006).
- N. Vandewalle et al. (2006) N. Vandewalle, D. Terwagne, K. Mulleners, T. Gilet, and S. Dorbolo, Phys. Fluids 18, 091106 (2006).
- G.E. Charles and S.G. Mason (1960) G.E. Charles and S.G. Mason, J. Colloid Sci. 15, 105 (1960).
- Leblanc (1993) Y. Leblanc, Ph.D. thesis, Université Paris VII (1993).
- S.T. Thoroddsen and K. Takehara (2000) S.T. Thoroddsen and K. Takehara, Phys. Fluids 12, 1265 (2000).
- P. Pikhitsa and A. Tsargorodskaya (2000) P. Pikhitsa and A. Tsargorodskaya, Colloids Surf., A 167, 287 (2000).
- F. Blanchette and T.P. Bigioni (2006) F. Blanchette and T.P. Bigioni, Nat. Phys. 2, 1 (2006).
- E.M. Honey and H.P. Kavehpour (2006) E.M. Honey and H.P. Kavehpour, Phys. Rev. E 73, 027301 (2006).
- H. Aryafar and H.P. Kavehpour (2006) H. Aryafar and H.P. Kavehpour, Phys. Fluids 18, 072105 (2006).
- X. Chen et al. (2006a) X. Chen, S. Mandre, and J.J. Feng, Phys. Fluids 18, 051705 (2006a).
- X. Chen et al. (2006b) X. Chen, S. Mandre, and J.J. Feng, Phys. Fluids 18, 092103 (2006b).
- P. Yue et al. (2006b) P. Yue, C. Zhou, and J.J. Feng, Phys. Fluids 18, 102102 (2006b).
- Z. Mohamed-Kassim and E.K. Longmire (2004) Z. Mohamed-Kassim and E.K. Longmire, Phys. Fluids 16, 2170 (2004).
- S.T. Thoroddsen et al. (2005) S.T. Thoroddsen, K. Takehara, and T.G. Etoh, J. Fluid Mech. 527, 85 (2005).
- B.S. Dooley et al. (1997) B.S. Dooley, A.E. Warncke, M. Gharib, and G. Tryggvason, Exp. Fluids 22, 369 (1997).
- Hartland (1967) S. Hartland, Trans. Inst. Chem. Eng. 45 (1967).
- A.F. Jones and S.D.R. Wilson (1978) A.F. Jones and S.D.R. Wilson, J. Fluid Mech. 87, 263 (1978).
- J. Eggers et al. (1999) J. Eggers, J.R. Lister, and H.A. Stone, J. Fluid Mech. 401, 293 (1999).
- A. Menchaca-Rocha et al. (2001) A. Menchaca-Rocha, A. Martínez-Dávalos, R. Núñez, S. Popinet, and S. Zaleski, Phys. Rev. E 63, 046309 (2001).
- C. Hanson and A.H. Brown (1967) C. Hanson and A.H. Brown, Solvent Extraction Chemistry 522 (1967).
- A.V. Anilkumar et al. (1991) A.V. Anilkumar, C.P. Lee, and T.G. Wang, Phys. Fluids A 3, 2587 (1991).
- P.N. Shankar and M. Kumar (1995) P.N. Shankar and M. Kumar, Phys. Fluids 7, 737 (1995).
- R.W. Cresswell and B.R. Morton (1995) R.W. Cresswell and B.R. Morton, Phys. Fluids 7, 1363 (1995).
- L. Landau and E. Lifchitz (1959) L. Landau and E. Lifchitz, Course on theoretical physics, 6 - Fluid mechanics (Addison Wesley, 1959).
- G.W.C. Kaye and T.H. Laby (1973) G.W.C. Kaye and T.H. Laby, Tables of physical and chemical constants, and some mathematical functions (Longman, 1973), 14th ed.
- Lide (2005) D. Lide, Handbook of Chemistry and Physics (CRC Press, 2005), 83rd ed.
- I.B. Ivanov and T.T. Traykov (1976) I.B. Ivanov and T.T. Traykov, Int. J. Multiphase Flow 2, 397 (1976).
- J.S. Eow and M. Ghadiri (2003) J.S. Eow and M. Ghadiri, Colloids Surf., A 215, 101 (2003).
- Y. Couder et al. (2005) Y. Couder, E. Fort, C.H. Gautier, and A. Boudaoud, Phys. Rev. Lett. 94, 177801 (2005).