Topology of Foreign Exchange Markets using Hierarchical Structure Methods
Abstract
This paper uses two physics derived hierarchical techniques, a minimal spanning tree and an ultrametric hierarchical tree, to extract a topological influence map for major currencies from the ultrametric distance matrix for 1995 - 2001. We find that these two techniques generate a defined and robust scale free network with meaningful taxonomy. The topology is shown to be robust with respect to method, to time horizon and is stable during market crises. This topology, appropriately used, gives a useful guide to determining the underlying economic or regional causal relationships for individual currencies and to understanding the dynamics of exchange rate price determination as part of a complex network.
pacs:
02.50.Sk, 89.65.-s, 89.65.Gh, 89.75.HcI Introduction
Hierarchical structure methods are used in finance to ascertain the structure of asset price influences within a market. These methods use the synchronous correlation coefficient matrix of daily difference of log prices to quantify the pricing distance between assets in terms of the inherent hierarchical structure. This structure will give some indication of the taxonomy of an assets’ portfolio, and can be used to generate an asset markets’ hierarchy.
Two techniques will be used in this paper. The first technique is the creation of a minimal spanning tree (MST), which is a graph of a set of elements of the arrangement of the nodes in an ultrametric space. MST has been shown to provide sound results for financial assets with the resultant taxonomy displaying meaningful clusters [1, 2, 3, 4]. MST also helps to overcome the empirical problem of noise in a historical correlation matrix [5].
The second technique is the creation of an ultrametric hierarchical tree structure [6, 7]. This technique gives a determination of the hierarchical structure of a network and is particularly useful for determining if hubs exist.
The structure of asset price movements is extracted by use of a synchronous correlation coefficient matrix, , of daily difference of log prices. This matrix is transformed [8] by the equation below to get the ultrametric pricing distance between currencies. This metric preferred to correlation as it fulfils the three axioms of a metric distance [1].
The choice of clustering procedure is vital as it has more effect on the quality of clustering than the choice of distance metric [9]. MST analysis uses the single-linkage clustering method which builds up clusters by starting with distinct objects and linking them based on similarity. The major issue with this method is that while it is robust for strongly clustered networks, it has a tendency to link poorly clustered groups into chains by successively joining them to their nearest neighbours [10]. These chains are non-robust to data variation, and thus MST is less robust for larger distances. The information obtained should thus be used with care and be combined with other techniques if possible. This paper will focus on the extraction of price influences rather than on determinants of market activity.
II The data
Forty-four currencies (table 1) were chosen because they were generally free floating, covered the data period (23/10/95 - 31/12/01) and had either market dominance or represented a region. The Mexican peso and Russian rouble were used in their format prior to currency reforms, which removed three zeros. Data were sourced from Oanda.com at Olsen and Associates. The exchange rates were daily average inter-bank ask rates as determined in Zurich. This should give some idea of how international currencies interact, how the currency nodes are clustered, and the pattern behind price influences. This is a small sample compared to stock market studies, which will limit possible topologies.
III Numeraire
One of the problems uniquely encountered in foreign exchange research is that currencies are priced against each other so no independent numeraire exists. Any currency chosen as a numeraire will be excluded from the results, yet its inherent patterns can indirectly influence overall patterns. There is no standard solution to this issue or a standard numeraire candidate. Gold was considered, but rejected due to its high volatility.
This is an important problem as different numeraires will give different results if strong multidimensional cross-correlations are present. Different bases can also generate different tree structures. The inclusion or exclusion of currencies from the sample can also give different results. This implies samples should include all major currencies and undue emphasis should not be placed on any particular MST result. Result robustness should also be checked by comparison with other methods or samples.
This study used both the NZD and the USD as numeraires. The NZD is a minor currency which can be easily excluded, and it does not impose any strong default pattern. However the overwhelming dominance of the US dollar tends to submerge secondary influences. Use of the US dollar as the numeraire allows second-order relationships to be examined, as the MST will show differences in price influence. The results are indicative only however as the exclusion of the US dollar can impose a default pattern due to cross-correlations. A larger sample size was used for the US dollar tests to allow regional clusters to be developed.
An alternative approach to MST graphs is the use of all currency pairs [3]. This is a valid approach but it does add more complexity, gives visual results which are difficult to interpret, as well as potentially missing out influential currencies. The approach is also impractical if additional causal links in addition to the primary link are examined, or if the sample size is larger than ten. There are also problems caused by the impact on correlations of cross-quotations, as this imposes a default structure.
IV Results from total period NZD matrix
The NZD based distance-metric matrix indicated similarity in currency dynamics between NLG-BEF (0.1743), NLG-FRF (0.1805) and BEF-FRF (0.2125), all members of the European Monetary System (EMS). The main surprise was the DEM which is not close to any of the EMS countries, but it is reasonably close to the MYR (0.5191). MYR-SGD (0.6888) was the only close currency pair in SE Asia (SEA), though inter-Asian values tend to be lower than intra-Asian.
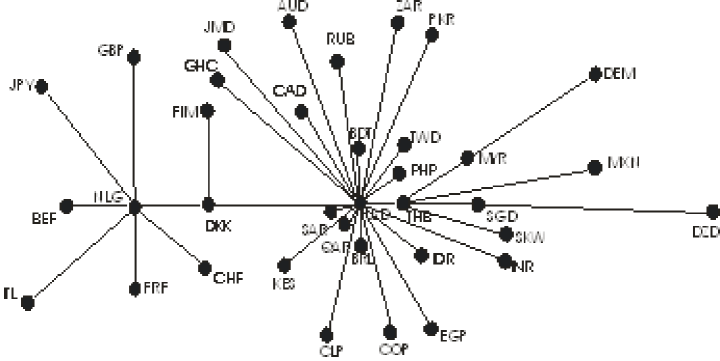
The minimum spanning tree (MST), shown in Figure 1, was created using Pajek© [11] and Kruskal’s algorithm. The star like structure indicates the USD is the predominant world currency, and the hub of an international cluster with only the EMS cluster separate. Inter-SEA FX linkages are stronger than in other (non-EMS) regions, with the IDR linked via the MYR, and THB and PHP linked to the SGD. The GBP links to the USD in preference to the EMS and the AUD links via its commodity cousin, the CAD. Two other commodity currencies are also linked, the BRL and the CLP.
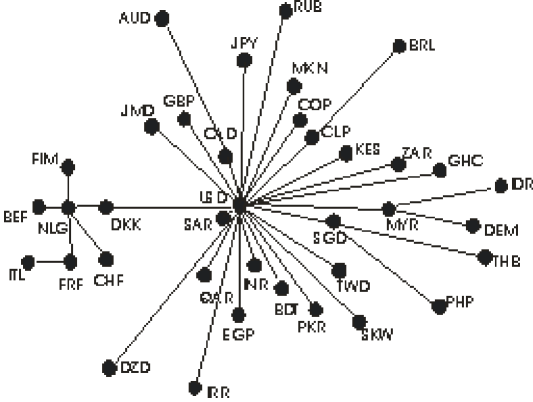
The linking of the DEM to the MYR is a puzzle as the mechanism of the EMS implies close correlations between EMS members. This implication is backed by correlation based empirical evidence [12, 13, 14]. One possible explanation is that as the lead currency within the EMS the value of DEM is determined by global influences and these are best reflected in the value of the MYR. Other EMS currencies are followers so do not respond on a daily basis to global factors. Another explanation is that since the distance metric is based on log daily changes with no lag component it reflects short-term movements within the EMS band. For the DEM these may not be related to the intra-band movements of other EMS currencies. This issue needs further analysis. The DEM result emphases the causation made in section 1; that hierarchical structure techniques need to be used with care and combined with other techniques if possible.
MST analysis shows the key determinant European currency as the NLG with the inter-cluster linkage via the USD-DKK. It is of interest that currencies which are isolated, like the RUB or the IRR, still have the USD as their main determinant link. The MST was robust to excluded currencies, with these either being USD linked (CRC) or EMS linked (CZK). Further studies using monthly and annual data indicated no change in the basic topology.
The distribution of links per node is more centralised than a power-law would dictate. An ln-ln plot of link density had a slope of 0.8, indicating a strong element of self-organisation in the international financial system. These results imply that either currencies are all linked by common economic factors or currency traders pay more attention to USD movements than to local factors. The spread of most distance values in the 0.8 to 1.16 range also reinforces the point that price setting in currency markets is generally more homogeneous than price setting in stock markets.
Our results show a more centralised arrangement than US stock market studies. The DJ and the S&P 500 indexes (1989-1995) had a closest distance of 0.949, with most in the 1.09 to 1.3 range [1]. Stock indices were also more web-like structure with four distinct clusters for the DJIA, 16 major clusters for the S&P with 44 minor clusters, and 18 key stocks acting as linkages between S&P clusters. Similar results topology was found for stocks on the Nasdaq, NYSE and AMEX [2, 15], with a power-law with degree 2.2 for the distribution of links per node, and the non-random nature of the MST remained remarkably consistent over time.
While the small size of our sample obviously can not be expected to generate complex arrangements, the simplicity is mainly due to the pre-dominance of the USD with currency markets. This is a well-established empirical result [16], which has not been found to exist in the stock market. The simplicity of our results was also robust over the entire set of 208 currencies. Onnela [18] did find a similar star-based network for the S&P 500 index, though the methodology has been criticised by [19].
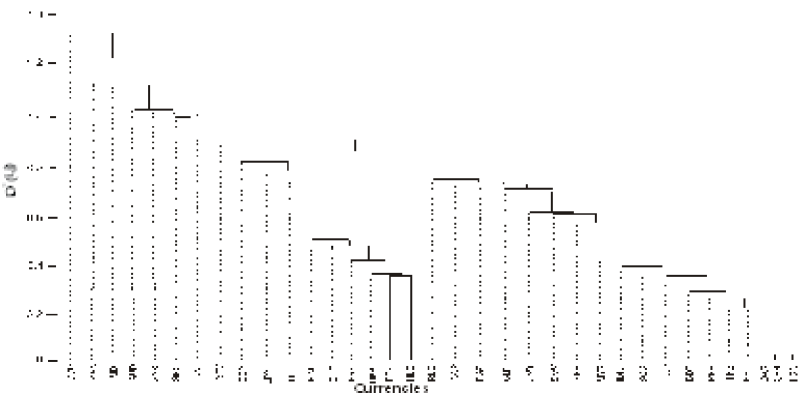
The hierarchical tree of the subdominant ultrametric space associated with the MST is shown in Figure 2.
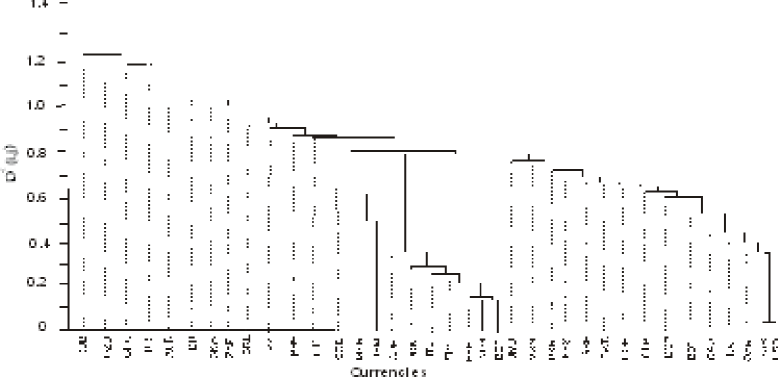
The smoothness of the hierarchical tree shows the dominance of the USD, as all currencies, aside from the EMS cluster and the DEM-MYR-SGD triage, link off the main tree. The large distances involved for IRR, GHC, DZD and RUB show them to be largely isolated.
V Results from total period USD matrix
The USD based distance-metric matrix showed weaker links than for the NZD matrix, with a number of links close to the no-relationship value. This is expected as these are secondary influences, and some currencies may not have influential secondary linkages. Note that care is needed when interpreting second order trees as relationships can be created indirectly by a joint association to the missing hub, the USD, rather than a direct relationship. Results should thus be checked against economic reasons or against other samples or methods.
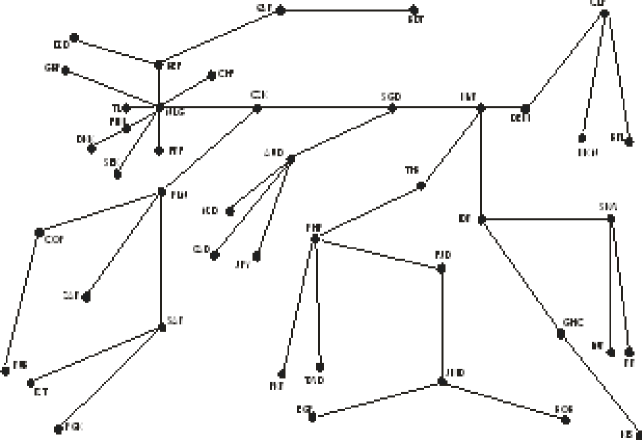
The USD based minimum spanning tree, Figure 3, shows more clustering than the NZD MST star diagram, with groups nested within other groups. Visually relationships overall seem weaker, though the EMS hub still exists. This hub is stable as dropping out the USD does not affect price causation. The removal of the USD has, however, affected most other currency relationships. The GBP is now showing its second order link to the EMS as is the DZD. There is also a minor Scandinavian grouping. The distribution of node links of the USD MST is more varied than the NZD MST, with an approximate power-law distribution of degree 1.5 ( = 0.95). Further studies using annual data indicated no change in the basic topology.
The MST has a number of dangling pendants. While these need to be treated with caution, as discussed, there does tend to be economic causation behind most of the linkages. The strongest economic clusters are the two commodity clusters. The first is the AUD, CAD, ZAR, SAR cluster. The AUD is conventionally used in currency markets as a play on commodity prices. The linking of the commodity economies to the AUD lends support to this convention.
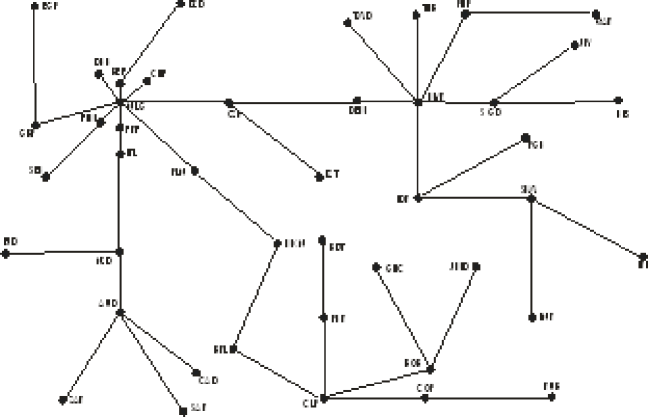
Another commodity cluster is grouped around the CLP, COP, RUB, BOB, GHC and JMD. The Indian subcontinent currencies of PKR and BDT are also weakly linked. The MXN-PLN link of this cluster back to the EMS involves long distances so maybe spurious. The distance involved with the RUB link indicates it is also isolated. The BOB, PKR and BDT links are problematic as they were pegged to the USD for part of the data period and have thin markets.
The link between the EMS cluster and the rest of the world is via the NLG-CZK-DEM-MYR link, which provides the backbone to the system. A SE Asian cluster is evident, centred on the MYR and linked via the DEM. The SGD seems to be linked externally instead of inter-Asean as illustrated by its JPY link. The SGD/ KES link and the PHP/QAR link are probably spurious.
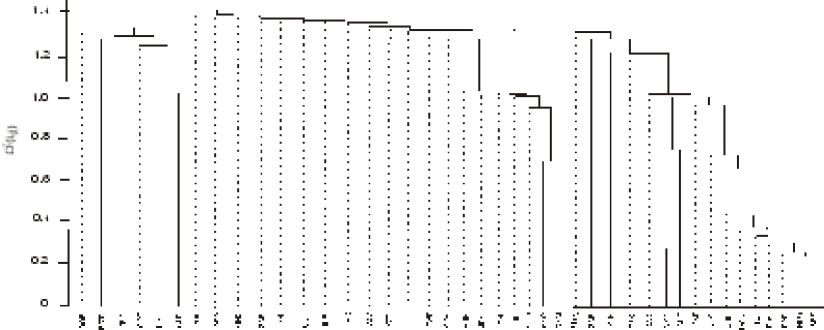
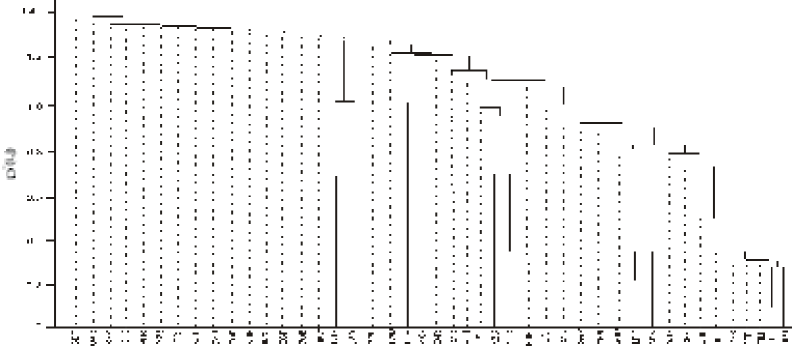
The associated hierarchical tree of the sub-dominant ultrametric space, Figure 4, shows three main secondary clusters, the EMS, with low distances, the North/SE Asian, with medium distances, and the Latin American/South Asian grouping. Outside those clusters distances tend to be high, indicating ties are weak. The tree indicates the AUD based commodity cluster is part of the dominant USD/EMS hierarchy rather than an isolated cluster. Conversely the hierarchical tree indicates that the Latin American-South Asian cluster is isolated from the main tree, and has a separate price determinate process, though inter-region linkages are weak. There is no separate South-Asia cluster.
VI Asian crisis period (1997/98)
The techniques were repeated for the Asian crisis period, 1st August 1997 to 31st October 1998. The rationale is that several empirical studies [19] have indicated that causal determination behind currency movements differs during crisis periods and non-crisis periods with regional correlations tending towards unity. It is useful to verify these results with MST analysis, as this may aid our understanding of cluster dynamics during market crises. The results can also be compared to the stick market topological crisis studies which show a universal shortening of distance [5, 17, 20].
Both the NZD and the USD distance-metric matrices show correlations within SE Asia increased during the crisis period, in most cases by 50 to 100%, approximating inter-EMS correlations. North Asian currencies had lower distances to SE Asian currencies during the crisis period. Several non-Asian currencies BDT, BRL, RUB and GBP, also became more strongly linked to the SE Asian currencies during the crisis. In contrast to these results inter-EMS distances increased, indicating stress. These results may imply that currency traders started to treat the crisis countries as a distinct bloc during the period of the crisis.
While these results provide support for the hypothesis that crisis affected countries formed a closely tied cluster, these conclusions need to be treated with care as the decrease in distances of all the affected countries to the USD raises the alternative hypothesis of an increase in power of the USD in price setting. The crisis-affected countries could thus be seen as individually increasing their joint co-movement against the USD, and only indirectly moving together.
These changes are illustrated in the crisis period NZD-based minimum spanning tree, shown in Figure 5. The total period two-cluster network shown in Figure 1 is still retained during the crisis period. The EMS cluster is largely unchanged, though the distances are increased and the GBP and JPY have been picked up. The USD cluster structure is also largely unchanged though some relative distances have changed. In particular the RUB is now closer to the USD. The Asian offshoot is retained but now the THB is the key currency with MXN and SKW now linked. This indicates the effect of the crisis on those currencies.
The similarity of Figure 5 to Figure 1 indicates that channels for crisis propagation were activities within the USD hub impacting on one country after another, instead of one currency directly affecting another. These conclusions are strengthened by examination of the hierarchical tree of the subdominant ultrametric space, shown in Figure 6. This tree shows despite decreased distances within Asia and increased EMS distances, there are still only two dominant clusters. The pattern of network clustering is unaltered. The only noticeable change is that previously isolated currencies, like the RUB, IRR or GHC, are now integrated.
The crisis period USD MST, Figure 7, shows the basic structure is retained to the normal period MST in Figure 3, with a defined EMS cluster, an Asian cluster, and a developing country commodity cluster. The primary core of NLG-CZK-SGD-MYR-DEM still exists. However there are some changes in the secondary influence pattern, as the Latin American-developing country commodity branch is broken up, the SGD is more central and currencies with more distant links have randomly re-arranged themselves. The distribution of node links has a slightly more even distribution, with a power-law distribution of degree 1.
These conclusions are reinforced by the hierarchical tree of the subdominant ultrametric space Figure 8. The EMS cluster is still present and the Asian-based cluster is weakened, with only the DEM-MYR-SGD triage present. Other Asian currencies tend to co-move with this triage only as part of a global currency co-movement. Most non-EMS-Asian currencies have weak distances. The Latin-American/ South Asian cluster has disappeared. The overall impression is of less regional clustering during the crisis and more of a common global cluster, especially outside the EMS.
VII Conclusions
This paper has shown that hierarchical methods can be used to analysis foreign exchange price influences. The results show price determination in international currency markets displays sparse clustering. The network has a simple tree-like structure with a dominant spine. Underneath the predominant influence of the USD and the EMS, there are clear secondary relationships based on economic or regional factors. This topology was shown to be robust to time horizon and market crises. The paper also indicates that the transmission process for cascading shocks is primarily through the spine and then through links outside of that spine.
The anomalous placement of the DEM within the Asian cluster however indicates that care is needed with regard to interpretation of results. This ambiguity, together with the known tendency of the single-linkage clustering method to generate unstable spurious linkages, means that MST results should always be handled with care, and used together with other methods when analysing network structure.
Overall the results also provide an indication that the price determination structure of international currency markets is tree like and sparsely clustered. This implies dynamic behaviour related to complex networks can be applied to currency markets.
VIII References:
[1] Mantegna, R. N (1999), ‘Hierarchical Structure in Financial Markets’, Eur Phys Jou B: Cond Mat, Vol 11: 193
[2] Bonanno, G., N. Vandewalle & R. N. Mantegna (2000), ‘Taxonomy of Stock Market Indices’, Phys Rev E, Vol 62, No 6: R7615-7618.
[3] McDonald, M., O. Suleman, S. Williams, S. Howison & N. F. Johnson (2005) ‘Detecting a Currency’s Dominance or Dependence using Foreign Exchange Network Trees’, Phys Rev E, Vol 72: 046106.
[4] Bonanno, G., F. Lillo & R. N. Mantegna (2001) ‘High Frequency Cross-correlation in a Set of Stocks’, Quan Fin, Vol 1: 96-104.
[5] Onnela, J-P., A. Chakraborti, K. Kaski & J. Kertész (2003) ‘Dynamic Asset Trees and Black Monday’, Phys A, Vol 324: 247.
[6] Laloux, L, P. Cizeau, J-P. Bouchard & M. Potters (1999) ‘Noise Dressing of Financial Correlation Matrices’, Phys Rev Lets, Vol 83: 1467
[7] Plerou, V, P. Gopikrishnan, B. Rosenow, L.A.N. Amaral & H.E. Stanley, (1999) ‘Universal and Non-universal Properties of Cross Correlations in Financial Time Series,’ Phys Rev Lets, Vol 83: pp 1471
[8] Gower, J. C. (1966) ’Some distance properties of latent root and vector methods used in multivariate analysis’, Biometrika, Vol. 53, (3/4): 325-33
[9] Hirst, P (2003) ‘Cluster Analysis of Financial Securities’, M.Sc. Thesis, Oxford Centre for Industrial and Applied Mathematics, Oxford University.
[10] Kaufman, L. & P.J. Rousseeuw (1990) ‘Finding Groups in Data: An Introduction to Cluster Analysis’, Wiley-Interscience; New York, USA.
[11] Baragelj, V. & A. Mrvar (2005) ‘Pajek – Program for Large Network Analysis’.
[12] Parikh, A & R. Bhattacharya (1996) ’Exchange Rates under EMS target zones: an econometric investigation’, Apld Econs, Vol 28(4): 453-466.
[13] Laopodis, N.T. ’Stochastic Behaviour of Deutsche Mark Exchange Rates within EMS’, Apled Fin Econs, Vol 13(9): 665-676.
[14] Von Hagen, J & M. Fartianni (1990) ’German Dominance in the EMS: Evidence from Interest Rates’, J. Int Money, Vol 9: 358-375
[15] Vandewalle, N, F Brisbois & X Tordoir (2001) ‘Non-Random Topology of Stock Markets’, Quant Fin, Vol 1: 372-374.
[16] Frankel, J., G. Galli & A. Giovannini (1996) ’The Microstructure of Foreign Exchange Markets’, Chicago; University of Chicago Press.
[17] Araújo, T & F. Loucã (2005) ‘The Geometry of Crashes - A Measure of the Dynamics of Stock Market Crises,’ arXiv.org/physics/0506137
[18] Onnela, J-P. (2002) ‘Taxonomy of Financial Assets,’ Masters Thesis, Laboratory of Computational Engineering, Helsinki University of Technology.
[19] Johnson, N. F., M. McDonald, O. Suleman, S. Williams, S. Howison (2005) ‘What shakes the FX Tree? Understanding Currency Dominance, Dependency and Dynamics’, Proceedings of SPIE – the International Society for Optical Engineering, Vol 5848: 86-99.
[20] Lillo, F & R. Mantegna (2002) ‘Dynamics of a financial market index after a crisis,’ Phys A, Vol 338: 125-134.
[21] Bikhchandani, S. & S. Sharma (2000) Herd behaviour in financial markets: A review,’ International Monetary Fund, WP/00/48.
[22] Frankel, J. A & A. K. Rose (1996) ‘Currency crashes in emerging markets: An empirical treatment’, J. Int Econs, Vol 41 (3/4): 351-366
Table 1 Countries selected for Exchange Data
Currency and international quotation code
(23/10/1995 - 31/12/2001)
| Currency | Code | Currency | Code | |
| Algerian Dinar | DZD | Italian Lira | ITL | |
| Australian Dollar | AUD | Japanese Yen | JPY | |
| Bangladeshi Taka | BDT | Jamaican Dollar | JMD | |
| Belgium Franc | BEF | Kazakhstan Tenge | KZT | |
| Bolivian Boliviano | BOB | Kenyan Shilling | KES | |
| British Pound | GBP | Malaysian Ringgit | MYR | |
| Brazilian Real | BRL | Mexican Peso | MXN | |
| Canadian Dollar | CAD | New Zealand Dollar | NZD | |
| Chilean Peso | CLP | Pakistan Rupee | PKR | |
| Colombian Peso | COP | Papua New Guinea Kina | PGK | |
| Czech Koruna | CZK | Philippine Peso | PHP | |
| Danish Krone | DKK | Polish Zloty | PLN | |
| Dutch Guilder | NLG | Qatar Rial | QAR | |
| Eqyptian Pound | EGP | Russian Rouble | RUB | |
| Fiji Dollar | FJD | Saudi Arabian Riyal | SAR | |
| Finnish Markka | FIM | Singapore Dollar | SGD | |
| French France | FRF | South Korean Won | SKW | |
| Ghanaian Cedi | GHC | South African Rand | ZAR | |
| German Deutsche Mark | DEM | Swedish Krona | SEK | |
| Indian Rupee | INR | Swiss Franc | CHF | |
| Indonesian Rupiah | IDR | Taiwan Dollar | TWD | |
| Iranian Rial | IRR | Thai Baht | THB |