Splashing of liquids: interplay of surface roughness with surrounding gas
Abstract
We investigate the interplay between substrate roughness and surrounding gas pressure in controlling the dynamics of splashing when a liquid drop hits a dry solid surface. We associate two distinct forms of splashing with each of these control parameters: prompt splashing is due to surface roughness and corona splashing is due to instabilities produced by the surrounding gas. The size distribution of ejected droplets reveals the length scales of the underlying droplet-creation process in both cases.
pacs:
47.55.Dz, 47.20.Cq, 47.20.MaI. Two contributions to splashing
A liquid drop hitting a surface will often splash, rupturing into
many tiny droplets. Although splashing is ubiquitous and important
in many applications 1 ; 2 ; 3 , the control parameters governing
its occurrence have not yet been fully explored. Impact velocity,
surface tension, viscosity and substrate roughness have long been
known to be important 4 ; 5 ; 6 . However only recently was it
discovered that splashing can be completely eliminated on smooth
surfaces simply by lowering the surrounding gas pressure 7 .
In this paper we focus on the role that surface roughness plays in
producing a splash. Given the discovery that the gas pressure can,
by itself, cause splashing, it is apparent that only by removing the
surrounding gas can the other control parameters, such as surface
roughness, be investigated in isolation. In order to make progress,
we therefore eliminate all vestiges of the corona splash by working
at low gas pressures. This insures that the effects of surface
roughness are unperturbed by the effects of the surrounding gas.
Two types of splashing are well-known in the literature 8 : “corona” splashing, where a corona forms and subsequently ruptures and “prompt” splashing, where droplets emerge at the advancing liquid-substrate contact line. Although the two phenomena are distinct there has been no fundamental understanding of their separate causes. The results reported here suggest a simple explanation: corona splashing is due to the presence of surrounding gas and occurs above a critical gas pressure and prompt splashing occurs on rough surfaces even in the absence of air. By studying the ejected-droplet size distribution of these two forms of splashing, we can determine the characteristic length scale of the droplet-creation process in each case. This corroborates our interpretation of how the splash is formed.
Our previous experiment 7 clearly showed that surrounding gas causes the corona splash on smooth surfaces. Here we study the effect of another control parameter: surface roughness. In order to do this cleanly, we must lower the gas pressure until the effects of air are negligible. We achieved this by doing an experiment in a helium atmosphere at 13kPa pressure, much lower than the threshold pressure 7 for the surrounding gas to produce a corona splash. In this situation, therefore, splashing is caused entirely by surface roughness.
In our experiments, we use ethanol which has density , viscosity and surface tension . We filmed drops, of diameter mm, released inside a transparent vacuum chamber from a nozzle at a height cm above a rough substrate. The impact speed of the drop, , was determined by analyzing the drop position in subsequent frames of each movie. Rough substrates were obtained by using high-quality sandpapers uniformly coated with closely packed particles (microcut-paper-discs®, Buehler Ltd.). The roughness, , defined as the average diameter of the particles, was varied between and . Clean glass microscope slides were used as the smooth substrates. The gas pressure, , was varied. Ethanol wets our substrates and does not rebound after hitting the surface 9 . We also note that although ethanol wets the substrate (zero degree static contact angle), the profile of the liquid film during expansion has a finite thickness at the edge, instead of decreasing smoothly to zero. All experiments were done at constant temperature,
As we increase the roughness, , we see an evolution in behavior as shown in Fig. 1. We compare the splash created solely by surface roughness at low pressure with the splash created when air is also present. In each panel the top row is at low pressure, , and the bottom row is at atmospheric pressure, . Fig.1a shows the result for a smooth surface: at low pressure there is only a liquid film expanding smoothly on the substrate with no splashing whereas at atmospheric pressure there is a corona that breaks up into many small droplets. This shows unambiguously that air causes corona splashing. Fig. 1b shows the result for a small amount of roughness, . In this case, at low there are two regimes: an early stage with prompt splashing which is followed by a peaceful regime where no splashing occurs. At atmospheric pressure, there is a single regime throughout the expansion that resembles corona splashing except that it is not as symmetric as when the surface is completely smooth. Thus, for roughness , there is a clear difference as is increased, showing that surrounding gas can still be important at atmospheric pressure. For large roughness, , we see typical prompt splashing, where droplets are ejected from the expanding contact line during the entire expanding process for both low and atmospheric pressures.
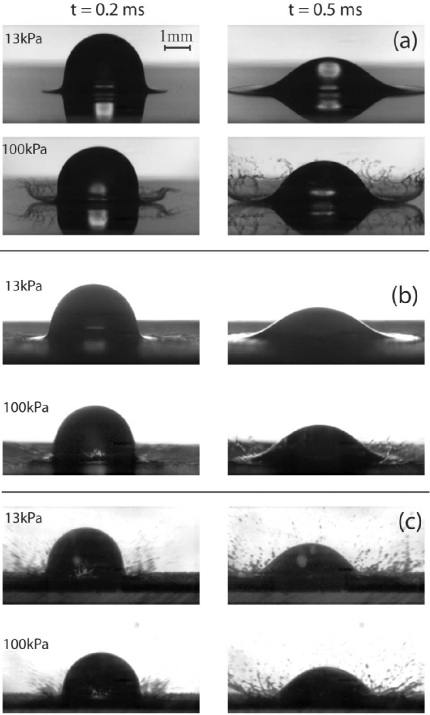
In summary, there are two contributions to splashing: a corona part caused by gas and a prompt part caused by surface roughness. At low pressures, for small roughness (), there is no corona and there is only a small amount of prompt splashing produced at the beginning. This prompt splashing disappears at later times. For large roughness (), splashing at the advancing contact line is produced throughout the entire duration of the expansion. At atmospheric pressure there is a transition as the roughness is increased: the corona splash dominates at small surface roughness and the prompt splash dominates at large .
These results indicate that in the absence of air, splashing is caused when the expanding liquid film, of thickness , becomes destabilized by surface roughness; but if the roughness is too small or the film is too thick then no splashing will occur. Initially the expanding film thickness is of molecular size and increases in thickness during expansion as liquid is added to the film. Thus for small roughness (), splashing occurs immediately after impact and is followed by a quiescent stage as the film becomes much thicker than the roughness. For large roughness (), splashing continues throughout the film expansion since never grows large enough to be unperturbed by the roughness. From the photographs, we estimated the liquid film thickness, , at the point where splashing stops for and found . This suggests the following criterion for prompt splashing:
| (1) |
where is a dimensionless number depending on
Weber number and Reynolds number
. For the impact conditions in Fig.1, and
, we conclude . Further studies are necessary to establish the dependence of on and . For example, at sufficiently low velocity we might not
expect to see any splash at all. We emphasize that can only
be measured accurately when the effect of gas pressure is negligible
since otherwise the corona component will contaminate the results.
This shows the importance of separating the two types of splashing
by working at small .
II. Size distribution of prompt splashing
After impact, the liquid breaks up into many tiny droplets. The
size distribution of these emitted droplets, , may retain an
imprint of the droplet creation process and thus provide a clue to
the mechanism initiating the interfacial instability. Here we
report for prompt splashing on rough substrates.
We measure the size of emitted droplets by adding a small amount of ink (Sanford® black stamp pad inker) to the ethanol, at the volume ratio 1:6 (ink:ethanol). The mixed liquid has the following material properties: density: , viscosity: , surface tension: . ( is measured both in air and helium atmosphere under low pressure. Both cases give the same result, .) Except for the viscosity, which increases by a factor of 2.5, these values are close to those for pure ethanol. We have also checked repeatedly with high-speed video and found that the splashing pictures look very similar with and without ink, therefore we made sure that the addition of ink does not change splashing qualitatively. We surround the impact point with a cylinder of diameter rolled from a sheet of white paper. After splashing, the droplets hit the cylinder, leaving stains.
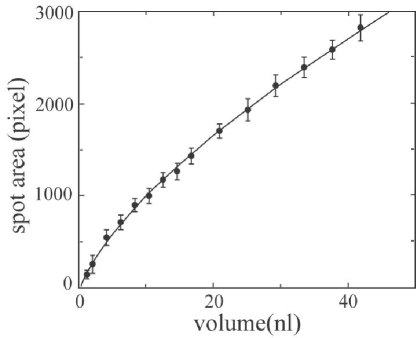
With careful calibration, we convert the sizes of the ink spots on the paper to the sizes of the ejected droplets. Our calibrations work well for drops with radius larger than . Below that radius, our resolution is inadequate to obtain a reliable calibration. We used a syringe to deliver tiny droplets of the ethanol/ink fluid with known volume to white paper. By measuring the area of the stains created by these droplets we obtained the calibration curve in Fig.2. We checked the effect of droplet velocity on the stain area and found no significant effect within our experimental accuracy. By checking the shape of a stain, we can ascertain whether that spot was caused by a single ejectile or by two separate drops that landed in overlapping locations. We found less than overlapping stains. We excluded them from our distribution curves.
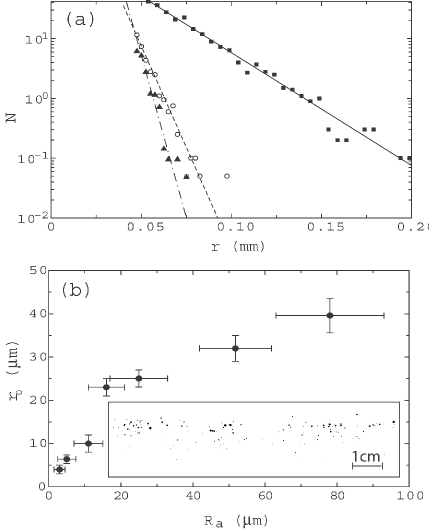
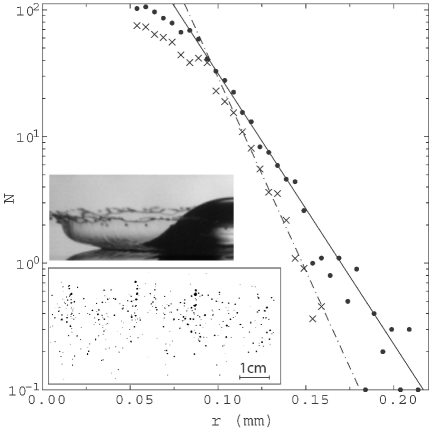
We first determine for prompt splashing on rough substrates. To ensure that these distributions are due solely to prompt splashing, we performed the measurements at low pressure. Fig. 3a shows for several values of roughness, . To obtain good statistics, each distribution is an average over ten to twenty experiments taken under the same conditions. We added the number of spots found in all the experiments and then divided the total counts by the number of experiments. The straight lines in the figure indicate that decays exponentially with a characteristic decay length, :
| (2) |
Fig. 3b shows that the decay length of these lines, , increases with increasing . At small , the decay length is close to the value of the roughness: . At large roughness, this relationship breaks down as appears to saturate at a constant value.
This behavior is consistent with the prompt splashing criteria, Eq. 1. When the roughness is small, the drop stops splashing at a film thickness determined by . This sets the correlation between the droplet decay length and roughness: . However, when the roughness is too large, the drop never stops splashing, and can only increase up to the maximum thickness of the expanding liquid film. From the photographs we estimate thickness . Fig. 3b shows that the saturation occurs at approximately , which is about the same order of magnitude as the thickness of the liquid film at its terminal position.
How robust is the decay length, , with respect to variations of
the impact velocity , drop size , or surface tension
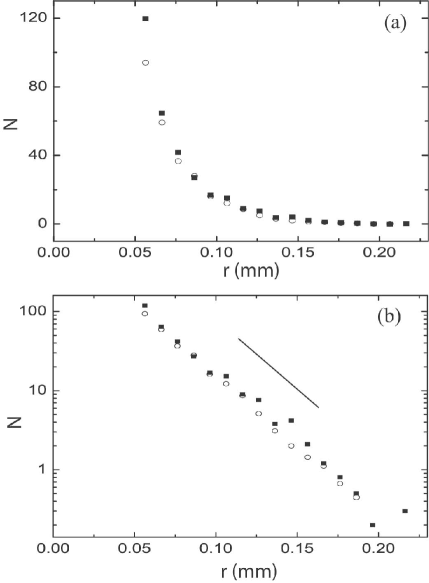
? In Fig. 4 we show the size distribution for two different
impact velocities: (, ) and
(, ). Fig. 4(a) shows that
there is significantly more splashing at higher impact velocity.
Fig. 4(b) plots the same data in log-linear format and shows that
both curves can be fitted by straight lines with the same decay
length, . This implies that is independent of .
Further experiments addressing other parameters should be done in
the future. Although the absolute value of might change with
those parameters, we expect that the two general features: (1) the
distribution decays exponentially and (2) increases with
surface roughness, would still be valid.
III. Size distribution of corona splashing
We have also performed measurements of the size distributions produced in a corona splash. This allows us to compare prompt and corona splashing. Fig. 5 shows the results of splashing on a smooth surface at two pressures, kPa and kPa, both in the high pressure regime. The inset shows the spots created by the droplets ejected from a single splash. The spots are randomly distributed. The main panel shows the distribution of droplet sizes, , for the two pressures. We again see an exponential distribution at large radius , , indicating the existence of a characteristic length scale. The values we find for (given in the caption of Fig. 5) are comparable to the corona thickness which we estimated from the movies to be between and . (The corona thickness was estimated by measuring the edge of the corona in pictures similar to the one shown in the inset to Fig. 5.) This suggests that the corona thickness determines . That decreases as the pressure decreases suggests that lower pressure leads to less splashing and a thinner corona. The data in Fig. 5 shows that the size-distribution data can probe the slight differences in the corona formed at the two pressures.
Both prompt and corona splashing have exponential distributions for
. Although there is a characteristic length scale in both
cases, the control parameters governing the length scales are
different: roughness in Fig. 3 and gas pressure in Fig. 5. However, at the threshold pressure 7 for the
corona splash on a smooth surface, there is a qualitatively
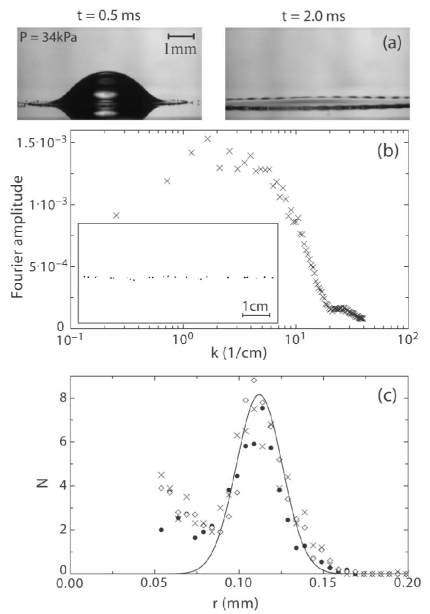
different distribution of droplet sizes. Fig. 6a shows there is no
corona and that discrete droplets emerge from the expanding liquid
which has periodic undulations along its rim. The ink spots shown in
the inset at the lower left corner of Fig. 6b have the striking
feature that they fall in a horizontal line, indicating that the ejected droplets
have the same angle between their trajectories and the substrate. In
addition, the spots are approximately equally spaced. The main
panel of Fig. 6b shows that the Fourier transform of the lateral
positions of the spots has a peak indicating this spatial order.
Moreover the spot sizes are more uniform than those seen at high
pressures in the inset to Fig. 5. Fig. 6c shows at pressures
close to . The peak at mm indicates that most
droplets are about the size of the rim undulations.
IV. Conclusions
By controlling the gas pressure and surface roughness we have identified two mechanisms for splashing: the surrounding gas is responsible for corona splashing and surface roughness is responsible for prompt splashing. This explains the long-standing puzzle about why two distinct types of splashes exist. We have also found that there are characteristic lengths in the distribution of ejected drops in both cases. Similar exponential dependence is found in ligament breakup, implying a possible connection with that process10 ; 11 . However, the exponential dependence of droplet sizes found in the splashing of liquids is in contrast to what is found in the shattering of a solid. In that case, there is a power-law distribution of sizes of the shattered fragments and no characteristic length scale12 ; 13 . The characteristic lengths we find in liquid splashing experiments reveal the microscopic length scales associated with the droplet creation process. On rough surfaces, the length scales we determine are consistent with our interpretation of the prompt splash in terms of the surface roughness. These results also suggest a means for controlling the sizes of ejected droplets in a splash.
Acknowledgement We wish to thank Qiti Guo, Priyanka Jindal, David Quéré, Mathilde Callies-Reyssat, and Wendy Zhang for helpful discussions. This work was supported by MRSEC DMR-0213745 and NSF DMR-0652269.
References
- (1) S. Sampath, X. Y. Jiang, J. Matejicek, A. C. Leger and A. Vardelle, Mater. Sci. Eng. A 272, 181 (1999).
- (2) K.R. Koederitz, M.R. Evers, G.B. Wilkinson and J.A. Drallmeier, Int. J. Engine Research 3, 37 (2003).
- (3) F.V. Shaw, Ceramic Bulletin 69, 1484 (1990).
- (4) A.M. Worthington, Proc. R. Soc. Lond. 25, 261 (1876-1877).
- (5) C. Mundo, M. Sommerfeld and C. Tropea, Int. J. Multiphase Flow 21, 151 (1995).
- (6) K. Range and F. Feuillebois, J. Colloid Interface Sci. 203, 16 (1998).
- (7) L. Xu, W. W. Zhang and S. R. Nagel, Phys. Rev. Lett. 94, 184505 (2005).
- (8) R. Rioboo, M. Marengo and C. Tropea, Atomization and Sprays 11, 155 (2001).
- (9) D. Richard, C. Clanet and D. Quéré, Nature 417, 811 (2002).
- (10) P. Marmottant and E. Villermaux, J. Fluid Mech. 498, 73 (2004).
- (11) E. Villermaux, P. Marmottant and J. Duplat, Phys. Rev. Lett. 92, 074501 (2004).
- (12) L. Oddershede, P. Dimon and J. Bohr, Phys. Rev. Lett. 71, 3107 (1993).
- (13) A. Meibom and I. Balslev, Phys. Rev. Lett. 76, 2492 (1996).