Rf-induced persistent long-range ordered structures in two-species ion Coulomb crystals in a linear Paul trap.
Abstract
We report on the observations of three-dimensional long-range ordered structures in the central 40Ca+ ion component of 40Ca+–44Ca+ two-species ion Coulomb crystals in a linear Paul trap. In contrast to long-range ordering previously observed in single species crystals, the structures observed are strikingly persistent and always of one specific type in one particular orientation. Molecular dynamics simulations strongly indicate that these characteristics are a hitherto unpredicted consequence of the co-axial cylindrical symmetry of the central ion component of the Coulomb crystal and the radio frequency quadrupole trapping field.
pacs:
32.80.Pj, 52.27.Jt, 52.27.Gr, 36.40.EiA solid state of an one-component plasma (OCP), often referred to as a Wigner crystal or a Coulomb crystal, appears whenever the coupling parameter , where is the nearest neighboring Coulomb potential energy and is the averaged kinetic energy of the particles, exceeds 200 Pollock and Hansen (1973); Schiffer (2002); Dubin (1989). In recent decades, such crystals have been investigated experimentally in a large variety of physical systems Birkl et al. (1992); Grimes and Adams (1979); Andrei et al. (1988); Thomas et al. (1994). In particular, laser-cooled and trapped atomic ions have proven to be an excellent system for experimental studies of Coulomb crystals under various confinement conditions. Single-species, one-, two- and three-dimensional ion Coulomb crystals have been investigated in Penning and radio frequency (rf) traps (also named Paul traps), with structural findings in good agreement with theoretical predictions Birkl et al. (1992); Drewsen et al. (1998); Hornekær et al. (2001); Schätz et al. (2001); Mitchell et al. (1998); Itano et al. (1998); Mortensen et al. (2006). Two-species crystals have been studied in much less detail, and experimentally mainly in linear Paul traps Hornekær et al. (2001); Blythe et al. (2005). For singly charged ions in such traps, the lighter species will in general segregate into a cylindrically shaped structure surrounded by the heavier ion species. In the case of 40Ca+ and 24Mg+ ions, the structures of the lighter species Hornekær et al. (2001) were found for the most part to be identical to the cylindrical structures of infinitely long one-species systems confined in two-dimensions by a rotational-symmetric harmonic potential Hasse and Schiffer (1990). For two ion species with identical charge-to-mass ratios, mixing of the species is predicted Matthey et al. (2003). At present, Coulomb crystals find applications in such diverse fields as quantum computing Riebe et al. (2004); Barrett et al. (2004) and cold molecule ion research Mølhave and Drewsen (2000); Blythe et al. (2005); Bertelsen et al. (2006).
In this Letter, we present observations of persistent long-range ordered structures in the 40Ca+ component of bicrystals consisting of 40Ca+ and 44Ca+ ions. The observed structures deviate from those expected to exist in a fully rotational symmetric harmonic potential Hornekær et al. (2001); Hasse and Schiffer (1990), but are in close agreement with results from molecular dynamics (MD) simulations including the quadrupole nature of the trapping fields.
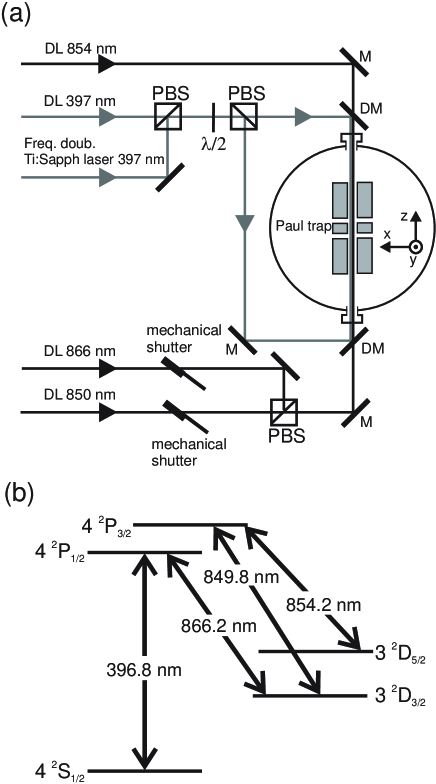
The Ca+ ions are confined in a linear Paul trap which is situated in a vacuum chamber at a pressure of Torr, and are laser cooled as depicted in Fig. 1(a). The Paul trap used in these experiments has been described in detail elsewhere Drewsen et al. (2003). In short, the linear Paul trap consists of four electrode rods placed in a quadrupole configuration. The electrode diameter is 8.0 mm and the minimum distance of the central trap axis is mm. Time varying voltages and are applied to the two sets of diagonally opposite electrode rods, respectively, to obtain confinement in the radial plane (-plane in Fig. 1(a)). Axial confinement along the -axis is accomplished by sectioning each of the electrode rods into three pieces and then applying a static voltage to the end-electrodes. The length of the center-electrode is 5.4 mm, while the outer pieces are 20 mm. In the present experiments MHz, V and 10–50 V were used. The resulting confinement for an ion species of type with mass and charge is often approximated by a harmonic pseudo potential , where and are the radial and axial trap frequencies, respectively. The axial trap frequency is given by , where m-2 is a constant related to trap geometry, and the radial trap frequency is given by , where is the contribution from the time varying quadrupole fields. The dependence on the charge and mass of the ion species makes the lighter isotope (40Ca+) more tightly bound towards the trap axis than the heavier (44Ca+) and leads consequently to a total radial separation of the two ion species when sufficiently cooled Hornekær et al. (2001). The zero-temperature ion density in the pseudopotential is given by , where is the vacuum permittivity Hornekær et al. (2001). Due to the spatial separation of the ions in two-species ion Coulomb crystals, this expression is also applicable to the individual components of such crystals.
The 40Ca+ and 44Ca+ ions used in the experiments are produced isotope selectively by resonant two-photon photo-ionization of atoms in an effusive beam of naturally abundant calcium Kjærgaard et al. (2000); Mortensen et al. (2004). In Fig. 1(b), the transitions in Ca+ used for Doppler laser cooling of the trapped ions are shown. The main cooling transition is the dipole allowed transition at 397 nm. To avoid optical pumping into the metastable state, repumping is done either by using a single repump laser at 866 nm via the state (44Ca+) or by using two repump lasers at 850 nm and 854 nm via the state (40Ca+). Due to the isotope shifts of the cooling transitions Mårtensson-Pendrill et al. (1992); Alt et al. (1997), each isotope ion requires its own laser cooling frequencies. For both isotopes the final temperature is of the order of 10 mK, which is low enough for achieving Coulomb crystallization ( Schiffer (2002)). Imaging of the fluorescence from the trapped ions is achieved using an image intensified CCD camera placed above the trap.
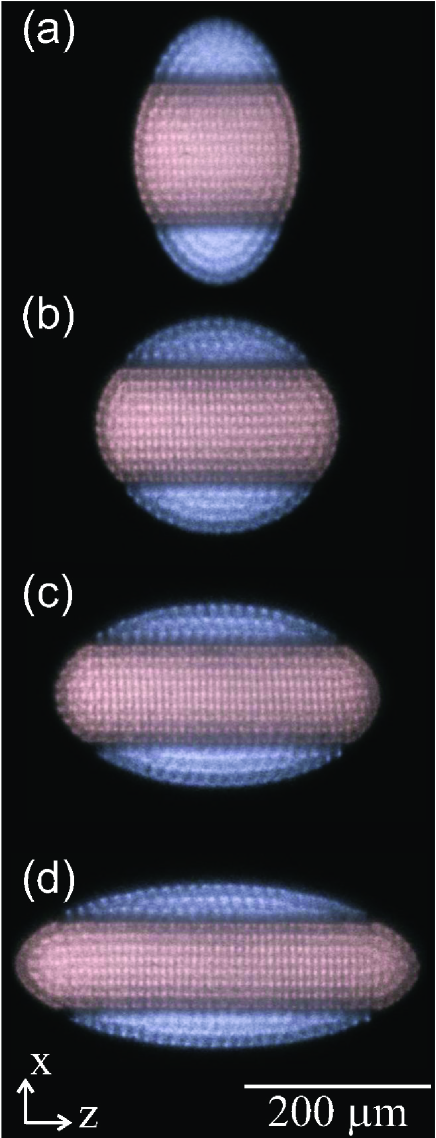
Images of two-species Coulomb crystals consisting of 40Ca+ and 44Ca+ ions are presented in Fig. 2 for various settings of the static voltage on the end-electrodes. Since the ions are only fluorescing when they are directly laser cooled, the two isotopes can be imaged separately by alternatingly blocking (about 1 Hz rep. rate) the 850 nm (40Ca+ laser cooling off) and the 866 nm laser (44Ca+ laser cooling off) using mechanical shutters. The presented combined images are subsequently created with a red color coding for 40Ca+ and blue for 44Ca+. Due to sympathetic cooling Larson et al. (1986); Bowe et al. (1999), the crystal retains its shape and structure during the alternating laser cooling sequence. As expected Hornekær et al. (2001), the lightest isotope 40Ca+ is located as a cylindrical core closest to the trap axis, surrounded by the heavier 44Ca+. It is immediately clear from the images in Fig. 2 that the projection of the actual three-dimensional structure of the 40Ca+ ions is a two-dimensional rectangular lattice aligned with the trap axis. Since the depth of focus of the imaging system (50 m) is several times the inter-ion distance, we conclude the rectangular structure in the images must originate from a three-dimensional long-range ordering Mortensen et al. (2006). In contrast to our previous observations of long-range order in spherical one-component ion crystals Mortensen et al. (2006), where the orientation of the observed metastable (100 ms) structures seemed to be arbitrary, the rectangular structures presented here are very persistent (10 s) and always oriented the same way. Accordingly, the presence of the surrounding 44Ca+ ions apparently has significant influence on the formation and appearance of the observed long range structure in the 40Ca+ part of the crystal. The image sequence in Fig. 2 illustrates additionally that despite changes in the outer shape of the 40Ca+ core, the observed rectangular lattice of the ions is preserved, indicating that the observed long-range ordered structure is rather stable to changes in the boundary conditions of the crystal.

In order to understand the observations, a series of molecular dynamics (MD) simulations of two-species crystals with the same number of the two calcium isotope ions as in the crystals shown in Fig. 2 have been performed. In Figs. 3(a) and 3(b), results from one simulation using a pseudo-potential corresponding to the trapping parameters of Fig. 2(b) is presented. As in the experiments, a clear radial separation of the two isotope ions is observed. Furthermore the radial projection (Fig. 3(a)) clearly reveals that the 40Ca+ part of the crystal is organized in concentric cylindrical structures, resembling the structure of an infinitely long 1D cylindrically symmetric confined ion crystal Hasse and Schiffer (1990); Hornekær et al. (2001). In Fig. 3(b), a projection corresponding to the focal region of the imaging system is shown. Neither this nor other sections, e.g., in the -plane, lead to projection images with rectangular structures. However, when the full rf potential is used in the MD simulations, some regular ordering in the central component of the crystal does appear, as is evident from the results presented in Figs. 3(c) and 3(d) for a specific phase of the rf field. From Fig. 3(d), it is seen that indeed a rectangular projection image is expected when the rf-quadrupole field, which breaks the rotational symmetry, is included in the simulations. Even when averaging over all phases of the rf field, the rectangular structure persists. However, some blurring of the position of the ions along the -axis, as is seen in the images of Fig. 2, is found. Analysis of a much simpler two-ion system in a linear rf trap has previously shown similar preferred orientation effects with respect to the rf quadrupole field axes Drewsen and Brøner (2000).

A closer analysis of the simulation results presented in Figs. 3(c) and 3(d) shows that the 40Ca+ ions in the core organize themselves in a long-range ordered structure in the form of a face-centered tetragonal (fct) lattice as illustrated in Fig. 4(a), with the sidelengths related by . The rectangular projection presented in Fig. 3(d) is obtained when the fct structure is viewed along the vector as illustrated in Fig. 4(b). This rectangular projection has a height to width ratio of , which is not exactly the same as the observed in the experiments. In fact, the observed rectangular structure is more in agreement with a face-centered cubic (fcc) structure viewed along the [211] direction (see Figs. 4(c) and 4(d)), which would lead to . The reason for the deviation between the simulated results and the actually observed structures is probably that the difference in the potential energies of the two structures in the rf potential is very small, as is well-known to be the case for various long-range ordered structures in infinite systems without the presence of rf fields Dubin (1989). In recent single component experiments both body-centered cubic (bcc) and fcc-like structures were indeed observed Mortensen et al. (2006), but in contrast to the two-species results above, no fixed orientation with respect to the trap axis was found. Another point supporting that the observed structure is a fcc structure is the ion density. Assuming that the observed projection images of 40Ca+ ions in Fig. 2 are actually fcc structures observed along the [211] direction, the ion density must be cm-3. In comparison, the 40Ca+ ion density calculated from the trap parameters is , in good agreement with the fcc assumption.
Very stable aligned crystal structures as those discussed above, may find many future applications. For instance, for cavity QED studies, the situation where the axial periodicity of the Coulomb crystal is an integer multiple of the node spacing of the standing wave cavity field is very interesting, since the effective coupling of the atomic ensemble to the light field can be controlled by shifting the position of the whole crystal.
In conclusion, very persistent three-dimensional long-range ordered structures with one specific orientation have been observed in two-species ion Coulomb crystals in a linear Paul trap. MD simulations strongly indicate that these characteristics are a consequence of the co-axial cylindrical symmetry of the central ion component of the Coulomb crystal and the radio frequency quadrupole trapping field.
We acknowledge financial support from the Carlsberg Foundation.
References
- Pollock and Hansen (1973) E. L. Pollock and J. P. Hansen, Phys. Rev. A 8, 3110 (1973).
- Schiffer (2002) J. P. Schiffer, Phys. Rev. Lett. 88, 205003 (2002).
- Dubin (1989) D. H. E. Dubin, Phys. Rev. A 40, 1140 (1989).
- Birkl et al. (1992) G. Birkl, S. Kassner, and H. Walther, Nature 357, 310 (1992).
- Grimes and Adams (1979) C. C. Grimes and G. Adams, Phys. Rev. Lett. 42, 795 (1979).
- Andrei et al. (1988) E. Y. Andrei, G. Deville, D. C. Glattli, F. I. B. Williams, E. Paris, and B. Etienne, Phys. Rev. Lett. 60, 2765 (1988).
- Thomas et al. (1994) H. Thomas, G. E. Morfill, V. Demmel, J. Goree, B. Feuerbacher, and D. Möhlmann, Phys. Rev. Lett. 73, 652 (1994).
- Mortensen et al. (2006) A. Mortensen, E. Nielsen, T. Matthey, and M. Drewsen, Phys. Rev. Lett. 96, 103001 (2006).
- Drewsen et al. (1998) M. Drewsen, C. Brodersen, L. Hornekær, J. S. Hangst, and J. P. Schiffer, Phys. Rev. Lett. 81, 2878 (1998).
- Schätz et al. (2001) T. Schätz, U. Schramm, and D. Habs, Nature 412, 717 (2001).
- Mitchell et al. (1998) T. B. Mitchell, J. J. Bollinger, D. H. E. Dubin, X.-P. Huang, W. M. Itano, and R. H. Baughman, Science 282, 1290 (1998).
- Itano et al. (1998) W. M. Itano, J. J. Bollinger, J. N. Tan, B. Jelenković, X.-P. Huang, and D. J. Wineland, Science 279, 686 (1998).
- Hornekær et al. (2001) L. Hornekær, N. Kjærgaard, A. M. Thommesen, and M. Drewsen, Phys. Rev. Lett. 86, 1994 (2001).
- Blythe et al. (2005) P. Blythe, B. Roth, U. Frohlich, H. Wenz, and S. Schiller, Phys. Rev. Lett. 95, 183002 (2005).
- Hasse and Schiffer (1990) R. W. Hasse and J. P. Schiffer, Ann. Phys. 203, 419 (1990).
- Matthey et al. (2003) T. Matthey, J. P. Hansen, and M. Drewsen, Phys. Rev. Lett. 91, 165001 (2003).
- Riebe et al. (2004) M. Riebe, H. Häffner, C. F. Roos, W. Hänsel, J. Benhelm, G. P. T. Lancaster, T. W. Körber, C. Becher, F. Schmidt-Kaler, D. F. V. James, et al., Nature 429, 734 (2004).
- Barrett et al. (2004) M. D. Barrett, J. Chiaverini, T. Schaetz, J. Britton, W. M. Itano, J. D. Jost, E. Knill, C. Langer, C. Leibfried, R. Ozeri, et al., Nature 429, 737 (2004).
- Mølhave and Drewsen (2000) K. Mølhave and M. Drewsen, Phys. Rev. A 62, 011401(R) (2000).
- Bertelsen et al. (2006) A. Bertelsen, S. Jørgensen, and M. Drewsen, Journal of Physics B: Atomic, Molecular and Optical Physics 39, L83 (2006).
- Drewsen et al. (2003) M. Drewsen, I. Jensen, J. Lindballe, N. Nissen, R. Martinussen, A. Mortensen, P. Staanum, and D. Voigt, Int. J. Mass Spectrom. 229, 83 (2003).
- Kjærgaard et al. (2000) N. Kjærgaard, L. Hornekær, A. Thommesen, Z. Videsen, and M. Drewsen, Appl. Phys. B 71, 207 (2000).
- Mortensen et al. (2004) A. Mortensen, J. J. T. Lindballe, I. S. Jensen, P. Staanum, D. Voigt, and M. Drewsen, Phys. Rev. A 69, 042502 (2004).
- Mårtensson-Pendrill et al. (1992) A.-M. Mårtensson-Pendrill, A. Ynnerman, H. Warston, L. Vermeeren, R. E. Silverans, A. Klein, R. Neugart, C. Schulz, P. Lievens, and The ISOLDE Collaboration, Phys. Rev. A 45, 4675 (1992).
- Alt et al. (1997) W. Alt, M. Block, V. Schmidt, T. Nakamura, P. Seibert, X. Chu, and G. Werth, J. Phys. B 30, L677 (1997).
- Larson et al. (1986) D. J. Larson, J. C. Bergquist, J. J. Bollinger, W. M. Itano, and D. J. Wineland, Phys. Rev. Lett. 57, 70 (1986).
- Bowe et al. (1999) P. Bowe, L. Hornekær, C. Brodersen, M. Drewsen, J. S. Hangst, and J. P. Schiffer, Phys. Rev. Lett. 82, 2071 (1999).
- Drewsen and Brøner (2000) M. Drewsen and A. Brøner, Phys. Rev. A 62, 045401 (2000).