Correlation of worldwide markets’ entropies: time-scale approach
Abstract
We use a new method of studying the Hurst exponent with time and scale dependency. This new approach allow us to recover the major events affecting worldwide markets (such as the September 11th terrorist attack) and analyze the way those effects propagate through the different scales. The time-scale dependence of the referred measures demonstrates the relevance of entropy measures in distinguishing the several characteristics of market indices: "effects" include early awareness, patterns of evolution as well as comparative behaviour distinctions in emergent/established markets.
pacs:
89.65.Gh, 05.40.-a, 05.40.FbI Introduction
I.1 Goals
The goal of this study is the analysis of stock exchange world indices searching for signs of coherence and/or synchronization across the set of studied markets.
We have expanded the scope of previous work on the PSI-20 (Portuguese Standard Index), since results there Matos2004 seemed to provide a basis for a wider ranging study of coherence and entropy.
With that purpose we applied econophysics techniques related to measures of “disorder”/complexity (entropy) and a newly proposed Matos2006 generalization of Detrended Fluctuation Analysis. As a measure of coherence among a selected set of markets we have studied the eigenvalues of the correlation matrices for two different set of markets, exploring the dichotomy represented by emerging and mature markets.
The data used in this study was taken daily for a set of worldwide market indices. As it is usual in this kind of analysis Mantegna2000 we base our results on the study of log returns where is the log return at time step .
II Entropy
The Shannon entropy for blocks of size for an alphabet of symbols is Shannon1948
| (1) |
the entropy of the source is then
| (2) |
This definition is attractive for several reasons: it is easy to calculate and it is well defined for a source of symbol strings. In the particular case of returns, if we choose a symmetrical partition we know that half of the symbols represent losses and half of the symbols represent gains. If the sequence is predictable, we have the same losses and gains sequences repeated everytime, the entropy will be lower; if however all sequences are equally probable the uncertainty will be higher and so it will be the entropy. Entropy is thus a good measure of uncertainty.
This particular method has problems, the entropy depends on the choice of encoding and it is not a unique characteristic for the underlying continuous time series. Also since the number of possible states grows exponentially with , after a short number of sequences in practical terms it will become difficult to find a sequence that repeats itself. This entropy is not invariant under smooth coordinate changes, both in time and encoding. This is a strong handicap for its adoption into financial time series study.
We have applied the Shannon entropy for blocks of size and an alphabet of symbols, to a set of markets previously studied. We should recall that using blocks of size corresponds to a week in trading time. Notice also that we have only considered trading days, like what we do in all other analysis, so we ignore any holidays or days where the market was closed.
It should be noted that results are robust to the choice of the total number of bins (the size of our alphabet). That is, we have repeated the analysis with a different choice of the number of partitions yielding similar results.
In order to enhance the time dependence of results we have evaluated the entropy of the set for periods of trading days (roughly corresponding to half a year). The motivation for this analysis is to study the time evolution of entropy.

The results displayed in Figure 1 show improved coherence (i.e. reduced entropy) after as compared with previous periods for all markets. Higher entropy implies less predictability, in general, although the nature of shocks qualifies this statement to some extent. The notable feature of this graphic is that both mature and developing markets are affected similarly which suggests that global behaviour patterns are becoming more coherent or linked because of the progressive globalisation of markets. This is in line with the findings of Matos2006 where we found the Hurst exponent for different markets to be decreasing with time.
III Time and Scale Hurst exponent
III.1 Method characterisation
The general idea behind this method is the study of the Hurst exponent as a function of both time and scale. In practical terms this method is a simple expansion of the “windowed” DFA applied in Matos2004 . Instead of fixing we let it be a variable. The Hurst exponent, , for time and scale , is evaluated as the Hurst exponent obtained using the DFA Peng1994 , for the interval .
Implications are wider than for a simple DFA. The general idea is to essentially invert the process and take as the focus of the analysis with the DFA being an implementation detail. The other candidate to evaluate the Hurst exponent in the sub-intervals is the wavelet Percival2000 . In both cases is recovered as a power of the scale, inside each sub-interval.
Recalling the most important equation in DFA we have the detrended fluctuation function as:
where is the Hurst exponent.
From the above condition we know that , where is the time series length. In what follows the maximum scale we consider is as for large scales we essentially recover the Hurst exponent for the whole series.
A major concern in this work was to guarantee that exponents obtained through DFA were meaningful. For that reason we have used the same procedure as in Matos2004 , we have controlled the quality of the fits assuring that the regression coefficients of the linear least squares fits were near unity for all studied markets. If we would not do this, the results would be unreliable, since the underlying time series is not well described by a fractional Brownian motion. To this combination of the DFA with time and scale dependency, we apply the term TSDFA (Time and Scale DFA).
III.2 Examples
Here we study some examples of the technique applied to several international markets. We choose these because they display details that are either unique or shared with other markets and contribute to understand the differences and similarities that TSDFA emphasises.
Traditionally we distinguish between developed and emergent markets, the distinction varies depending on the source and of the applied criteria. A more in depth discussion of this issue is found in Section IV.
III.2.1 Nikkei
As an illustration of the method we worked with Nikkei data ranging from 1990 to 2005. Nikkei was chosen because it is a well known and studied financial index.
The graph resulting from application of the TSDFA method is shown in Figure 2.
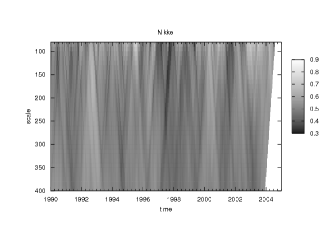
The graphic represents as a contour plot, with exponents in range , the series studied from and the scale between and trading days. In this work we adopted these fixed ranges since this representation permits ready comparison with other indices calculated.
In the Nikkei graphic (Figure 2) we can see that persistence is exhibited with the index normally around This reflects a healthy borderline, of values near , and is to be expected since Nikkei is a mature market. In recent years we see a stripe that crosses all scales in year , at the same time as the DotCom crash.
We have another stripe that starts in the fourth quarter of but does not go through all scales. Another period of high values of starts for short scales in the third quarter of , after a global crash and reaches large scales in .
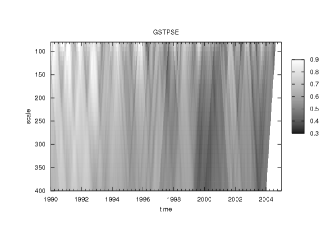
III.2.2 GSTPSE (Canada)
As seen in Figure 2, the market shows two distinct periods, before and after . Before we see high values of Hurst exponent over all scales. After that time, all the regions of high Hurst exponents are bounded in time and the background turns out to be what we expect from a mature market, with the Hurst exponent around .
There are two stripes, for high values of , after that cross all scales, one in and another starting around September and travelling forward for higher scales in time.
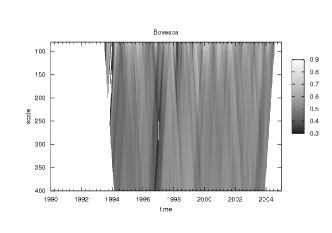
III.2.3 Bovespa (Brazil)
Bovespa, the São Paulo Stock Exchange Index, is known for its high volatility and is generally considered an emergent market. In Figure 2 we see an erratic behaviour with either near or above and the corresponding stripes crossing together, back and forward in time, at all scales. There are two stripes, for high values of , that start from short scales respectively in (Asian crashes) and (global crash) which merge for large scales. There is another, for , stripe that walks through all scales and starts for short scales around September .
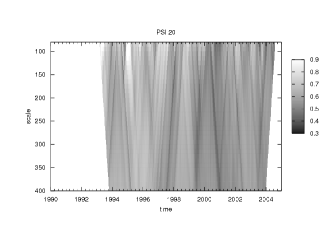
III.2.4 PSI-20 (Portugal)
Unmodified DFA, the predecessor of TSDFA, was applied to PSI-20 in Matos2004 . In Figure 2 we see the results of applying TSDFA to this market, from establishment of series in .
Initial stages are both antipersistent and subject to extreme values of the Hurst exponent. We can identify two stripes with a stable (higher) value of the Hurst exponent, during , and another walking forward in time starting, for short scales, next to September . Notice that this stripe is so strong that it overlaps other stripes forming in the neighbourhood.
The overall strength of the TSDFA is to provide further conclusions over those drawn earlier concerning the market progression to mature behaviour and its responses times, clearly different from the initial position.
III.3 Features
As can be seen in Figure 2 there are several notable features of the plots produced by TSDFA:
-
•
We can distinguish mature markets by the persistence and stability of values around , most of the time.
-
•
We can distinguish emergent markets by the persistence and stability of values above .
-
•
For some periods, a phase transition appears to occur, sometimes observable across all scales, sometimes across partial scales only. This is reflected in the spikes which either point to lower or to large scales;
-
•
A priori, we expected smooth variations of for large scales since we are taking into account more data values and therefore we expect greater robustness to sudden changes of the data. This was already observed in the results obtained for PSI-20 and is confirmed by all the examples.
-
•
Markets evolve in time, the Canadian case is a notable example of this, where we observe a shift from emergent to mature features. Although not so dramatic for all other cases we see over time a decrease in the values of the Hurst exponent.
-
•
There are events that change the Hurst exponent behaviour that can be seen in most/all markets. The September 11th 2001 is the most striking case that can be seen in all Figures.
-
•
Clearly, the behaviour is dependent both on time and scale, indicative of the multifractal background, so that details obtained are richer than those obtained by calculation of the Hurst exponent directly. This is to be expected since the Hurst exponent is a summary measure, or index, of the data and this is the observed behaviour for financial markets (see Lux2004 ).
IV Results
IV.1 Classification of global markets
The classification of markets into mature or emergent is not a simple issue. The International Finance Corporation (IFC) uses income per capita and market capitalisation relative to GNP for classifying equitity markets. If either 1) a market resides in a low or middle-income economy, or 2) the ratio of the investable market capitalisation to GNP is low, then the IFC classifies the market as emerging, otherwise the classification is mature.
It seems clear from the results, obtained from TSDFA, that we can distinguish different markets classes. The difference in behaviour is visible with the application of TSDFA. The most active, and mature, markets show a persistence of behaviour near while the newer, emergent, markets show a persistence of higher values of . The diversity of behaviours does not stop here, there are markets which show an hybrid behaviour between these two states.
The classification that we propose has thus three states:
- (clearly) mature
-
these market have a persistence of around . The presence of regions with higher values of is limited to small periods and is well defined both in time and scale.
- (clearly) emergent
-
these market have a persistence of well above . The presence of regions with values of around is well defined both in time and scale.
- hybrid
-
unlike the two previous case the distinction between the mature and emergent phases is not well determined, with the behaviour seemingly mixing at all scales.
IV.2 Data
We have considered, in this study, the major and most active markets worldwide from America (North and South), Asia, Africa, Europe and Oceania. All the data on the respective market indices is public and came from Yahoo Finance (finance.yahoo.com). We have considered the daily closure as the value for the day, to obviate any time zone difficulties.
The choice of the markets used in this study was driven by the goal of studying major markets across the world in an effort to ensure that tests and conclusions could be as general as possible. Hence from the results we have divided the markets according to mature: AEX General (Netherlands); Dow Jones (U.S.); CAC 40 (France); FTSE 100 (United Kingdom); DAX (Germany); S&P 500 Index (U.S.); Nasdaq (U.S.); Seoul Composite (South Korea); Nikkei 225 (Japan); NYSE Composite Index (United States) and Stockholm General (Sweden). The list of hybrid markets is smaller: All Ordinaries (Australia); Bovespa (Brazil); S&P TSX Composite (Canada); NZSE 10 (New Zealand); Madrid General (Spain) and Swiss Market (Switzerland).
All the other markets from our study behave as emergent: ATX (Austria); BEL-20 (Belgium); BSE 30 (India); CMA (Egypt); All Share (Sri Lanka); Hang Seng (Hong Kong); IPSA (Chile); ISEC Small Cap (Ireland); ISEC Small Cap Techno (Ireland); Irish SE Index (Ireland); Jakarta Composite (Indonesia); KFX (Denmark); KLSE Composite (Malaysia); Karachi 100 (Pakistan); MerVal (Argentina); MIBTel (Italy); IPC (Mexico); OSE All Share (Norway); PSE Composite (Philippines); PSI 20 (Portugal); PX50 (Czech Republic); Shanghai Composite (China); Straits Times (Singapore); TA-100 (Israel); Taiwan Weighted (Taiwan) and ISE National-100 (Turkey).
V Conclusions
We applied the TSDFA (Time and Scale Detrended Fluctuation Analysis) to study each market evolution in time and sometimes, as seen in some markets, we observe a switch from developed to mature state. TSDFA is used to compare the results of sets of markets and to establish classes that display similar behaviour at any given time. This classification allow us to distinguish events that affect several markets from other local occurrences that only affect a single market as well as some events that are reflected worldwide (the Asian tigers crashes, the 9/11 already cited above, the Madrid bomb attack in 2004, among others). The resulting classification is in agreement with another based on wavelet analysis proposed in SRC+06 .
One of the interesting outcomes is that, in spite of the results showing differences between known emergent markets and established ones, we found convergence of entropy behaviour in recent years among the worldwide markets studied. We have found that more and more markets exhibit a more mature behaviour. A plausible explanation for this phenomenon is the progressive globalization of financial markets.
References
- [1] T. Lux. Detecting Multi-Fractal Properties in Asset Returns: An Assessment of the ’Scaling Estimator’. International Journal of Modern Physics, 15:481 – 491, 2004.
- [2] R.N. Mantegna and H.E. Stanley. An Introduction to Econophysics. Cambridge University Press, Cambridge, 2000.
- [3] J.A.O. Matos, S.M.A. Gama, H.J. Ruskin, and J.A.M.S. Duarte. An econophysics approach to the Portuguese Stock Index–PSI-20. Physica A, 342(3-4):665–676, 2004.
- [4] J.A.O. Matos, S.M.A. Gama, A. Sharkasi, H.J. Ruskin, and M. Crane. Temporal and Scale DFA Applied to Stock Markets. In preparation, 2006.
- [5] C.-K. Peng, S.V. Buldyrev, S. Havlin, M. Simons, H.E. Stanley, and A.L. Golderberger. On the mosaic organization of DNA sequences. Phys. Rev. E, 49:1685–1689, 1994.
- [6] D. Percival and A. Walden. Wavelet methods for time series analysis. Cambridge University Press, 2000.
- [7] C. Shannon. A mathematical theory of communication. Bell System Technical Journal, 27:379–423, 1948.
- [8] A. Sharkasi, H.J. Ruskin, M. Crane, J.A.O. Matos, and S.M.A. Gama. A wavelet-based method to measure stages of stock market development. In preparation, 2006.