Evidence of Increment of Efficiency of the Mexican Stock Market Through the Analysis of its Variations
Abstract
It is well known that there exist statistical and structural differences between the stock markets of developed and emerging countries. In this work, we present an analysis of the variations and autocorrelations of the Mexican Stock Market index (IPC) for different periods of its historical daily data, showing evidence that the Mexican Stock Market has been increasing its efficiency in recent times. We have analyzed the returns autocorrelation function (ACF) and used detrended fluctuation analysis (DFA) methods. We also analyze the volatility of the IPC and the Dow Jones Industrial Average (DJIA) and compare their evolution. The data samples analyzed here, correspond to daily values of the IPC and DJIA for the period 10/30/1978 to 02/28/2006.
keywords:
Econophysics , Market Efficiency , Emerging Market , Returns , Autocorrelation Function (ACF) , Detrended Fluctuation Analysis , VolatilityPACS:
02.50.-r , 02.50.Ng , 89.65.Gh , 89.90.+n, , , url]www.mda.cinvestav.mx
1 Introduction
Several empirical studies of worldwide financial time series have produced very interesting and important results under both theoretical and practical points of view [1, 2, 3, 4, 5]. Examples are the determination of the power law character of the distribution of the variation of assets returns; temporal autocorrelations of returns decaying to zero in a few minutes following a random walk process and very long nonlinear correlations for their absolute returns (long term memory of the volatility of returns). These statistical properties are part of the so-called “stylized facts” of financial markets [6, 7]. Also, many studies have been carried to test the Efficient Market Hypothesis [8]. It establishes that at any given time, the prices of traded assets fully and instantly reflect all available information reaching the market, and the market is said to be efficient. Nowadays it is clear that a completly efficient market is only an idealization and that different markets have different degrees of efficiency. However, more recent empirical studies seem to show that financial markets are evolving and increasing their efficiency over time [9, 10].
It is well known that emerging stock markets display different structural and statistical properties111The later reflect the former with regard to those belonging to developed countries. Among them, we can mention the following structural differences: higher sensitivity to capital flows, slower reaction to new information and a bigger effect of nonsynchronous trading on the prices. Among the statistical differences we have: emerging markets are more volatile, with higher average returns, slower autocorrelation function decrements and bigger Hurst exponents [11, 12, 13, 14, 15, 16]. All of the above can be described in economic terms saying that emerging markets are “less efficient” than well established stock markets. In this work we use the Dow Jones Industrial Average (DJIA) index as a benchmark, and study the autocorrelations and other statistical properties of the Mexican stock market, which can be considered as a relatively new222Even if some stock transactions started in México in 1895, the Mexican stock market only became well established, public and regulated until 1975. and emerging stock market. Using the above techniques we are able to show that there is good evidence that the Mexican stock market has been increasing its efficiency in recent years.
This paper is organized as follows: In section 2, an analysis of the ACF for different time periods of the IPC is presented and compared with those of the DJIA, showing that the Mexican index ACF time decay is becoming shorter and the amplitude of the ACF fluctuations smaller. In section 3, we applied the Detrended Fluctuation Analysis (DFA) statistical method to the IPC and DJIA returns series. A comparative analysis gives a signal suggesting maturation and more efficient behavior of the IPC. In section 4, a volatility analysis shows how the volatility of IPC has decreased steadily in time and particularly in the last 3 years has become comparable to that of the DJIA. Also in this section a trend analysis of both IPC and DJIA mean value and standard deviation is performed, showing that IPC variations evolve to tie those of the DJIA. Finally a summary of all results and conclusions derived from this work is presented in the last section of this paper.
2 Autocorrelation Function of the IPC variations for different time periods
In this study, we analyze the IPC and DJIA returns defined as: , where is the value of the index at time and = 1 trading day. Since we lack high frequency data for the IPC, we have used daily values in our analysis. Despite this fact, we show that there is clear evidence of the evolution towards maturity and increment of efficiency of the IPC index, as is shown below.
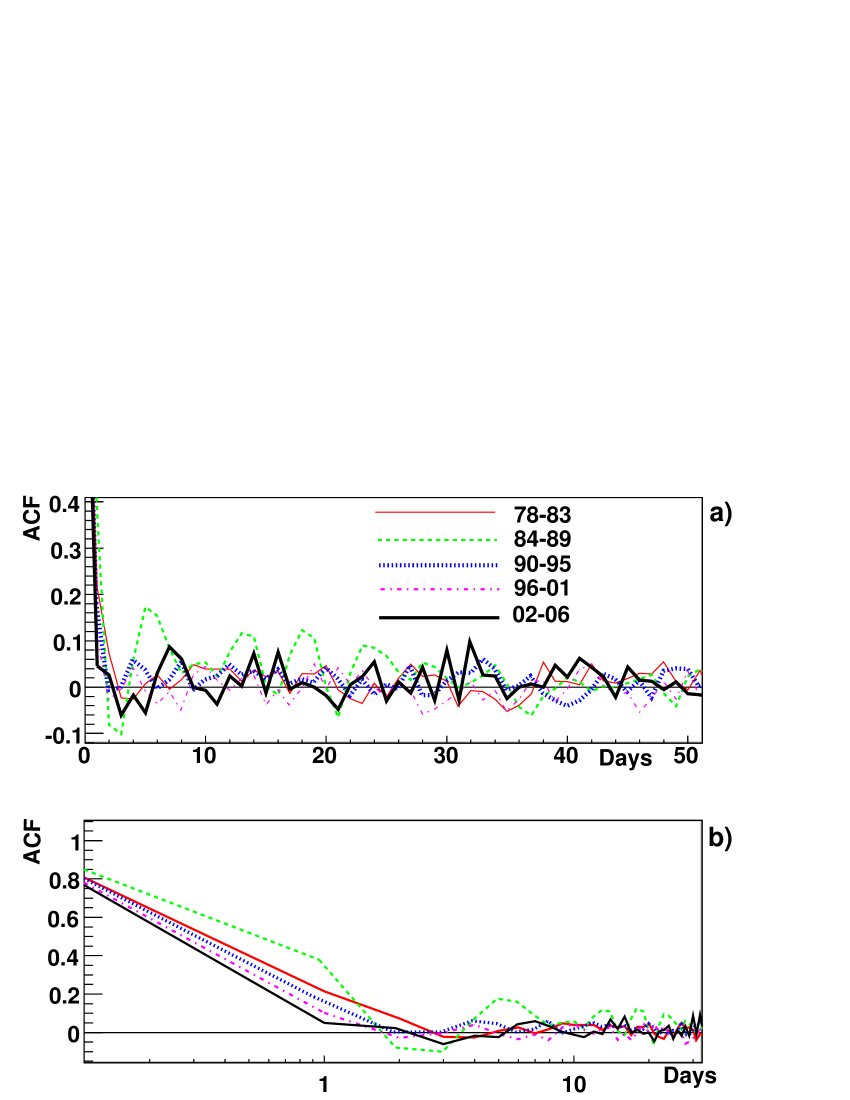
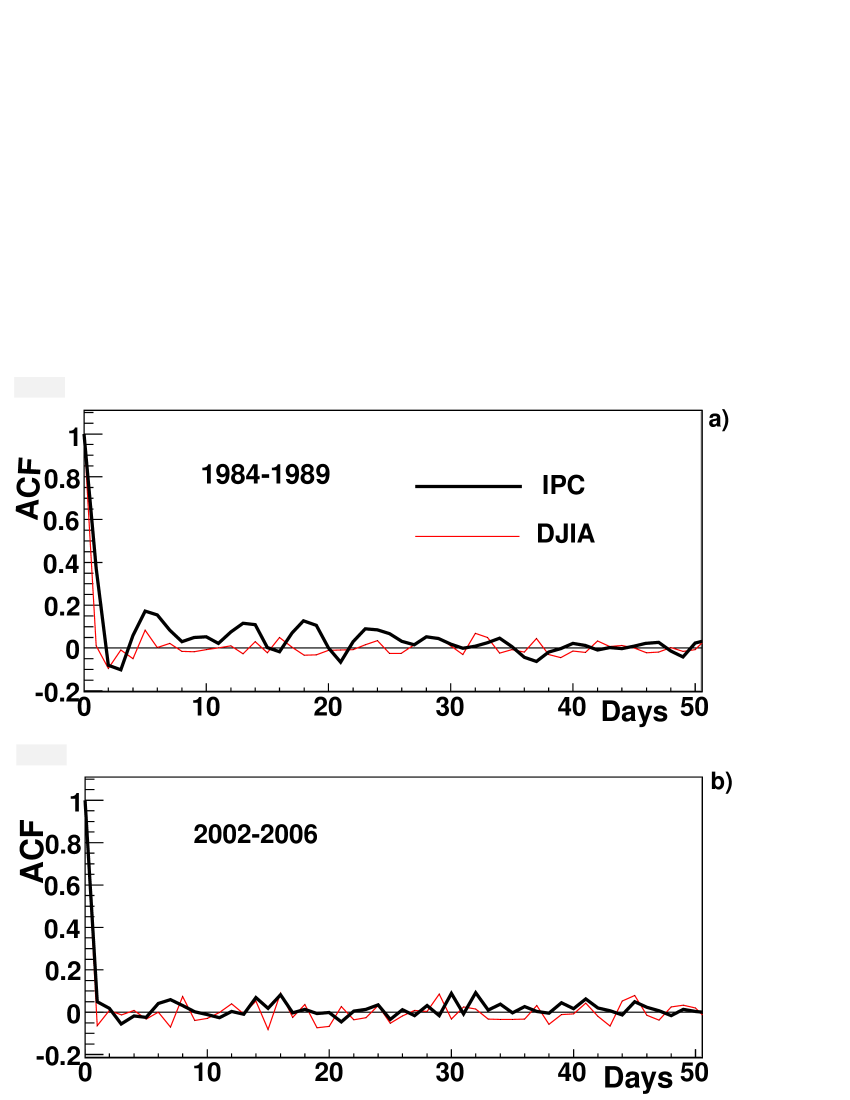
The IPC data sample covers the period from 10/30/1978 to 02/28/2006 and was divided in 5 subperiods of about 6 years each: 1978-1983, 1984-1989, 1990-1995, 1996-2001 and 2002-2006. We calculated the returns ACF for each one of these subperiods and show them in the figure 1a). In figure 1b) we can see the same data with a time-log scale. There is a clear tendency for the ACF to decrease faster over time. In figure 2a), we compare the IPC returns ACF for the period 1984-1989 with the DJIA returns ACF for the same period. We can observe that the amplitude of the fluctuations of the IPC decays to a noise level more slowly when compared to the DJIA. Moreover, some kind of periodical amplitude fluctuations can be seen, with a period of about 8 days decaying to zero after about 25 days. This behavior is not to be expected in an efficient market.
Next we do the same comparison for data belonging to the most recent time
period, i.e., for the period 2002-2006. This is shown in the lower panel of
figure 2, where we can see that IPC and DJIA’s ACFs simultaneously
reach the noise level. Also, the fluctuations are very similar in both cases.
Information shown in figures 1 and 2 suggests
that, from the point of view of the ACF, the Mexican stock market is becoming
similar to the DJIA, that is, it is becoming more efficient.
3 Detrended Fluctuation Analysis of the IPC
Signal analysis using detrended fluctuation analysis was introduced by Peng and collaborators [17]. It has proved to be a valuable tool when searching for long time correlations in non-stationary time series. In this method, a scaling or Hurst exponent is computed for the time series under analysis, whose values can be interpreted as:
-
•
i) if there is no correlation at all and the time series represents a random walk;
-
•
ii) if , persistent long-range power-law correlations are present in the time series, and;
-
•
iii) if , power-law anti-correlations are present.
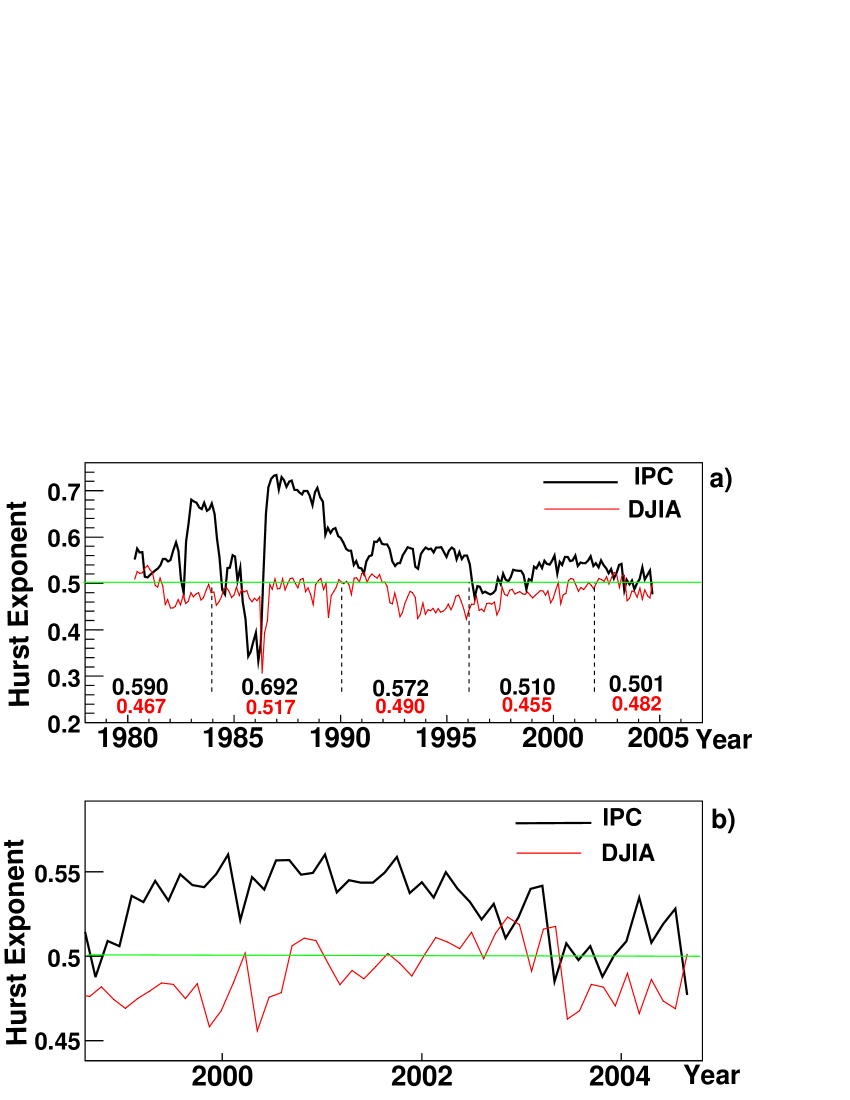
In the upper panel of figure 3, we show the Hurst exponent computed for a time window of 3 years as a function of time, for both the IPC and the DJIA. It can be seen how the values of in the initial years of the IPC (1980-1990), are much more erratic than those for DJIA. Great departures larger than a value of is a characteristic of an emerging or non-mature financial market [16]. In contrast, the DJIA, which can be considered a mature market since decades ago, shows much less pronounced variations in for the same period with a value smaller than (but very) close to .
The six year averaged values for shown in figure 3a) show how this exponent has been moving towards a value of 0.5 for the IPC, in particular it has a value of for the period 1996-2002, and for 2002-present. Figure 3b) shows a close-up of the period 1999-present, where it is clear how the two indexes behave in a similar fashion, both fluctuating around . Despite the relative small sizes of data samples analized [18], we believe the DFA analysis summarized in this figure stands as good evidence of the maturation of the IPC in recent times.
4 Volatility Analysis
Volatility is a term used for a statistical measure of value mean fluctuations over a certain interval of time of a given security or market index. A volatility measure still used in finance is the standard deviation of the security variations. However, because it is now well known that those changes do not follow a Gaussian distribution, other measures to describe these changes are preferred. In this section, volatility is calculated [19] by taking the absolute returns and averaging them over a time window , i.e.
| (1) |
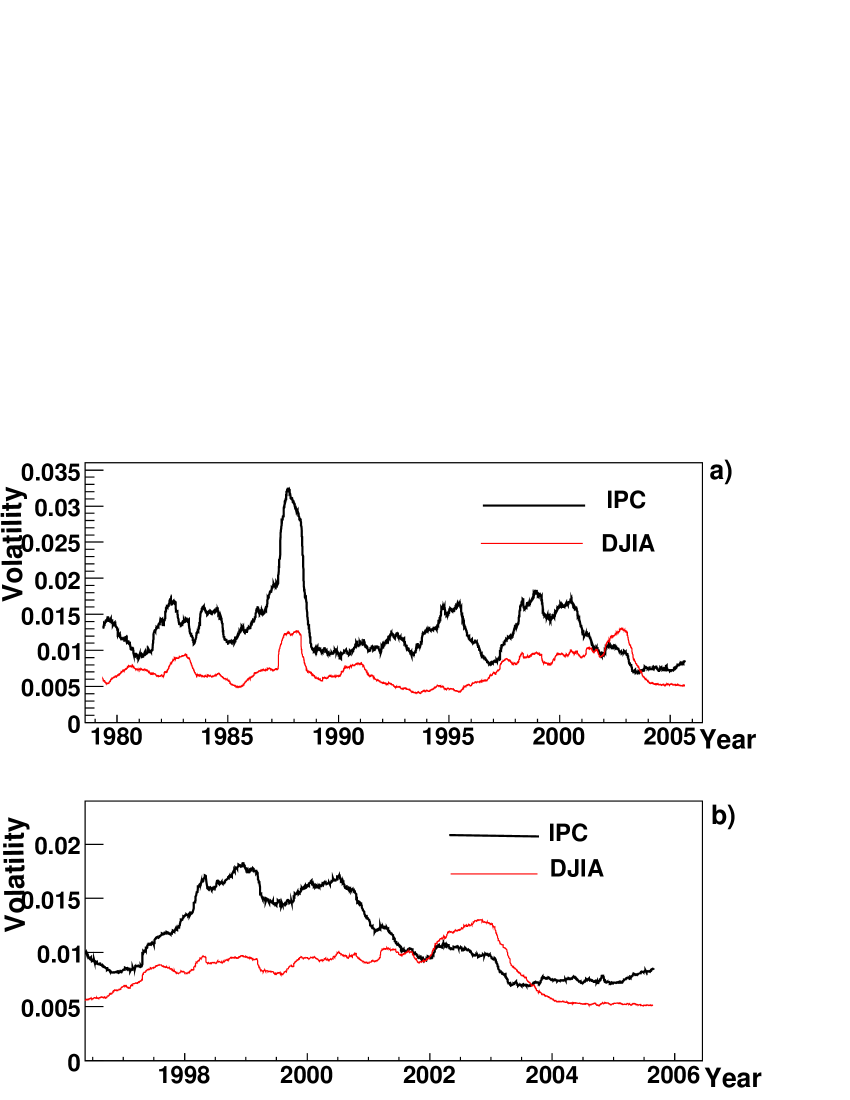
In our case we used a years time window in order to compare IPC and DJIA volatilities and 1 day. Both of them are displayed in figure 4.
The market’s volatility can be used as an indicator for signs of maturation. Persistent large values in the volatility are indicative of a market’s immaturity. It is clear from figure 4a) that the IPC’s volatility was consistently higher than that of the DJIA, except for more recent years (see Figure 4b), where the two indexes show fairly similar values of volatility. Again we believe this is a sign of the evolution of the Mexican Stock Market towards a more efficient behavior.
4.1 Mean value and Standard Deviation analysis
Finally, for completeness we have calculated and compared the 50 day Simple Moving Average (SMA) of the mean and standard deviation (RMS) of the IPC and DJIA returns for the total period 10/30/1978 to 02/28/2006. They are shown in figures 5a) and 5b).
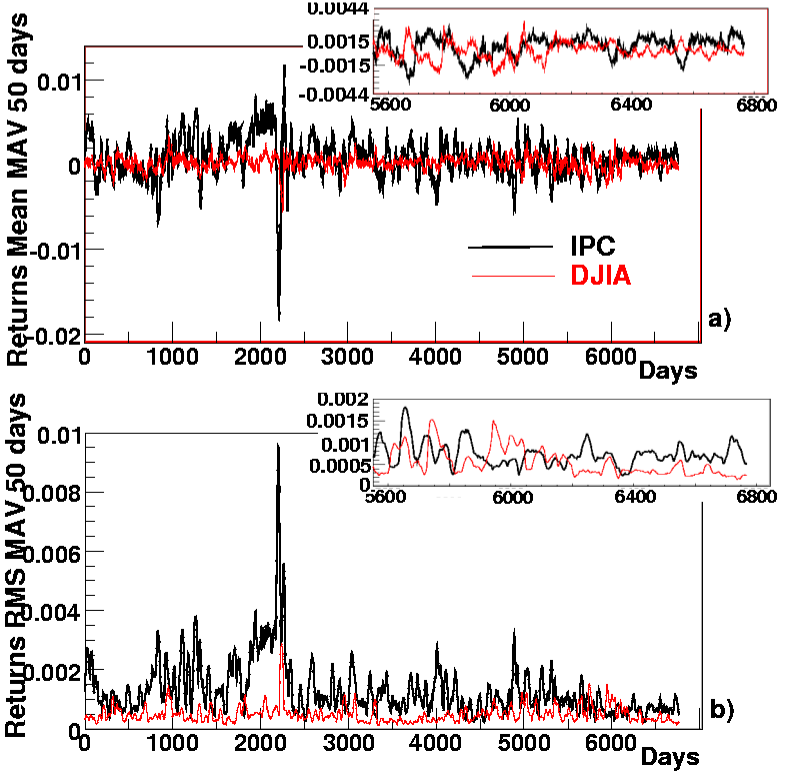
It is interesting to observe that the IPC returns fluctuations appear to become smaller in both mean value and RMS, i.e. seems that IPC is becoming more well centered around zero and the amplitud of their fluctuations lessened. Trying to gain some insight and confirm this behavior, we have calculated the returns mean value and RMS independently for each one of the periods already analyzed in previous sections. These values are shown in tables 1 and 2.
From table 1 is not easy to appreciate a clear trend of how the IPC and DJIA mean values of returns fluctuations are evolving over time; however, with respect to the standard deviation and observing the second column of table 2, we can say that a clear decreasing trend in the IPC RMS exists, and therefore it is possible to say that the IPC is becoming less volatile, with a strong tendency to tie DJIA variations as can be appreciated from fourth column of the same table. This fact confirms again the evolution of the IPC to maturity.
| Period | IPC | DJIA | |
|---|---|---|---|
| 78-83 | |||
| 84-89 | |||
| 90-95 | |||
| 96-01 | |||
| 02-06 |
| Period | IPC | DJIA | |
|---|---|---|---|
| 78-83 | |||
| 84-89 | |||
| 90-95 | |||
| 96-01 | 2.4 | ||
| 02-06 |
5 Resume
We have used four distinct methods, namely: autocorrelation analysis, detrended fluctuation analysis, volatility analysis and standard deviation trending analysis, to study the maturation process of the Mexican stock market through its leading index, the IPC, and compared the results with a well developed and mature index, the Dow Jones Industrial Average (DJIA). In all four cases, we have found compelling evidence of evolution of the Mexican market towards a more efficient market. In particular, from around year 2000 to date, the four methods used in this study show that the IPC has remarkably similar behavior to that of the DJIA.
Acknowledgments
We thank the valuable suggestions from S. Jiménez, P. Giubellino,
A. Guerra and R. Vilalta. We also thank P. Zorrilla-Velasco, A.
Reynoso del Valle and S. Herrera-Montiel from the BMV for their valuable time and
cooperation providing us with the IPC index daily data set.
This work has been supported by Conacyt-Mexico under Grants 44598
and 45782.
Analysis has been realized using ROOT [20].
References
- [1] M. Constantin and S. Das Sarma, Phys. Rev. E 72 (2005) 051106.
- [2] V. Plerou, P. Gopikrishnan, B. Rosenow, L. A. Nunes Amaral, and H. E. Stanley, Phys. Rev. Lett. 83 (1999) 001471.
- [3] J. A. O. Matos, S. M. A. Gama, H. J. Ruskin and J. A. M. S. Duarte, Physica A 342 (2004) 665.
- [4] D. Grech and Z. Mazur, Physica A 336 (2004) 133.
- [5] Xin-tian Zhuang, Xiao-yuan Huang and Yan-li Sha, Physica A 333 (2004) 293.
- [6] A. Pagan J. Empirical Finance 3 (1996) 15.
- [7] R. Cont, Quantitative Finance (2001) 1 223.
- [8] E. F. Fama, J. Finance (1970) 25 383.
- [9] B. Tóth, J. Kertész, Physica A 360 (2006) 505.
- [10] D. O. Cajueiro, B. M. Tabak, Physica A 336 (2004) 521-537.
- [11] C. R. Harvey, Review of Financial Studies V8 N3 (1995) 773.
- [12] G. Bekaert, C. R. Harvey NBER working Paper 5307 1995
- [13] G. De Santis, S. Imrohoroglu, Journal of International Money and Finance 16 (1997) 561.
- [14] F. Selçuk, Physica A 333 (2004) 306.
- [15] T. Di Matteo, T. Aste, M. M. Dacorogna, Physica A 324 (2003) 1983.
- [16] M. Bȩben and A. Orlowski, Eur.Phys.J. B 20 (2001) 527.
- [17] C. K. Peng, S. V. Buldyrev, S. Havlin, M. Simons, H. E. Stanley and A. L. Goldberger, Phys. Rev. E 49 (1994), 1685-1689.
- [18] M. Couillard, M. Davison, Physica A 348 (2005) 404.
- [19] Y. Liu et al, Phys.Rev.E 60 2 (1999) 1390.
-
[20]
Rene Brun and Fons Rademakers, ROOT - An Object Oriented Data
Analysis Framework, Proceedings AIHENP’96 Workshop, Lausanne, Sep. 1996.
Nucl. Inst. & Meth. in Phys. Res. A 389 (1997). http://root.cern.ch.