Analysis of a Japan government intervention on the domestic agriculture market
Abstract
We investigate an economic system in which one large agent - the Japan government changes the environment of numerous smaller agents - the Japan agriculture producers by indirect regulation of prices of agriculture goods. The reason for this intervention was that before the oil crisis in 1974 Japan agriculture production prices exhibited irregular and large amplitude changes. By means of analysis of correlations and a combination of singular spectrum analysis (SSA), principal component analysis (PCA), and time delay phase space construction (TDPSC) we study the influence of the government measures on the domestic piglet prices and production in Japan. We show that the government regulation politics was successful and leaded (i) to a decrease of the nonstationarities and to increase of predictability of the piglet price; (ii) to a coupling of the price and production cycles; (iii) to increase of determinism of the dynamics of the fluctuations of piglet price around the year average price. The investigated case is an example confirming the thesis that a large agent can change in a significant way the environment of the small agents in complex (economic or financial) systems which can be crucial for their survival or extinction.
pacs:
05.45.Tp , 89.65.Gh , 89.65 -s.I Market complexity and government regulation
The growing complexity of the human society increases the difficulties in ensuring its steady economic development. This leads to increasing importance of large social agents such as state central bank or the national government which can influence in a significant way the financial and economic subsystems of the society. Changes of the interest rates, intervention on the exchange markets and subsidies for selected economic branches improve or worsen the environment for the small size economics and social agents. Below we discuss an especially critical issue for the sustainable development of the society namely the development of the large network of economic, ecological and social components called national agricultural system. A sudden decrease of the agriculture production can lead to social tensions. The requirement for steady increase of the food quality and quantity presses entire branches of the agriculture system to move from the natural (due to the climate) regimes of cyclic output to more uncontrollable regimes of chaotic output. Because of the above two reasons the governments try to regulate the market for agriculture goods especially after large crises such as wars or oil shocks Cohrane (1958); Spulber (1989); Colyer et al. (2000). Here we shall analyze the results of a such intervention by the methods of the time series analysis (see Kantz and Schreiber (1997) and for applications Dimitrova and Vitanov (2000a, b); Boeck and Vitanov (2002)). Together with the methods of the nonlinear dynamics and stochastic analysis the above-mentioned methods are much applied for understanding, description and evaluation of the dynamics of complex economic and social systems Lorenz (1993); Levy and Levy (2000); Dimitrova and Vitanov (2004); Vitanov et al. (2006) and in particular in studies of different aspects of the agriculture production such as analysis of the dairy production in the USA Chavas and Holt (1993) or the analysis of the meat production in Japan Sakai (2001).
With its about 130 million citizens and highly developed economy Japan is a large consumer of meat but up to about 45 years ago no specialized in piglet production farms existed. As the consumption increased in the 1960’s this production became lucrative source of money for the farmers and specialized farms for production of piglets and meat arose. Until 1974 there was no massive intervention of the Japanese government on the agriculture market, i.e., less than from the farmers received subsides from the state. After the oil crisis from 1974 the situation changed significantly and almost all agricultural producers have been included in the subsidies schemes and other farm programs intending to fix the instability of the agriculture markets.
II Was the Japan government intervention successful?
In order to investigate the consequences of the actions of the large agents often we do not need to analyze the large amount of data normally required by econophysicsists for analysis of systems containing many almost identical small-size agents. Here we study monthly time series for the piglet production and prices in Japan from 1965 to 1992 (i.e. before the recession events in the last decade of previous century). The time series are too short and too nonstationary in order to be investigated by means of the conventional methods of the nonlinear time series analysis such as Lyapunov exponents or generalized dimensions but we can apply another methodology based on singular spectrum analysis (SSA) and principal component analysis (PCA) (see for example Broomhead and King (1986); Albano et al. (1988); Mees et al. (1987); Vautard et al. (1992); Vitanov and Sakai (2003)).
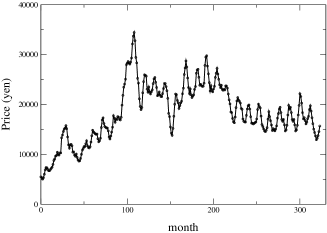
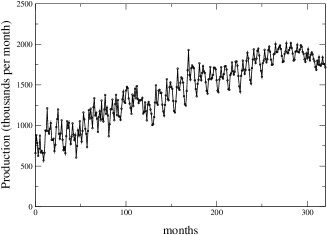
The time series are shown in Fig.1. The oil crisis from 1974 is located just before the maximum of the price time series. In the period before the crisis the price time series are very nonstationary with a sharp upward trend. The government intervention after the crisis stabilized the price and the seasonal periodicity became more important in comparison to the period before the oil crisis. Such drastic changes are not observed in the time series for the production which shows a trend of increase up to the beginning of 1990s.
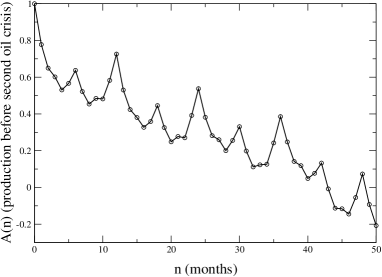
The autocorrelation function supplies us with additional information. For an example if the time series are correlated and not periodic the autocorrelation function decays slower than exponentially and in presence of long-range correlations we can observe a power-law decay (for more details see for an example Bassinghwaighte et al. (1994); Ivanov et al. (1999); Kantelhardt et al. (2002); Vitanov et al. (2005); Vitanov and Yankulova (2006)).
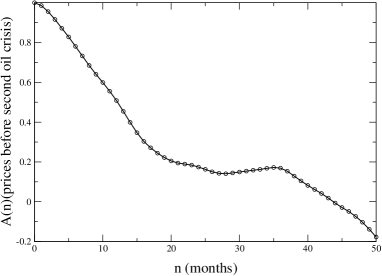
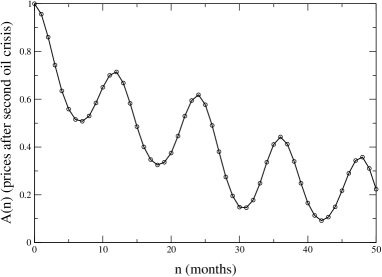
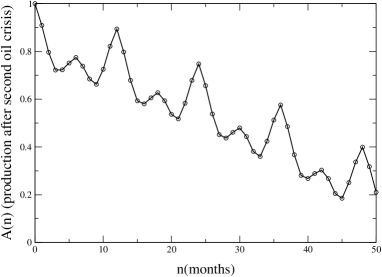
The autocorrelation functions for the production and prices of the piglets in Japan are shown in Figs. 2 and 3. In Fig. 2 we observe slower decay of the autocorrelation function of the production time series after the oil crisis when compared to the pre-crisis function. Thus after the government intervention the piglets production became more correlated in the time, e.g., more predictable. The government intervention has not influenced significantly the (caused by the specifics of the consumers demand) 6- and 12-months production cycles. Completely different is the situation about the piglet prices. Before the crisis the price correlations decay with increasing . After the government intervention the strong upward trend is not presented anymore. The dominant process is a 12-months cycle and the minima and maxima of follow each other in a 6-months tact. Thus the intervention coupled the price and production cycles and the prices became much more predictable.
In combination with the method of delay vector construction Kantz and Schreiber (1997); Hegger et al. (1999) the singular spectrum analysis can deal successfully with short and nonstationary time series Broomhead and King (1986); Albano et al. (1988); Mees et al. (1987); Vautard et al. (1992); Vitanov and Sakai (2003). Let us have a time series consisting of values recorded by using fixed time step . On the basis of the time series we construct dimensional vectors as follows. First we choose the step and then we construct the vectors . In such a way by means of the TDPSC (time delay phase space construction) we transform the time series to a set of vectors. We note that the requirements for TDPSC are different from the requirements for the time-delay embedding. In TDPSC we have to choose as small as possible and must be as large as possible (here , ). By means of the TDPSC vectors we build the trajectory matrix as well as the covariance matrix of the trajectory . Let be the eigenvectors of the last matrix and are the eigenvalues corresponding to these vectors. The vectors form an orthonormal basis in the dimensional space of the vectors . The matrix can be decomposed in the following way: where is an matrix consisting of the eigenvectors of the trajectory matrix Broomhead and King (1986). is the orthogonal matrix and is the diagonal matrix constructed by the eigenvalues called also singular values. These values are nonnegative and the common rule is to number them with respect to their values as follows: . In addition we can decompose the time series using the eigenvectors of the Toeplitz matrix of the time series . The principal components of the time series can be obtained by a projection of the time series on the basis vectors .


Below we shall extract additional information about the behavior of the piglet prices by application of SSA and PCA to the piglet price time series from which the moving average year trend is subtracted. What remains are the oscillations around the trend and we shall investigate if the the dimension of the phase space dynamics of these oscillations decreased as a result of the discussed Japan government intervention. Strong evidence for such a conclusion is obtained by comparing the singular spectra of the the time series as well as the part of total variance of time series contained in the corresponding principal components. These two quantities for the detrended time series before and after the crisis are shown in Figs. 4 and 5. The largest singular values in the singular spectra shown in Fig. 4 are connected to the deterministic part of the time series and the number of the significant components in the singular spectrum (which values are significantly larger than the other singular values) gives us the value of the statistical dimension which is an upper bound of significant degrees of freedom of the investigated system. The concentration of fluctuation dynamics can be observed in Fig.4 where we can see the increase of the significance of the first two principal components after the crisis at the expense of the significance of the second two principal components. Additional light on the concentration of the dynamics is given by Fig. 5 where we observe increasing of the percentage of total variance of time series concentrated in the first two principal components after the crisis. We can conclude that the dynamics of the fluctuations is (a) low -dimensional even before the crisis and (b) its dimensionality decreases further after the crisis and the essential part of the dynamics can be captured by an appropriate model containing small number of equations.


In order to test the last assumption we plot in Fig. 6 the full detrended time series after the crisis (panel (a)) as well as the time series projected in the subspace of first two principal components (panel (b)) or on the first five principal components (panel (c)). As we can see essential features of the dynamics such as its periodicity are captured already in two-dimensional phase space whereas the details of the dynamics of the fluctuation can be very well described when the . On the basis of this conclusion in future we shall try to model the fluctuation price dynamics by means of a low-dimensional nonlinear dynamics model.
As concluding remark we note that in this paper we concentrated our attention on a problem not much investigated up to now by the econophysics which is focused much more on the statistical properties of economic and financial systems containing many similar- (small) size interacting agents. Here we show that the presence of a large agent(s) in such systems can lead to significant changes of the environment of action and interaction of the smaller agents. We have shown that as a result of the Japan government intervention on the agriculture markets after the oil crisis in 1974 (i) the large pre-crisis nonstationarity of the piglet prices was reduced; (ii) the price behavior became cyclic and was coupled to the consumer-driven production cycle and (iii) In addition the dimension of the phase space of the dynamics of price fluctuations around the yearly moving average became smaller as a result of the intervention. The government intervention has made the prices more predictable for the suppliers and for the buyers. Thus we can conclude that with respect to this sub-sector of the Japan agriculture the government intervention was successful.
Acknowledgements.
N. K. Vitanov thanks for the support of his research by a Fellowship of the Japan Society for the Promotion of Science (JSPS) and by the COST P10 ”Physics of Risk” Program of the European Science Foundation.References
- Cohrane (1958) W. W. Cohrane, Farm prices: myth and reality (University of Minessota Press, Minneapolis, 1958).
- Spulber (1989) D. F. Spulber, Regulation and markets (MIT Press, Cambridge, MA, 1989).
- Colyer et al. (2000) D. Colyer, P. L. Kennedy, W. A. Amponsah, S. M. Fletcher, and C. M. J. (eds.), Competition in agriculture: The United States in the world market (Haworth Press, Binghampton, NY, 2000).
- Kantz and Schreiber (1997) H. Kantz and T. Schreiber, Nonlinear time series analysis (Cambridge University Press, Cambridge, 1997).
- Dimitrova and Vitanov (2000a) Z. I. Dimitrova and N. K. Vitanov, Phys. Lett. A 272, 368 (2000a).
- Dimitrova and Vitanov (2000b) Z. I. Dimitrova and N. K. Vitanov, Physica A 300, 91 (2000b).
- Boeck and Vitanov (2002) T. Boeck and N. K. Vitanov, Phys. Rev. E 65, Art. No. 037203 (2002).
- Lorenz (1993) H. W. Lorenz, Nonlinear dynamical equations and chaotic economy (Springer, Berlin, 1993).
- Levy and Levy (2000) M. Levy and H. Levy, Microscopic simulation of financial markets. From investor behavior to market phenomena (Academic Press, San Diego, 2000).
- Dimitrova and Vitanov (2004) Z. I. Dimitrova and N. K. Vitanov, Theoretical Population Biology 66, 1 (2004).
- Vitanov et al. (2006) N. K. Vitanov, Z. I. Dimitrova, and H. Kantz, Phys. Lett. A 349, 350 (2006).
- Chavas and Holt (1993) J. P. Chavas and M. T. Holt, American Journal of Agricultural Economics 75, 113 (1993).
- Sakai (2001) K. Sakai, Nonlinear dynamics and chaos in agricultural systems (Elsevier, London, 2001).
- Broomhead and King (1986) D. S. Broomhead and G. P. King, Physica D 20, 217 (1986).
- Albano et al. (1988) A. M. Albano, J. Muench, C. Schwant, A. I. Mees, and P. E. Rapp, Phys. Rev. A 38, 3017 (1988).
- Mees et al. (1987) A. I. Mees, P. E. Rapp, and L. S. Jennings, Phys. Rev. A 36, 340 (1987).
- Vautard et al. (1992) R. Vautard, P. Yion, and M. Ghil, Physica D 58, 95 (1992).
- Vitanov and Sakai (2003) N. K. Vitanov and K. Sakai, System Analysis Modeling Simulation (SAMS) 43, 815 (2003).
- Bassinghwaighte et al. (1994) J. P. Bassinghwaighte, L. S. Liebovich, and B. J. West, Fractal physiology (Oxford University Press, New York, 1994).
- Ivanov et al. (1999) P. C. Ivanov, L. A. N. Amaral, A. L. Goldberger, S. Havlin, M. G. Rosenblum, Z. R. Struzik, and H. E. Stanley., Nature 399, 461 (1999).
- Kantelhardt et al. (2002) J. W. Kantelhardt, S. A. Zschiegner, E. Koszielny-Bunde, S. Havlin, A. Bunde, and H. E. Stanley, Physica A 316, 87 (2002).
- Vitanov et al. (2005) N. K. Vitanov, K. Sakai, and E. Yankulova, Journal of Theoretical and Applied Mechanics 35, 73 (2005).
- Vitanov and Yankulova (2006) N. K. Vitanov and E. Yankulova, Chaos Solitons and Fractals 28, 768 (2006).
- Hegger et al. (1999) R. Hegger, H. Kantz, and T. Schreiber, CHAOS 9, 413 (1999).