Time-frequency Domain Analogues of Phase Space Sub-Planck Structures
Abstract
We present experimental data of the frequency resolved optical gating (FROG) measurements of light pulses revealing interference features which correspond to sub-Planck structures in phase space. For superpositions of pulses a small, sub-Fourier shift in the carrier frequency leads to a state orthogonal to the initial one, although in the representation of standard time–frequency distributions these states seem to have a non-vanishing overlap.
It was shown by Zurek zurek2001 that sub-Planck structures in phase space - an unexpected sign of quantum interference - play a surprisingly important role in the distinguishability of quantum states. A sub-Planck phase space shift applied to superposition of coherent states is sufficient to produce a state which is orthogonal to the unshifted one. This seems counter-intuitive because such superpositions of coherent states overlap significantly. Nevertheless, a very small shift causes that the original and shifted superpositions are orthogonal to each other, which makes them - at least in principle - distinguishable. The effect was originally studied for a superposition of four coherent states zurek2001 and then in thesis ; chirp it was shown that superpositions of just two coherent states lead to a similar result.
Both in classical optics and quantum mechanics the linear superposition principle is the basis of all interference phenomena. Thus, it should not surprise one that if quantum wave packets are replaced by light pulses, the effects similar to sub-Planck structures i.e. sub-Fourier structures should be observed. In this letter an experimental realization of a time-frequency version of this phenomenon is reported.
Instead of superpositions of coherent states in phase space, optical fields in the form of coherent superpositions of pulses are used and the FROG spectrogram is recorded. A specific cross-section of this spectrogram represents a scalar product of the measured field and the field with the same envelope but a shifted carrier frequency. We show that for fields that have the form of a superposition of two pulses this scalar product is an oscillating function of the frequency shift. Moreover, zeros of this scalar product are spaced by sub-Fourier distances in the scale of the superposed pulses i.e., the distance between them is smaller than the single pulse spectral width.
During the last decade FROG (Frequency Resolved Optical Gating) has become a standard method for reconstruction of the amplitude and phase of ultrashort light pulses frog1993 ; frog1994 ; frog_book . In the second harmonic version of this technique (SH FROG) a pulse to be measured is split and its two mutually delayed replicas are overlapped in a nonlinear optical crystal. The sum frequency signal generated in the crystal is spectrally resolved and recorded for different time delays . The resulting time–frequency map has the form
| (1) |
and its cross-section for zero delay reads
| (2) |
Now, consider a pulsed electric field with a real envelope and a linear phase
| (3) |
where denotes a carrier frequency of the pulse. The absolute value squared of the scalar product of this field and a field with the same envelope but a carrier frequency shifted by , i.e. , is given by
| (4) |
For transform-limited pulses of a given carrier frequency the form of is the same as the one given by Eq.(4). In other words, the cross-section of the FROG map measured at is equal to an overlap of the field and the same field shifted in frequency by , i.e. .
For example, when two Gaussian pulses characterized by their carrier frequency , dispersion and time separation are superposed:
| (5) |
the scalar product (4) becomes
| (6) |
while the cross-section of the corresponding FROG spectrogram is
| (7) |
Formula (6) can be derived from (7) after substituting . For Eqs. (6) and (7) have an infinite number of nearly equally spaced zeros. This means that a superposition of two Gaussian pulses is orthogonal to similar superpositions with appropriately shifted carrier frequencies. Moreover, the smallest of these leading–to–zero–overlap shifts is given approximately by , which for sufficiently large separations becomes sub-Fourier in a single pulse scale. These sub-Fourier shifts correspond directly to the sub-Planck shifts leading to orthogonality of superpositions of two (or four) coherent quantum wave packets zurek2001 ; thesis .
The experimental setup is presented in Fig.1. The pulse source was a home-built Ti:Sapphire oscillator delivering 50 fs (FWHM) pulses centered at 780 nm with a 80 MHz repetition rate. To generate a pulse pair with a highly stable delay we used a half waveplate, a crystalline quartz block 10 mm thick (optic axis parallel to the input surface) and a polarizer.
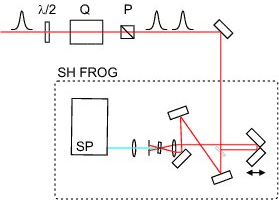
The pulse polarization was first rotated causing the pulse to split into two replicas of mutually perpendicular polarizations and similar energies in the quartz crystal. When the polarizer was set at 45 degrees with respect to the optic axis a pair of delayed pulses with parallel polarizations emerged. The group delay between 780 nm pulses propagating as ordinary and extraordinary rays is approximately 30 fs/mm in crystalline quartz. The total delay was fine–tuned by tilting the quartz block. The standard FROG apparatus consisted of a dielectric beamsplitter, a delay line with a stepper motor-driven translation stage (8 fs/step), a 100 m type I BBO crystal for second harmonic generation and a specrometer with a linear CCD array of 2048 pixels providing resolution better than 0.5 nm (Ocean Optics, USB 2000).
a)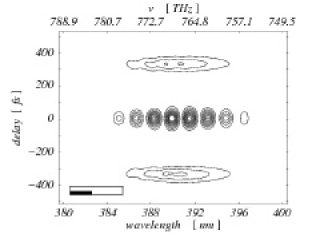
b)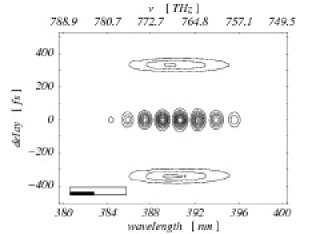
a)

b)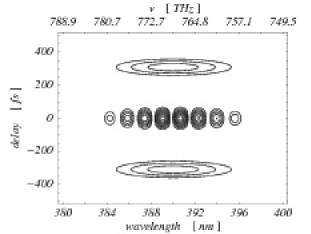
Figures 2a and 2b present the FROG spectrograms measured for a superposition of two pulses with the separation of fs and fs, respectively. Numerically calculated maps for pulse pairs with parameters corresponding to the measurements are presented in Figs. 3a and 3b. The black rectangles at the contour-plots show minimal uncertainty relation areas of a single pulse, , the white ones give the corresponding FWHM widths. Figures 4a and 4b show cross-sections of the measured spectrograms together with their theoretical fits.
The measured time dispersion of the superposed pulses was fs (i.e fs FWHM) which imposes a THz Fourier limit on the frequency dispersion (or, equivalently, THz FWHM). The zeros of the oscillating structures seen at Fig. 4 are less then THz apart, which is below the Fourier limit imposed by any of the single pulses. These zeros correspond to carrier frequencies shifts for which pairs of pulses have a vanishing overlap. Such a shift can be called a sub-Fourier, although, the Fourier/Heisenberg uncertainty relation is certainly not violated for the state under study. The smaller is the change of the carrier frequency leading to the zero overlap, the larger the separation distance between the pulses.
a)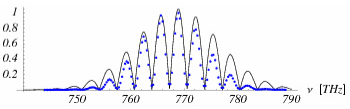
b)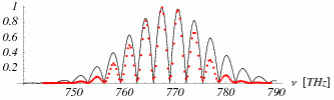
It is instructive to study the effect demonstrated above using standard time-frequency distribution functions. The Wigner distribution wigner1932 ; cohen1995 , which is especially useful for description of classical and quantum interference kwgh1998 ; Dragoman2001 , for a pulse with an electric field is defined as
| (8) |
An important property of the Wigner function that links the Wigner function of two fields , and their scalar product, is given by the Moyal formula:
| (9) |
Figure 5a presents a contour plot of the Wigner function for the superposition of two Gaussian pulses, Eq. (5), with the separation and . The second contour plot (Fig. 5b) corresponds to the Wigner function of the same pair of pulses but with the carrier frequencies shifted by . The calculated scalar product of these two superpositions is zero. In the Wigner representation, the vanishing of the scalar product may be interpreted as an interference effect: the interference fringes in Fig.5b are shifted by half of the modulation period with respect to those in Fig.5a. This shift causes that in the scalar product calculated according to Eq. (9), a negative contribution from the interference terms cancels exactly the positive contribution from the Gaussian peaks.
Another widely used time-frequency distribution is the Husimi function (or the Glauber -function) Husimi . Figures 6a and 6b present the Husimi function calculated for the state described by Eq.(5) with the same parameters as those used in the evaluation of the Wigner function. The plots presented in Figs 6a, 6b are identical except for a small frequency shift. The fact that the scalar product of the corresponding fields vanishes is rather surprising – at least until one recalls that the Moyal formula given by Eq.(9), is not applicable to the Husimi function (see Fig. 5).
a)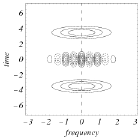 b)
b)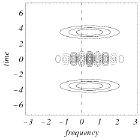
a)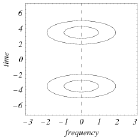 b)
b)
To conclude: we have demonstrated the presence of sub-Fourier structures in the measured time–frequency representation of light pulses. These structures are classical counterparts of sub-Planck features in the phase space. We have shown that two pairs of pulses displaced by a small, sub-Fourier shift of the carrier frequency may be mutually orthogonal even if they seem to have a non-vanishing overlap in the time-frequency representation of some commonly used quasi–distributions.
The experiments were performed in the KL FAMO laboratory in Torun, Poland. This research was partially supported by Polish MNiSW Grant No. 1 P03B 137 30 and European Union’s Transfer of Knowledge project CAMEL (Grant No. MTKD-CT-2004-014427)
References
- (1) W. Żurek, Nature (London) 412, 712 (2001).
- (2) L. Praxmeyer, Classical and quantum interference in phase space, PhD thesis, Warsaw University, 2005.
- (3) L. Praxmeyer, K. Wódkiewicz, Laser Phys. Vol. 15, No. 10, 1477, (2005).
- (4) D. J. Kane, R. Trebino, J. Opt. Soc. Am. A 10, 1101 (1993).
- (5) K.W. DeLong, R. Trebino, J. Hunter, W. E. White, J. Opt. Soc. Am. B 11, 2206 (1994).
- (6) R. Trebino, Frequency-Resolved Optical Gating: The Measurement of Ultrashort Laser Pulses, Springer, 2002.
- (7) E. Wigner, Phys. Rev. 40, 749 (1932).
-
(8)
L. Cohen, Time-frequency Analysis: Theory and Applications,
Prentice-Hall Signal Processing Series (Prentice-Hall, Englewood Cliffs, NJ, 1995);
W. P. Schleich, Quantum Optics in Phase Space (Wiley-VCH, Berlin, 2001). - (9) K. Wódkiewicz and G. Herling , Phys. Rev. A 57, 815 (1998).
- (10) D. Dragoman, Phys. Lett. A 285, 109 (2001).
-
(11)
K. Husimi, Proc. Phys. Math. Soc. Japan, 22, 264 (1940);
K. Takahashi, Prog. Theor. Phys. Suppl. 98, 109 (1989).