Clusters or networks of economies?
A macroeconomy study through GDP correlations
Abstract
We follow up on the study of correlations between GDP’s of rich countries, as studied in refs. [1-3]. We analyze web-downloaded data on GDP that we use as individual wealth signatures of the country economical state. We calculate the yearly fluctuations of the GDP. We look for forward and backward correlations between such fluctuations. The system is represented by an evolving network, nodes being the GDP fluctuations (or countries) at different times.
In order to extract structures from the network, we focus on filtering the time delayed correlations by removing the least correlated links. This percolation idea-based method reveals the emergence of connections, that are visualized by a branching representation. Note that the network is made of weighted and directed links when taking into account a delay time. Such a measure of collective habits does not fit the usual expectations defined by politicians or economists.
pacs:
05.45.-a,05.45.Ra,89.65.-s,89.65.GhI Introduction
Some time ago, the question of economy globalization was studied along the lines of macro-econophysics research 1 ; 2 ; 2b . Other considerations along related lines can be found in these proceedings in contributions by Miskiewicz 3 and Gligor 4 . The question pertains to well known observations: there are political, cultural, scientific, economic cooperations all over the world, even though there are even anti-globalization organizations.
In our case, we consider that a in economy should be understood as an increase of similarities within (macroeconomy) development patterns. In so doing we have proposed to study whether the pattern economy of countries was well represented by the between fluctuations of their country Normalized Gross Domestic Products (GDP). The notion of distance is somewhat arbitrary, as has been already discussed in [1], but is left for further investigation elsewhere. We have chosen to present here a study based on the statistical distance, in Sec. II, for the 23 most developed countries for which annual GDP data is available in the interval .
One might argue fagiolo that some data detrending is necessary to take into account cycle like effects cycleLong83 ; cycleBasu99 . In previous studies 1 it has been observed that there is much noise is the data. We have shown that some average should be taken over large time windows to remove such a noise. We will use an average time of years. One usual question is whether one has to another country policy in order to improve one’s country economy. The question of followers and leaders can be tackle by considering time delayed correlations. In this first attempt we will only consider a one year time lag , being aware that other time lags should be involved. Note that positive or negative ones should be considered. Nevertheless it is worthwhile to check whether such an approach is already meaningful for and .
The system thus looks like an evolving network, nodes being the GDP fluctuations or, in a short way, countries at different times. In Sec. III, we extract structures from the network through filtering the time delayed correlations (or distance matrix) by removing the least correlated links. This percolation idea-based method reveals the emergence of connections, that are visualized by a branching representation. However the system is pretty unstable. Yet, expected features are reproduced. This should imply some further consideration in the line of Glansdorff and Prigogine Glansdorf about Structure and Stability of world economic systems and the intrinsic role of fluctuations. Notice also that the network is much more complex when taking into account delay time. Indeed the correlation matrix is symmetrical, whence the network links are not only weighted but also directed. The number of distances to be considered is , where is the number of countries, in contrast to , when . In Sec. IV, we conclude that such a measure of collective habits does not fit the usual expectations defined by politicians but that does not imply that they are wrong or right, nor are we.
We stress that several times must be truly considered, i.e.
-
1.
Initial observation time
-
2.
Data acquisition time
-
3.
Increment or fluctuation time span
-
4.
Delay time (between two countries)
-
5.
Window observation (averaging) time , i.e. []
-
6.
Conclusion time
Thus the correlation matrix is of quite high dimension (;…)
II Methodology
We use data from for Normalized Gross Domestic Product (GDP) of the 21 most developed countries. Most of countries have natural time scales associated to the time lags between elections. Whence we use an average time of years. For each of the countries, let us define that is equivalent to the average variation of the GDP over years.
Let us now introduce a correlation measure and associated distance measure for the countries. The correlation measure is based on the Theil index and is defined as follows
| (1) |
where the averages are defined as follows
| (2) |
The ”averaging time” has been hereby chosen to be in the following. The distance is obtained from the correlation from the definition:
| (3) |
Let us stress that this short hand writing accounts for time delays between the signals. Let us also note that other measures of distance between different countries can be defined, e.g
| (4) |
, but we will focus on the definition 1 and 3 in the present paper. The comparison of results obtained for different measures will be considered elsewhere.
When , the above quantities are at fixed time. When , these quantities measure the correlations with a delay time between the economies of countries. If the evolutions were completely identical, one would find . Let us stress again that is symmetric in , when . For each pair of countries, this quantity defines therefore a surface whose statistical properties can be studied.


The first relevant quantity to report is the rank analysis of , at different values of (1974, 1984, 1994) and = 0, 1, -1. (Figs. 1,2) Notice the non trivial behavior, with various crossing of the curves, and the Zipf (log-log) plot, that does not lead to a fine straight line fit. Because the GDP increment distance between countries is rather uniform, this suggests similarities in development patterns, which likely result from interactions of economies, in a globalization sense.
III Clustering analysis
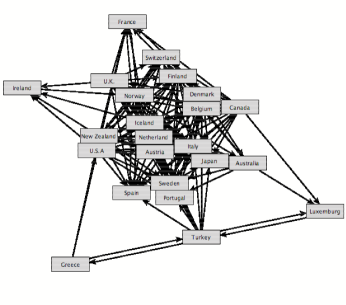
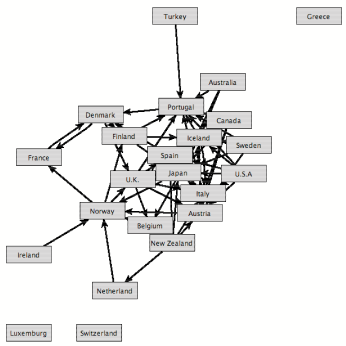
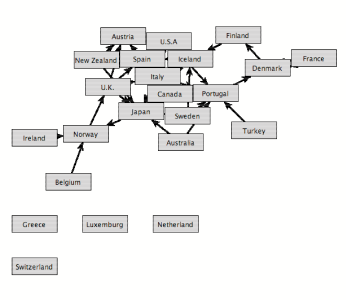
At fixed times, and fixed values of the delay , pairs of countries (i,j) are characterized by their relative distance. In order to extract structures from the distance matrix, we build country networks through filtering the time delayed correlation matrix by removing the least correlated links through moving a threshold.
To do so, we define the filtered matrix , where
| (5) | |||
| (6) |
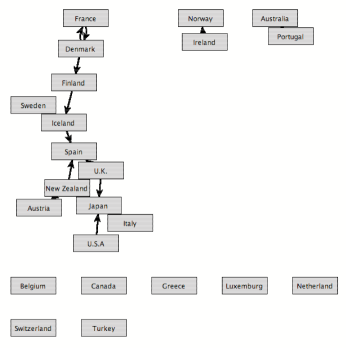
The resulting matrix therefore connects nodes that are very close to each other, and removes the weak links. By decreasing the values of , one observes therefore the breaking of the continent into several islands that correspond to very connected ”communities of countries”. Let us stress that this method has already been successfully applied in order to reveal structures in online communities lambi . Contrary to this previous study, the distance matrix may be asymmetric when . Consequently, the network representation will be made of directed links from to , if the matrix element verifies . This percolation idea-based method reveals the emergence of connections, that are visualized by a branching representation. In Fig.4, this method is shown for the parameters , .
IV Conclusions
In this short paper, we have introduced techniques in order to study the development of structures in macro-economical systems. To do so, we have considered the GDP’s of the 23 most developed countries, and defined statistical distances between their time evolution. A possible delay between economies has been accounted for through the parameter , thereby allowing the distinction between leading and following countries.
In the above analysis, we have observed that the rank distribution is unexpectedly giving an exponent different from the classical Zipf law (=-1), and that the data contain a lot of noise. Nevertheless, patterns have been found, under the form of clusters in the countries’ network. This structuring seems to be in line with economy globalization, that tends to homogenize the economic development of countries, and may be related to the influence of political considerations.
Clearly, other values of the time lag should be examined, and not so rich countries as well. There is no reason that the same time lag should be considered for different countries. In fact one could look for higher order time delayed correlation functions.
Finally, let us stress that there are many possible approaches, that could help the understanding of globalization processes in economy. A classical way in searching for clusters is to find subgraphs with a high clustering coefficient or to investigate the graph topology.
V Acknowledgments
This work is partially financially supported by ARC 02-07/293. RL would like also to thank financial support from the European Commission Project CREEN FP6-2003-NEST-Path-012864. Thanks to J. Miskiewicz for fruitful comments.
References
- (1) J. Miskiewicz and M. Ausloos,”Correlations between the most developed (G7) countries. A moving average window size optimisation”, Acta Phys. Pol. B 36, 2477-2486 (2005)
- (2) J. Miskiewicz and M. Ausloos, ”An attempt to observe economy globalization: the cross correlation distance evolution of the top 19 GDP’s”, Int. J. Mod. Phys. C , 17 (2006) 317-332.
- (3) J. Miskiewicz and M. Ausloos, ”G7 country Gross Domestic Product (GDP) time correlations. - A graph network analysis”, in Practical Fruits of Econophysics, H. Takayasu, Ed. (Springer, Tokyo, 2006) pp. 312-316
- (4) J. Miskiewicz, M. Ausloos, Information flow in economy systems. An ACP model study ‘
- (5) M. Gligor, M. Ausloos, ”A cluster-based analysis of some macro-economic indicators in various time windows”
- (6) G. Fagiolo, question raised at the end of the oral presentation
- (7) J.B. Long and C.I. Plosser, ”Real Business Cycles”, J. Polit. Econ. 91, 39-69 (1983).
- (8) S. Basu and A.M. Taylor, ”Business cycles in international historical perspective”, J. Econom. Perspect. 13, 45-68 (1999).
- (9) P. Glansdorff and I. Prigogine, Structure, Stabilité et Fluctuations, (Masson, Paris, 1971).
- (10) R. Lambiotte and M. Ausloos, ”Uncovering collective listening habits and music genres in bipartite networks”, Phys.Rev.E. 72, 066107 (2005)