Negative-index metamaterial at 780 nm wavelength
Abstract
We further miniaturize a recently established silver-based negative-index metamaterial design.
By comparing transmittance, reflectance and phase-sensitive time-of-flight experiments to theory,
we infer a real part of the refractive index of -0.6 at 780 nm wavelength – which is visible in the laboratory.
©2006 Optical Society of America
Photonic metamaterials are tailored artificial optical materials composed of sub-wavelength metallic building blocks that can be viewed as nano-scale electronic circuits. These building blocks or “photonic atoms” are densely packed into an effective material such that the operation wavelength is ideally much larger than the lattice constant . Along these lines, highly unusual material properties become accessible, e.g., a negative index of refraction 2 ; 4 , which has recently reached operation wavelengths of 10 , 11 , 12 , and 13 . In this letter, we demonstrate a negative index of refraction at the red end of the visible spectrum (780 nm wavelength) for the first time.
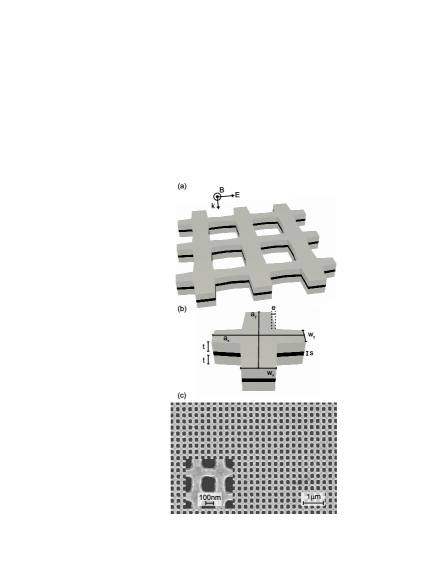
The physics of the particular sample/circuit design 16 used and miniaturized here has been described previously in work at lower frequencies.10 ; 12 ; 13 In brief, for the polarization configuration shown in Fig. 1 (a), the metamaterial can be viewed as composed of two sets of sub-circuits or “atoms”: (i) A coil with inductance in series with two capacitors with net capacitance as an circuit, providing a magnetic resonance at the resonance frequency.14 (ii) Long metallic wires, acting like a diluted metal below the effective plasma frequency of the arrangement.23 The negative magnetic permeability from (i) and the negative electric permittivity from (ii) lead to a negative index of refraction 2 ; 4 . We use silver as constituent material because silver is known to introduce significantly lower losses24 than, e.g., gold at visible frequencies. The choice of the dielectric spacer material is uncritical, we use . The design parameters have carefully been optimized regarding optical performance on the computer. Results from the best fabricated sample are shown here.
Fabrication employs standard electron-beam lithography, electron-beam evaporation of the constituent materials, and a lift-off procedure. All samples are located on glass substrate, coated with a 5-nm thin film of indium-tin-oxide (ITO) to avoid charging effects in the electron-beam-writing process (the ITO layer is irrelevant for the optical performance). The electron micrograph of the best sample ( footprint) shown in Fig. 1 (c) reveals good large-scale homogeneity as well as 68-nm minimum lateral feature size at 97-nm thickness of the Ag-MgF2-Ag sandwich. This aspect ratio (i.e., height/width) exceeding unity poses significant fabrication challenges. Compared with our previous choice of parameters at lower frequencies,12 ; 13 especially the relative thickness of the metal wires oriented along the electric-field vector (i.e., the ratio in Fig. 1 (b)) had to be increased. This step increases the effective plasma frequency, which needs to be above the operation frequency in order to obtain a negative electric permittivity.

Figure 2 (a) shows measured normal-incidence intensity transmittance and reflectance spectra (taken with 5 degrees half-opening angle) of this metamaterial sample. The bare glass substrate and a silver mirror, respectively, serve as reference. Shown in Fig. 2 (b) is the corresponding theoretical result based on numerical three-dimensional finite-difference time-domain calculations using the commercial software package CST MicroWave Studio. The geometrical parameters have already been indicated in Fig. 1 (b), optical material parameters taken are: MgF2 refractive index , glass substrate index , and the Drude model for silver with plasma frequency and damping or collision frequency . At the frequencies of interest here, the Drude model is an adequate description of the actual silver dielectric function.24 The quoted damping has been chosen to match the experiment in the present work and especially comprises broadening effects due to any type of sample imperfection (e.g., granularity of the metal film or inhomogeneous broadening). The chosen damping is three times larger than the literature value.24 Importantly, the exact same set of parameters will also be used below for the theoretical analysis of the interferometric experiments as well as for the effective-parameter retrieval.
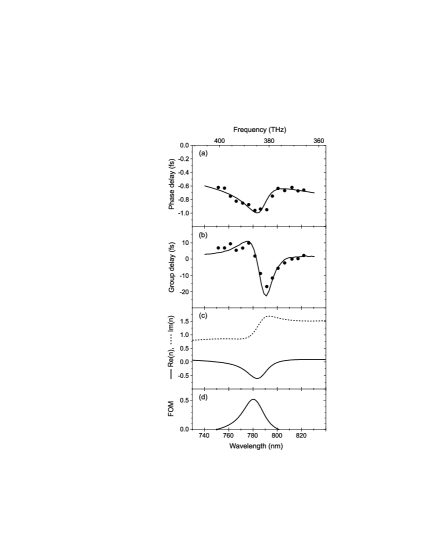
An unambiguous determination of effective material parameters, especially of the phase velocity , additionally requires phase-sensitive experiments. The details and the errors of the phase-sensitive “time-of-flight” experiment based on a compact and passively stable Michelson interferometer have been described previously by us12 , albeit in a different wavelength regime. In essence, we record two interferograms, one with the metamaterial sample on its glass substrate in one of the interferometer arms, and a second interferogram with just the glass substrate by laterally moving the metamaterial out of the optical path. All mechanical motions are computer controlled and realized by precise and calibrated piezoelectric actuators. The corresponding shift on the interferometer time delay axis yields the phase delay due to the metamaterial. By tuning the center wavelength of the incident Gaussian transform-limited 125 fs pulses, derived from a commercial mode-locked Ti:Sa laser (Spectra-Physics Tsunami), and by repeating the described procedure for each wavelength, we measure phase-delay spectra. Simultaneously and similarly, we infer the shift between the two Gaussian interferogram envelopes at each wavelength, which provides us with the group-delay spectra. In essence, the group-delay spectrum is the spectral derivative of the phase-delay spectrum. Thus, the group-delay spectrum sensitively depends on the damping. Corresponding data (dots) are shown in Fig. 3 (a) and Fig. 3 (b) together with numerical calculations (solid curves), in which we derive the interferograms from the complex sample electric-field transmittance for the femtosecond pulse parameters as in the experiment and then proceed with the analysis as in the experiment. Clearly, all effects due to the finite spectral width of the pulses are appropriately accounted for in this manner. Finally, we retrieve25 the effective material parameters from theory and depict them in Fig. 3 (c). These “retrieved” parameters refer to a fictitious homogeneous film on the glass substrate with a thickness identical to that of the metamaterial (nm) and complex transmittance and reflectance properties strictly identical to those of the metamaterial on the glass substrate. From the increasing relative importance of the imaginary part of the silver dielectric function for frequencies (even remotely) approaching the plasma frequency, one expects increased losses. Indeed, the figure of merit, FOM, shown in Fig. 3 (d) and defined via , is at best, while best values of have recently been achieved at wavelength by us.13 Still, the obtained value of is comparable to previous work at longer wavelengths.10 ; 11 ; 12
Obviously, the experimental results agree well with theory, which consistently describes transmittance (solid curves in Fig. 2), reflectance (dashed curves in Fig. 2), phase-delay (Fig. 3 (a)), as well as group-delay spectra (Fig. 3 (b)) – all with one set of parameters. Thus, the effective material parameters, especially the negative real part of (Fig. 3 (c)), retrieved from the same theory and the same parameters can be considered as very trustworthy. A determination on the basis of, e.g., intensity reflectance spectra alone would be ambiguous and not at all reliable based on our experience.
In conclusion, we have demonstrated a metamaterial with an effective real part of the index of refraction of at around wavelength. This wavelength can easily be seen with the naked eye in our laser experiments. Our work goes beyond previous work in the visible17 which showed a negative magnetic permeability. Phase-sensitive “time-of-flight” experiments give direct experimental evidence for the negative phase velocity of light. Studying the group velocity in parallel provides a sensitive consistency check of our analysis.
We acknowledge support by the Deutsche Forschungsgemeinschaft (DFG) and the State of Baden-Württemberg through the DFG-Center for Functional Nanostructures (CFN) within subproject A1.5. The research of S. L. is further supported through a “Helmholtz-Hochschul-Nachwuchsgruppe” (VH-NG-232), that of C. M. S. by the Alexander von Humboldt senior-scientist award 2002, by Ames Laboratory (Contract No. W-7405-Eng-82), EU projects PHOREMOST, METAMORPHOSE and DARPA (HR0011-05-C-0068).
∗ C.M.S. is also at Institute of Electronic Structure and Laser at FORTH and Dept. of Materials Science and Technology, Univ. of Crete, Heraklion, Crete, Greece.
References
- (1) R. A. Shelby, D. R. Smith, and S. Schultz, Science 292, 77 (2001).
- (2) D. R. Smith, J. B. Pendry, and M. C. K. Wiltshire, Science 305, 788 (2004).
- (3) S. Zhang, W. Fan, N. C. Panoiu, K. J. Malloy, R. M. Osgood, and S. R. J. Brueck, Phys. Rev. Lett. 95, 137404 (2005).
- (4) V. M. Shalaev, W. Cai, U. K. Chettiar, H. Yuan, A. K. Sarychev, V. P. Drachev, and A. V. Kildishev, Opt. Lett. 30, 3356 (2005).
- (5) G. Dolling, C. Enkrich, M. Wegener, C. M. Soukoulis, and S. Linden, Science 312, 892 (2006).
- (6) G. Dolling, C. Enkrich, M. Wegener, C. M. Soukoulis, and S. Linden, Opt. Lett. 31, 1800 (2006).
- (7) S. Zhang, W. Fan, K. J. Malloy, S. R. J. Brueck, N. C. Panoiu, and R. M. Osgood, Opt. Express 13, 4922 (2005).
- (8) J. B. Pendry, A. J. Holden, D. J. Robbins, and W. J. Stewart, IEEE Trans. Microwave Theory Tech. 47, 2075 (1999).
- (9) J. B. Pendry, A. J. Holden, W. J. Stewart, and I. Youngs, Phys. Rev. Lett. 76, 4773 (1996).
- (10) P. B. Johnson and R. W. Christy, Phys. Rev. B 6, 4370 (1972).
- (11) D. R. Smith, S. Schultz, P. Marko , and C. M. Soukoulis, Phys. Rev. B 65, 195104 (2002).
- (12) A. N. Grigorenko, A. K. Geim, H. F. Gleeson, Y. Zhang, A. A. Firsov, I. Y. Khrushchev, and J. Petrovic, Nature 438, 335 (2005).