COMBINED PHASE SPACE CHARACTERIZATION AT THE PEP-II IP USING SINGLE-BEAM AND LUMINOUS-REGION MEASUREMENTS ††thanks: Work supported in part by DOE Contract DE-AC02-76SF00515 ††thanks: SLAC-PUB-11904
Abstract
We present a novel method to characterize the phase space at the IP of the SLAC B-factory, that combines single-beam measurements with a detailed mapping of luminous-region observables. Transverse spot sizes are determined in the two rings with synchrotron-light monitors and extrapolated to the IP using measured lattice functions. The specific luminosity, which is proportional to the inverse product of the overlap IP beam sizes, is continuously monitored using radiative–Bhabha events. The spatial variation of the luminosity and of the transverse-boost distribution of the colliding , are measured using events reconstructed in the BABAR detector. The combination of these measurements provide constraints on the emittances, horizontal and vertical spot sizes, angular divergences and functions of both beams at the IP during physics data-taking. Preliminary results of this combined spot-size analysis are confronted with independent measurements of IP -functions and overlap IP beam sizes at low beam current.
1 INTRODUCTION
The BABAR detector [1] is located at the interaction point (IP) of the PEP-II asymmetric Factory [2], where 3.1 positrons from the low-energy ring (LER) collide with 9.0 electrons from the high-energy ring (HER). The LER has two beam profile monitors: a visible synchrotron-light monitor () [3] in a high-coupling region, and an X-ray monitor () [4] at a separate location. The HER is equipped with one . In both rings, the vertical beam size at the SLM is measured using a companion interferometer [5]. The BABAR tracking system is used to measure the three-dimensional distribution of vertices [6] and the transverse-boost distribution [7] of the muon pairs. This paper describes a first attempt at characterizing the phase space of the colliding beams by combining all the available information.
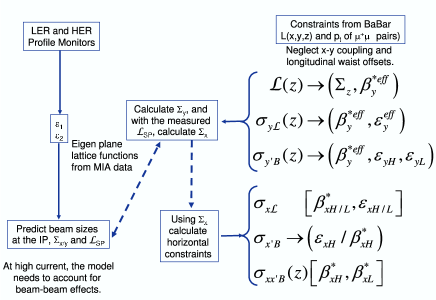
The strategy is outlined in Fig. 1. In each ring, profile-monitor data are combined with measured lattice functions to extract the eigenmode emittances and predict the IP spot sizes. The z-dependence of the luminosity , of the luminous size and of the boost angular divergence allow the determination, under high-luminosity conditions, of the overlap bunch length and of the vertical emittances and effective IP -function . Together with the measured specific luminosity , they also provide constraints on the horizontal emittances and functions . Each set of observables (profile monitors, luminous-region data) offers a nearly complete description of the IP phase space. Comparing results for overlapping parameters is used to validate the techniques or identify inconsistencies, and combining all measurements should eventually yield a complete, and partially constrained, description.
2 USE OF BEAM-PROFILE MONITORS
| Input | LER | LER | HER | HER |
|---|---|---|---|---|
| () | () | |||
| () | () | () | () | |
| only | () | () | ||
| , | ||||
| LEGO simulation | 32.6 | 1.13 | 50 | 0.36 |
The projected beam sizes and and the tilt angle of the transverse profile are measured at each of the three spot-size monitors. Lattice properties are measured by resonant excitation, one ring at a time in single-bunch mode. The beam-position monitor data are analyzed using a model-independent technique (MIA) [8], and fitted in the context of the LEGO package [9] to produce a set of fully-coupled lattice functions using the formalism of Ref. [10]. The same procedure predicts the eigenemittances in the absence of beam-beam interactions.
Using, at each profile monitor, the measured one-turn matrix extracted above, one can express the measured beam size in terms of two (unknown) eigenmode emittances and of ten lattice parameters:
| (1) | |||
| (2) |
where are the eigenmode functions at the source point, , , is a quasi-symplectic matrix describing coupling between and , , and are the dispersive contributions to the projected beam sizes. - coupling also manifests itself by a tilted profile-monitor image:
| (3) | |||||
| (4) |
The eigenemittance being an invariant, it should not depend on where around the ring it is measured. In order to verify the consistency of the fitted lattice functions with the profile-monitor data, dedicated beam-size measurements were performed at low bunch currents in both single- and colliding-beam configurations. Table 1 summarizes the eigenemittances inferred using various combinations of input measurements. The errors quoted assume a 10% uncertainty on each measured spot size and on the tilt angles. The results for are consistent within errors. The unphysical values of are probably due to the fact that the vertical beam size is dominated by , so that small measurement or lattice-function errors have a disproportionate impact on . In contrast, the nominal coupling is zero at and its measurement intrinsically more reliable. The most robust LER result is provided by a constrained SVD fit that combines all the experimental information available at and . Except for which is more than a factor of two larger than expected, the eigenemittances inferred from the profile monitors are acceptably consistent with those predicted by the simulation.
An additional check is provided by collision data. The and IP spot sizes are estimated by combining profile-monitor results with the values of the lattice parameters extrapolated to the IP. The resulting predicted overlap beam sizes () and tilts can then be compared to those measured by an overconstrained set of beam-beam scans [10]. This procedure is only feasible at low bunch current, when the beam-beam parameters are small enough not to distort the one-turn matrix or render such scans impractical. The results are summarised in Table 2. The discrepancy between the measured and predicted values of is due to the unphysically large value of . If instead one estimates using and , one obtains -, which is closer to expectations than the value inferred from . Similarly, the specific luminosity inferred from ( ) is consistent with that directly measured by the radiative-Bhabha monitor (), and significantly larger than that predicted using (). The primary mirror for (a water-cooled mirror in vacuum that withstands a large heat load) is known to have mechanical stresses that may distort the image somewhat.
| Input | Major axis () | Minor axis () | () |
|---|---|---|---|
| -11.3 | |||
| -16.7 | |||
| -15.7 | |||
| 169.4 | 6.7 | -7.3 |
Spot sizes were also recorded at somewhat higher currents. In the absence of collisions and with an current far below any potential -cloud threshold, the emittances should remain the same. The observed values are comparable to the low-current results (Table 1). The increase in may be caused by thermal orbit distortions. The already large horizontal HER spot size appears to grow with current.
Data recorded with high-current colliding beams exhibit a sizeable increase in the vertical and in both spot sizes, which is qualitatively consistent with the dynamic- effect and with beam-beam vertical blowup. But the observed spot sizes result in inconsistent emittance estimates, presumably highlighting the fact that the additional focusing caused by the beam-beam interaction must imperatively be taken into account in the one-turn matrix.
3 LUMINOUS-REGION ANALYSIS
The size of the luminous ellipsoid [6] and the transverse-boost distribution [7] of the colliding electron and positron are measured using events reconstructed in the BABAR detector. The spatial variation of these observables is determined by the emittances, IP -functions and waist locations of the colliding beams.
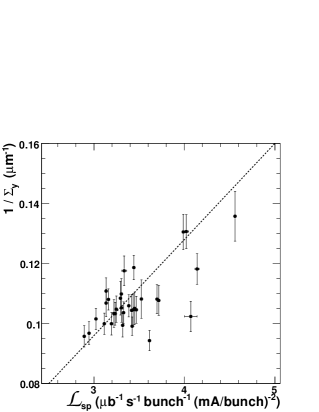
In the horizontal plane, is much larger than the bunch lengths , so the horizontal beam parameters are only weakly apparent in the -dependence of luminous-region variables. But in the vertical plane, , resulting in an observable -dependence of the luminosity, of the angular spread of the boost direction and of the vertical size of the luminous region. Fitting an effective IP -function to the first two observables and neglecting - coupling yields similar results, in the range of 12–16 mm [6]; fits to yield somewhat higher values, but with larger systematic uncertainties. An effective vertical emittance can then be extracted from ; the more powerful boost technique allows to determine both the HER and LER emittances, yielding 2.5–9 - (again under the no-coupling assumption) [7]. Combining the emittance and results from the boost measurement yields estimates of in the range of 7–10 m, that displays the expected anticorrelation with the specific luminosity (Fig. 2). Because , the slope of this correlation provides a measurement of .
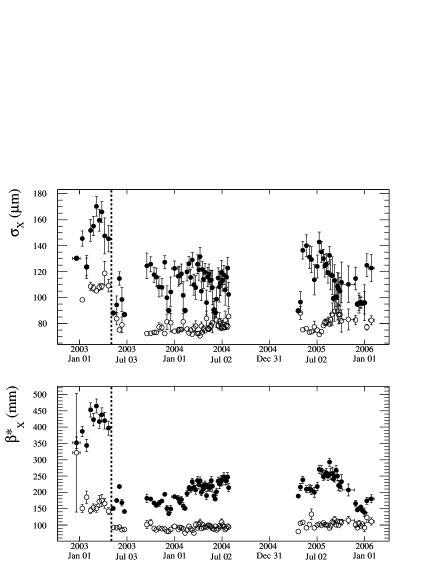
Further combining with the horizontal luminous size [6] determines both and horizontal IP spot sizes (Fig. 3). These are then finally combined with the horizontal-boost angular spread and the horizontal angle-position correlation [7] to extract . The reduction in horizontal spot size caused by the dynamic- effect is strikingly apparent. The value of extracted from BABAR data before the move to the half-integer, is consistent with low-current phase advance measurements recorded at that time. In the same period however, the corresponding result is significantly smaller than the phase-advance measurements. In addition, the horizontal LER emittance implied by Fig. 3 is surprisingly large, possibly signaling an inconsistency in this preliminary analysis.
4 CONCLUSION
Confronting IP beam sizes extrapolated from the profile monitors with a detailed phase-space characterization based on luminous-region observables would provide invaluable consistency checks, as well as restrict systematic uncertainties. Two main ingredients are required to this effect. First, beam-beam focusing needs to be taken into account in the one-turn matrix of Ref. [10]; guidance can be provided here by beam-beam simulations. Second, - coupling at the IP needs to be incorporated in the luminous-region analyses, as its impact has recently been shown [6, 7] to be significant.
References
- [1] BABAR Collaboration, B. Aubert et al., Nucl. Instr. Methods Phys. Res., Sect. A 479, 1 (2002).
- [2] J. Seeman et al., EPAC-2006-MOPLS045.
- [3] A. Fisher et al., AIP Conference Proceedings 451, Woodbury, NY: American Institute of Physics 95-109 (1998).
- [4] A. Fisher et al., SLAC-PUB-10528 (2004).
- [5] A. Fisher et al., SLAC-PUB-8867 (2001).
- [6] J. Thompson et al., SLAC-PUB-11222 (2005); B. Viaud et al., SLAC-PUB-11900 (2006).
- [7] M. Weaver et al., SLAC-PUB-11906 (2006).
- [8] Y. Yan et al., SLAC-PUB-11209 (2005).
- [9] Y. Cai et al., SLAC-PUB-7642 (1997); Y. Cai et al., EPAC-2006-MOPLS052.
- [10] Y. Cai, SLAC-PUB-8479 (2000).