Current Address: ]National Institute of Standards and Technology, 325 S. Broadway Boulder, CO 80305-3322
Nonlinear magneto-optical rotation, Zeeman and hyperfine relaxation of potassium atoms in a paraffin-coated cell
Abstract
Nonlinear magneto-optical Faraday rotation (NMOR) on the potassium D1 and D2 lines was used to study Zeeman relaxation rates in an antirelaxation paraffin-coated 3-cm diameter potassium vapor cell. Intrinsic Zeeman relaxation rates of were observed. The relatively small hyperfine intervals in potassium lead to significant differences in NMOR in potassium compared to rubidium and cesium. Using laser optical pumping, widths and frequency shifts were also determined for transitions between ground-state hyperfine sublevels of 39K atoms contained in the same paraffin-coated cell. The intrinsic hyperfine relaxation rate of Hz and a shift of Hz were observed. These results show that adiabatic relaxation gives only a small contribution to the overall hyperfine relaxation in the case of potassium, and the relaxation is dominated by other mechanisms similar to those observed in previous studies with rubidium.
pacs:
33.55.Ad,33.55.Fi,32.30.Bv,32.70.Jz,32.80.Bx,95.55.ShI Introduction
The drive to develop small atomic clocks, gyroscopes, and magnetometers has drawn interest to miniature antirelaxation-coated alkali-atom vapor cells near in volume (see for example Ref. Budker et al. (2005) and references therein). The large surface-to-volume ratio of small vapor cells means that the interactions of the confined atoms with the cell walls are particularly important. These interactions can cause spin de-coherence and limit the performance of such cells in atomic clocks and magnetometers. The use of antirelaxation coatings reduces these effects and may provide an alternative to small buffer gas cells Balabas et al. (2006).
In this research, we study nonlinear magneto-optical rotation and the Zeeman and hyperfine relaxation rates in potassium atoms in a paraffin-coated vapor cell. Similar investigations in rubidium and cesium vapor cells have yielded information on relaxation mechanisms for these atoms in coated cells Budker et al. (2005); Graf et al. (2005), and contributed to the development of sensitive nonlinear-optical-rotation magnetometers that are used, for example, for detecting nuclear magnetization Yashchuk et al. (2004); Xu et al. (2006).
In addition to yielding information on the wall-relaxation processes, these measurements are also motivated by an idea that the use of K atoms in secondary frequency references (clocks) may be advantageous compared to the use of Rb or Cs.
A figure of merit for a frequency reference is , where is the frequency of the transition, and is the absolute frequency stability that scales with the transition width. Suppose that the width of the hyperfine-structure transition is dominated by adiabatic collisions. It has been established that for such collisions, the average phase shift during a collision is proportional, among other factors, to the hyperfine-structure frequency (see, for example, Refs. Vanier et al. (1974); Budker et al. (2005) and a detailed discussion and further references in Ref. Vanier and Audoin (1989), Ch. 3.4). Since the relaxation rate scales as the square of the phase shift, a lower-frequency alkali hyperfine-structure transition (for example, the hyperfine-structure transition in 41K at MHz) may turn out to be advantageous for a clock.
The significantly smaller hyperfine-structure intervals of potassium lead to a considerably different, generally, much smaller nonlinear Faraday rotation associated with creation and detection of atomic alignment. Here we study some specific features of the nonlinear magneto-optical rotation in potassium and measure the rate of its spin relaxation. A comparison with the results for other alkali atoms will enable a better understanding of the mechanisms that cause spin relaxation, and aid in determining the feasibility of making ultra-sensitive magnetometers and small atomic clocks using paraffin-coated cells. This work is also complementary to the studies of spin-exchange relaxation in potassium Aleksandrov et al. (1999, 2002).
The cell studied in this work contains potassium with a natural abundance (). The overwhelming abundance of in comparison with the other two isotopes makes the contribution of this isotope to magneto-optical rotation dominant. Thus in the following, we will only be concerned with .
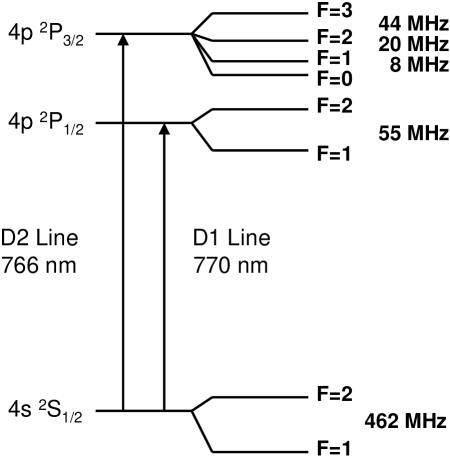
The hyperfine structure of consists of hyperfine levels in the ground state, with an energy splitting of . The upper levels of interest in this work are the and (Fig.1).
Faraday rotation due to coherence effects (see, for example, review Budker et al. (2002a)) relies on the ability to create and detect atomic alignment in the ground state. The alignment is produced via the atoms’ interactions with resonant linearly polarized light which optically pumps the atoms. In the presence of a magnetic field, the alignment evolves (in the case of weak light field, the evolution is Larmor precession; a more complex evolution occurs at elevated light powers Budker et al. (2000)). The optical anisotropy of the evolved medium results in a rotation of the light polarization.
The extent to which alignment can be created in the ground state by optical pumping and the optical anisotropy associated with this alignment both depend on the upper-state hyperfine structure being resolved. The reason for this is that the electronic angular momentum of the initial state is , and such a state cannot support polarization moments with rank higher than . Optical rotation via the mechanism discussed here requires (alignment; see, for instance, Ref. Budker et al. (2002a)). In the limit where hyperfine structure is completely unresolved, we can neglect the nuclear-spin part of the wavefunction. However, since the electronic state cannot support alignment, it is impossible to create or detect alignment of the initial state with light.
In , the splitting of the state is 55.6 MHz, and the splittings of the state are 44.4 MHz, 20.4 MHz, and 7.5 MHz. The Doppler width in this work is , thus there is a considerable suppression of nonlinear Faraday rotation on both the D1 and D2 lines compared with rubidium and cesium where the upper-state hyperfine intervals are on the order of the Doppler width.
II Apparatus and Procedure
We employ the technique of nonlinear magneto-optical rotation with frequency modulated light (FM NMOR) Budker et al. (2002b) and study the zero-field FM NMOR resonance. The signal we detect is the amplitude of optical rotation synchronous with the laser-frequency modulation.
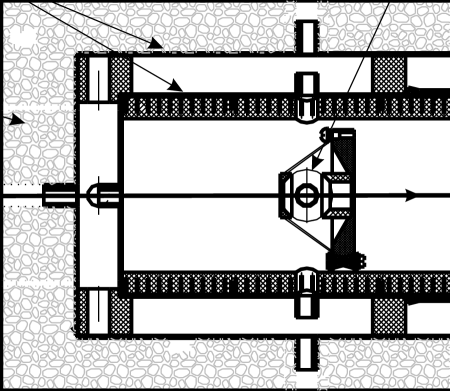
The experimental apparatus (Fig. 2) incorporates a spherical glass cell with inner diameter of cm and inner walls coated with paraffin. A sample of solid potassium metal is contained in a stem connected to the cell with an opening approximately mm in diameter. The cell was made by M. V. Balabas using the technology outlined, for example, in Ref. Alexandrov et al. (2002).
The cell is placed within a magnetic shielding assembly. The shielding consists of three nested 0.5-mm thick layers of Co-Netic AA high-permeability alloy. Each layer is cylindrical in shape. Starting with the innermost shielding layer, the radii of the layers are 5.08, 8.26, and 11.43 cm, with lengths of 21.33, 26.90, and 35.56 cm, respectively. Within the magnetic shielding is a set of coils for application of magnetic fields and gradients, allowing us to reduce the effects of residual magnetization in the shielding, and to investigate nonlinear magneto-optical rotation as a function of the magnetic field. Magnetic fields can be applied along the direction of the cylinder, which we define as the z-axis, as well as along the two transverse axes, x and y. There are two additional sets of coils for the and gradient fields. The presence of magnetic fields transverse to the direction of light propagation changes the shape of the longitudinal magnetic-field dependence of the optical rotation Budker et al. (1998). By applying magnetic fields in the transverse x- and y-directions, and scanning the magnetic field in the z-direction, we were able to compensate, using the observed lineshapes, the residual magnetic fields along the x and y directions to within .
Laser light from a New Focus Velocity diode laser (that could be tuned to either D1 or D2 transition) was frequency modulated by scanning the external cavity of the laser with a piezo-electric actuator. The frequency of the light was modulated at 1 kHz with a modulation depth of . Part of the laser light was sent to an uncoated potassium vapor cell used as a reference for frequency stabilization purposes. The remaining light was attenuated and sent to the coated vapor cell.
At room temperature the density of potassium atoms is . Heating the reference cell to increases this density to . The laser light that passed through the reference cell was detected with a photodiode and demodulated with a lock-in amplifier that monitored the second harmonic of the photodiode signal. This signal was digitized with a data acquisition board and was kept at a fixed level by generating a computer-controlled voltage which was fed back to the frequency-control input of the laser.
The coated vapor cell was also heated. Plastic tubing with 0.4-cm diameter was wrapped into ten turns with a -cm diameter. These coils were attached to a Teflon cell holder using four Teflon posts extending from the holder. Pressurized air was run through copper tubing placed in boiling water and sent through the tubing surrounding the cell. The hot air in the tubing convectively heated the air surrounding the vapor cell. Based on unsaturated resonance atomic absorption of for the D1 transition and for the D2 transition, the atomic density was estimated as . This corresponds to an estimated temperature of the cell of C (neglecting possible deviations from the saturated-vapor density that may occur in a coated cell).
The light that has passed through the vapor cell was analyzed with a balanced polarimeter incorporating a polarization prism and two large-area photodiodes. The output of the photodiodes was sent to the differential input of a lock-in amplifier whose first-harmonic output was digitized and recorded by the computer.
Nonlinear Faraday rotation was measured at fixed tuning of the central frequency of the laser as a function of the longitudinal magnetic field over the range of . Measurements were done with laser-light power going into the coated cell between 2 and . Over this range of light powers, there was considerable variation of the magnitude and magnetic-field dependence of the Faraday-rotation.
The choice of the central laser frequency at which to lock was determined by scanning over the potassium resonance with a fixed magnetic field. The laser central frequency was then locked where the Faraday rotation signal was the largest. Once the lock point was determined, the magnetic field was scanned with decreasing and increasing magnetic field values symmetrically around zero using a computer-generated triangular wave.
Several acquisitions were averaged before changing the magnetic field value. Scans at low light power, lasted about 20 minutes, and scans at high light power, , lasted about 4 minutes. Such long integration times were necessary because the optical-rotation amplitudes at the lowest light powers were as low as rad, while the noise of the polarimeter exceeded the shot-noise limit by a factor of a few.
III Results for Zeeman Relaxation Rates
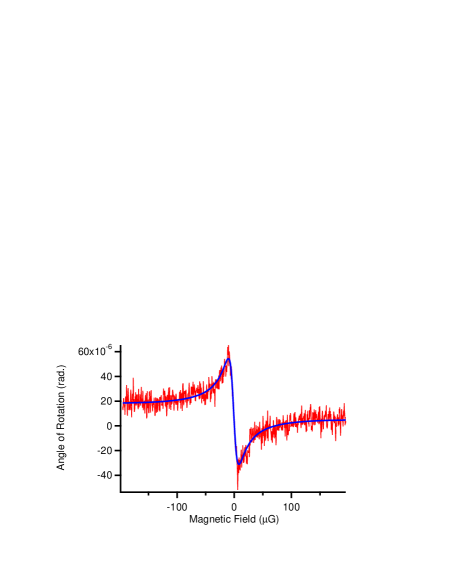
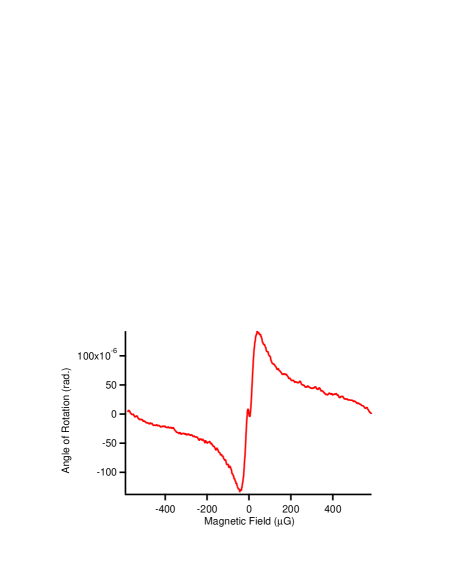
The intrinsic Zeeman relaxation rate for a given vapor cell can be found from the low-light-power limit of the width of the Faraday rotation curves such as the one shown in Fig. 3 Budker et al. (1998, 2005). This is done by fitting the amplitude as a function of magnetic field to a dispersive lineshape to determine the width at a given light power. The intrinsic width is determined by linear extrapolation of the power dependence of the widths. Figure 3 shows typical data and fit for the D1 transition.
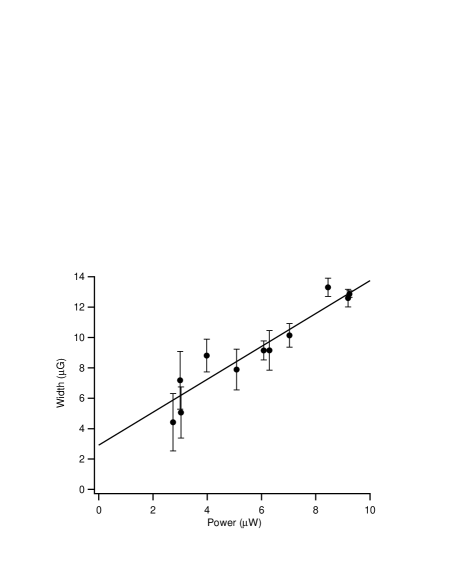
Performing a linear extrapolation at light powers less than gives a light-independent magnetic field width of for the data taken with the D1 transition (Fig. 4). Here is the difference in the magnetic field between the two extrema. This corresponds to a Zeeman relaxation rate of
| (1) |
( is the ground-state Land factor; is the Bohr magneton). The error bars for these data were increased by about a factor of two compared to our estimates for individual fits in order to obtain a reduced .
Low-power data were also taken for the D2 transition. In contrast to the D1 case, for the D2 transition evidence of saturation was seen even at powers of just a few W. In this low-power regime, the signal sizes were on the order of the background noise and we were unable to obtain satisfactory data for the low powers required to get a linear fit (the D2 data alone would indicate an intrinsic linewidth of ).
It is interesting to compare the present results for the Zeeman relaxation rate with the results of Ref. Budker et al. (2005) for Rb at similar vapor densities. In the work of Ref. Budker et al. (2005) the diameter of the vapor cells ranged from 3.4 cm to 10 cm and the corresponding relaxation rates ranged between 3.5 and . An analysis of possible relaxation mechanisms, including spin-exchange relaxation, exchange of atoms with the metal reservoir (the cell stem), etc., resulted in a conclusion that an additional relaxation mechanism is present for Rb (and Cs Graf et al. (2005)), possibly related to electron-spin randomization collisions on the wall.
In the present experiment with a potassium cell, whose result is given in Eq. (1), the estimated spin-exchange contribution to the relaxation rate is
| (2) |
where 1/2 is the appropriate “nuclear slow-down factor” for NMOR in alkali atoms with nuclear spin Budker et al. (2005), is the atomic density,
| (3) |
is the average relative speed of the atoms, is the reduced mass of the colliding atoms, and is the spin-exchange-collision cross section Aleksandrov et al. (1999, 2002).
The relaxation rate due to exchange of atoms with the stem is estimated to be Hz with a large uncertainty due to the difficulty of accounting for the specific geometry of the stem. Therefore, the observed relaxation rate is not inconsistent with the known sources of relaxation. Additional relaxation mechanisms that were found with Rb and Cs contribute to the NMOR linewidth at a level Hz or less.
IV Specific High-Power Feature of NMOR in K
At sufficiently high light power, a second narrower feature appears imbedded within the main Faraday rotation curve (Fig. 5).
The nested Faraday curve is due to potassium’s relatively small ground-state hyperfine splitting, in comparison to its Doppler width. The laser’s central frequency is detuned to the low-frequency side of the absorption curve, so the light preferentially interacts with the atoms in the ground state. Thus, rotation of the light polarization is due to precession of atomic alignment in the hyperfine level. However, there is also a contribution from the hyperfine level since the ground-state hyperfine structure is not well resolved. As the laser light power is increased, the more resonant transition from the hyperfine level is power-broadened more than the less resonant transition from the hyperfine level. Thus, rotation due to atomic alignment in the hyperfine level shows up as a narrower feature nested within the power-broadened Faraday rotation due to rotation of atomic alignment in the hyperfine level.
V Investigation of hyperfine-structure transitions
Here we present the measurements of intrinsic linewidths and shifts of the hyperfine-structure transitions performed with potassium atoms in the paraffin-coated vapor cell.
Using the technique of optical pumping and radio-optical double resonance Happer (1972), we investigated the “clock transition” in 39K, which is to first order insensitive to external DC magnetic fields and gradients.
The apparatus and procedure were similar to those described above, except, instead of optical rotation, we measured the changes in transmission of the light through optically pumped vapor when radio-frequency magnetic field driving the hyperfine-structure transitions was applied. This was done similarly to our earlier work with Rb Budker et al. (2005). The highest signal amplitudes (for the range of the experimental parameters used in this work) were observed for the laser frequency detuned MHz to the low-frequency side of the peak of the D1 resonance.
Based on unsaturated resonance atomic absorption, in these measurement, the atomic density was estimated as .
Radio-frequency transitions between hyperfine states of potassium were driven using an HP8647A signal generator. The output of the generator was connected via coaxial cable with a 9-mm diameter wire loop terminating a coaxial cable, inserted inside the innermost magnetic shielding next to the vapor cell. The signal generator was referenced to the MHz signal from a commercial wireless-network-referenced atomic clock (Symmetricom TS2700); the frequency of the generator’s output was monitored with a Stanford Research Systems SR620 frequency counter also referenced to the TS2700 clock. The consistency of the frequency set by the generator and the reading from the frequency counter was better than Hz. Scans over the hyperfine transition were performed by sweeping with 1-Hz steps the sine-wave frequency generated by the synthesizer in the vicinity of the free-space separation of the ground-state hyperfine components of 39K: 461,719,720.1 Hz Arimondo et al. (1977).
The hyperfine-transition spectra were measured at fixed tuning of the laser frequency and the longitudinal magnetic field of mG, which was found to be sufficient to distinguish and separate the 0-0 transition (an example of the recorded spectrum showing resolved Zeeman components is shown in Fig. 6).

Data were taken for a range of light and rf powers. Averaging over scans was necessary because of weak amplitudes of rf resonances at low powers. The duration of a single scan was min dominated by the settling time of the rf frequency synthesizer (0.2 s).
An example of an experimental scan over the isolated 0-0 transition is shown in Fig. 7. In the case of K, the wavelength of the hyperfine-structure transition cm is significantly larger than the vapor cell, meaning that the system is in the Dicke-narrowing regime, and there is no Doppler pedestal in the resonance spectra.

Hyperfine frequency shifts and relaxation rate were found from the low-light and low-rf-power limit of the double-resonance curves. We fit data for a given rf and light power with a Lorentz profile and extract the width and the central frequency of the resonance. The linewidths dependence on the rf and light power due to power broadening, in the low-power limit, becomes linear and it is possible to perform double extrapolation of the resonance center and linewidths to zero power, and thus to determine the intrinsic hyperfine-transition frequency shift and relaxation rate for a given cell. Results of the fitting for each light and rf power are shown in Figs. 8 and 9. Extrapolation to zero power was first performed for light power [Fig. 9] and then for rf power [Fig. 10]. Within experimental uncertainties, the central position of the resonance did not exhibit any systematic dependence on the light and rf power.


Finally, based on all measurement, the shift was found to be Hz, and the intrinsic linewidth was found to be Hz.
VI Interpretation of the hyperfine-transition linewidth and shift
Here we present the analysis of the above results that follows a similar analysis that was carried out for Rb in Ref. Budker et al. (2005).
The spin-exchange-relaxation contribution to the linewidth of the hyperfine resonance can be estimated as follows. For a single isotope with nuclear spin present in the cell, the spin-exchange contribution is given by an equation [similar to Eq. (2)]:
| (4) |
where is the nuclear slow-down factor for the 0-0 transition. With the temperature and density used in the present experiment, one calculates:
| (5) |
The relaxation rate due to exchange of atoms with the stem must be consistent with that for the case of NMOR. With the adopted definitions of , and , we estimate (again, with a large uncertainty):
| (6) |
Adiabatic wall collisions are the most “gentle” collisions of alkali atoms with the wall coating. They do not result in population transfer or Zeeman decoherence, but they introduce a phase-shift between hyperfine states. The phase-shift acquired by the atoms have a statistical character, which leads to a shift of the resonance and contributes to its width:
| (7) |
where is the characteristic time between wall collisions, is the cell radius and is the average speed of atoms. The average phase-shift can be determined from the fact that the resonance frequency shift is . This yields
| (8) |
which is in the range that may be expected from the phase shifts observed with the two Rb isotopes and Cs (see Refs. Budker et al. (2005); Vanier and Audoin (1989) and references therein) if one assumes linear scaling of the phase shift with the hyperfine interval. (The phase shift is also a strong function of the surface binding energy. The observed phase-shift scaling suggests that the surface binding energies are comparable for Rb, Cs, and K.)
The contribution to the hyperfine transition linewidth calculated on this basis is:
| (9) |
Summing the contributions from Eqs. (6),(5), and (9), we can account for about Hz out of the total observed hyperfine-transition width of Hz.
A possible additional contribution to relaxation could be coming from alkali-vapor density dependent spin-randomization wall collisions, as discussed for Rb and Cs in Refs. Budker et al. (2005); Graf et al. (2005). In this experiment, this contribution may have been more pronounced for the hyperfine transitions because they were measured at higher potassium vapor density. In future work this effect could be explored more definitively by performing Zeeman and hyperfine relaxation measurements concurrently, and as a function of the potassium vapor density. It would also be interesting to measure the rate of longitudinal (T1) relaxation on the 0-0 transition to which adiabatic collisions do not contribute.
VII Conclusion
We have studied nonlinear magneto-optical rotation and Zeeman relaxation rates of potassium contained in a 3-cm-diameter paraffin-coated cell. The magnitude of the nonlinear rotation due to atomic alignment is significantly suppressed in K compared to Rb and Cs owing to the small upper-state hyperfine-structure intervals. The fact that the ground-state hyperfine separation is comparable to the Doppler width leads to the appearance of a peculiar nested feature observed in the magnetic-field dependence of the optical rotation at relatively high light powers. The measured intrinsic ground-state relaxation rate of about 2 Hz is consistent with estimated relaxation due to spin-exchange collisions and the exchange of atoms between the volume of the vapor cell and the stem. This is evidence of the high quality of the coating and a direct illustration of the remarkable properties of paraffin as the coating material Robinson et al. (1958); Bouchiat and Brossel (1966): it takes on the order of collisions of a polarized atom with the paraffin-coated wall to induce relaxation. We have also measured the frequency shift and linewidth of the hyperfine 0-0 clock transition. The measured frequency shift in 39K is smaller than that in Rb and Cs, approximately in proportion to the transition frequency. This indicates that the contribution of the adiabatic collisions to the hyperfine-transition linewidth is very small [Eq. (9)]. This supports the idea that if adiabatic relaxation was the dominant relaxation mechanism, it would be beneficial to use potassium (rather than the higher transition frequency alkalis such as 87Rb and Cs) for secondary frequency references in coated cells. Unfortunately, additional relaxation mechanisms exist (as seen in the present measurement), which largely remove the possible advantages.
VIII Acknowledgements
The authors are grateful to E. B. Alexandrov, D. F. Jackson Kimball, D. English, M. Auzinsh, S. M. Rochester, J. Higbie, and W. Gawlik for helpful discussions. This work was supported by DOD MURI grant N-00014-05-1-0406, and by NSF US-Poland collaboration grant and REU supplement.
References
- Budker et al. (2005) D. Budker, L. Hollberg, D. F. Kimball, J. Kitching, S. Pustelny, and V. V. Yashchuk, Physical Review A 71, 012903 (2005).
- Balabas et al. (2006) M. V. Balabas, D. Budker, J. Kitching, P. D. D. Schwindt, and J. E. Stalnaker, Journal of the Optical Society of America B (Optical Physics) 23 (2006).
- Graf et al. (2005) M. T. Graf, D. F. Kimball, S. M. Rochester, K. Kerner, C. Wong, D. Budker, E. B. Alexandrov, M. V. Balabas, and V. V. Yashchuk, Physical Review A 72, 023401 (2005).
- Yashchuk et al. (2004) V. V. Yashchuk, J. Granwehr, D. F. Kimball, S. M. Rochester, A. H. Trabesinger, J. T. Urban, D. Budker, and A. Pines, Physical Review Letters 93, 160801 (2004).
- Xu et al. (2006) S. Xu, V. V. Yashchuk, M. H. Donaldson, S. M. Rochester, D. Budker, and A. Pines, Submitted (2006).
- Aleksandrov et al. (1999) E. B. Aleksandrov, M. V. Balabas, A. K. Vershovskii, A. I. Okunevich, and N. N. Yakobson, Optics and Spectroscopy 87, 329 (1999).
- Aleksandrov et al. (2002) E. B. Aleksandrov, M. V. Balabas, A. K. Vershovskii, A. I. Okunevich, and N. N. Yakobson, Optics and Spectroscopy 93, 488(E) (2002).
- Budker et al. (2002a) D. Budker, W. Gawlik, D. F. Kimball, S. M. Rochester, V. V. Yashchuk, and A. Weis, Reviews of Modern Physics 74, 1153 (2002a).
- Budker et al. (2000) D. Budker, D. F. Kimball, S. M. Rochester, and V. V. Yashchuk, Physical Review Letters 85, 2088 (2000).
- Budker et al. (2002b) D. Budker, D. F. Kimball, V. V. Yashchuk, and M. Zolotorev, Physical Review A (Atomic, Molecular, and Optical Physics) 65, 055403 (2002b).
- Alexandrov et al. (2002) E. B. Alexandrov, M. V. Balabas, D. Budker, D. English, D. F. Kimball, C. H. Li, and V. V. Yashchuk, Physical Review A 66, 042903/1 (2002).
- Budker et al. (1998) D. Budker, V. Yashchuk, and M. Zolotorev, Physical Review Letters 81, 5788 (1998).
- Vanier et al. (1974) J. Vanier, J. F. Simard, and J. S. Boulanger, Physical Review A (General Physics) 9, 1031 (1974).
- Vanier and Audoin (1989) J. Vanier and C. Audoin, The quantum physics of atomic frequency standards (A. Hilger, Bristol ; Philadelphia, 1989).
- Happer (1972) W. Happer, Reviews of Modern Physics 44, 169 (1972).
- Arimondo et al. (1977) E. Arimondo, M. Inguscio, and P. Violino, Reviews of Modern Physics 49, 31 (1977).
- Robinson et al. (1958) H. Robinson, E. Ensberg, and H. Dehmelt, Bulletin of the American Physical Society 3, 9 (1958).
- Bouchiat and Brossel (1966) M. A. Bouchiat and J. Brossel, Physical Review 147, 41 (1966).