]www.unifr.ch/physics/frap/
Rb∗Hen exciplexes in solid 4He
Abstract
We report the observation of emission spectra from Rb∗Hen exciplexes in solid 4He. Two different excitation channels were experimentally identified, viz., exciplex formation via laser excitation to the atomic 5 and to the 5 levels. While the former channel was observed before in liquid helium, on helium nanodroplets and in helium gas by different groups, the latter creation mechanism occurs only in solid helium or in gaseous helium above 10 Kelvin. The experimental results are compared to theoretical predictions based on the extension of a model, used earlier by us for the description of Cs∗Hen exciplexes. We also report the first observation of fluorescence from atomic rubidium in solid helium, and discuss striking differences between the spectroscopic feature of Rb-He and Cs-He systems.
pacs:
32.30.-r, 33.20.-t, 33.20.Ea, 67.40.Yv, 67.80.-sI Introduction
The formation process of alkali-Hen exciplexes, i.e., of bound states of an excited alkali atom with one or more ground state helium atoms, was studied in recent years in superfluid Hirano et al. (2002, 2003) and in solid Nettels et al. (2005) helium. These studies have given support to earlier proposals Dupont-Roc (1995); Kanorsky et al. (1995), which tentatively explained the quenching of atomic fluorescence from light alkali atoms (Li, Na, K) in condensed helium by the formation of alkali-helium exciplexes, whose emission spectra are strongly red-shifted with respect to the atomic resonance lines. Exciplex formation was also studied on the surface of helium nanodroplets Bünermann et al. (2004); Schulz et al. (2001); Brühl et al. (2001); Reho et al. (2000a, b) and in cold helium gas Enomoto et al. (2004); Hirano et al. (2002, 2003). Recently we have performed an experimental and theoretical study of the Cs∗Hen exciplex formation process in the hcp and bcc phases of solid 4He Moroshkin et al. (2006a). A comparison with the results of Hirano et al. (2002, 2003) has revealed that the exciplex formation mechanism in solid helium differs from the one in superfluid helium and in cold helium gas. We concluded that exciplexes in solid helium result from the collective motion of several nearby helium atoms which approach the Rb atom simultaneously, while in liquid and gaseous helium the binding of the helium atoms proceeds in a time sequential way.
The motivation for the present study of the Rb-He system arose from the question whether the collective mechanism is specific for Cs in solid helium, or whether it also holds for other alkali atoms. While the light alkali atoms (Li, Na, K) do not emit resonance fluorescence when excited in condensed helium, atomic cesium fluoresces both in superfluid and in solid helium, when excited on the D1 transition. Rubidium represents an intermediate case, as it was reported Kinoshita et al. (1996a) to fluoresce in liquid helium when excited on the D1 transition with a yield which is strongly quenched with increasing He pressure. No fluorescence from Rb in solid helium was observed in the past, although it was shown that optically detected magnetic resonance can be used to detect light absorption on its D1 transition Eichler et al. (2002).
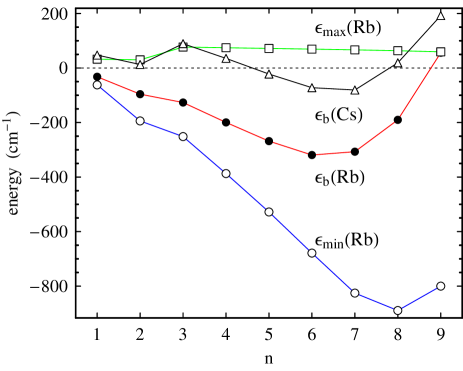
A major difference between cesium and rubidium exciplexes Rb/Cs(A)Hen becomes apparent from Fig. 1 which shows the calculated binding energies (Rb) ((Cs)) of the exciplexes as a function of the number of bound helium atoms for Rb (Cs). For Cs only exciplexes with 5, 6 and 7 helium atoms have their energy below the dissociation limit and are therefore stable, while for Rb all exciplexes with are stable.
For cesium the binding energy has a local minimum for (quasi-bound complex) and there is a potential barrier that hinders the formation of exciplexes with more than 2 helium atoms in a sequential manner. As evidenced by the measurements of Hirano et al. (2002) the Cs∗Hen=2 exciplex is therefore the largest complex that can be formed by a sequential attachment of He atoms. Larger complexes can only be formed in a collective way, which becomes possible in pressurized solid helium Nettels et al. (2005). The largest stable complex will be the one with the lowest binding energy. For Rb all the exciplexes with are stable, so once the Rb∗Hen=1 exciplex is created all larger complexes can be formed with high probability by the sequential filling of the helium ring until the state with the lowest binding energy is reached. In helium environments with lower densities than pressurized solid helium the time intervals between successive attachments is long enough to permit the exciplex to fluoresce, so that fluorescence from all intermediate exciplexes Rb∗Hen=1…6 can be observed in gaseous helium Hirano et al. (2003). The results presented below indicate that in solid He the Rb(A)Hen formation process is so rapid that any intermediate configurations have no time to emit fluorescence. For Rb in solid helium one therefore expects that only the most strongly bound Rb∗He6 exciplex is formed.
In Sec. II we review the theoretical model for the description of exciplex spectra developed in Moroshkin et al. (2006a) and extend it to the Rb-He system. In Sec. III we introduce the experimental setup and present experimental emission and excitation spectra of rubidium-helium exciplexes. In Sect. IV we compare the experimental results with the theoretical model calculations as well as other experiments and discuss the different decay channels of excited Rb in solid helium.
II Theory
We briefly describe the theoretical approach of our calculation of the Rb∗Hen exciplex emission spectra for . The model used is an extension of the calculations performed earlier for cesium-helium exciplexes Moroshkin et al. (2006a); Nettels et al. (2005) and we shall review only the basic principles and assumptions. We consider only the interaction of the excited Rb atom with the helium atoms that form the exciplex and neglect the influence of the helium bulk. The largest perturbation comes from the close helium atoms that form the exciplex and it is therefore a good approximation to neglect the helium bulk. The interaction between the Rb atom and one ground state helium atom is described as a sum over semi-empirical pair potentials Pascale (1983)
| (1) |
where is the position of the i-the helium atom with respect to the position of the Rb atom. After including the spin-orbit interaction of the Rb valence electron and the helium-helium interaction, , modeled as the sum over interaction potentials Aziz and Janzen (1995) between neighboring helium atoms the total interaction Hamiltonian is given by
| (2) |
where cm-1 is the fine structure splitting
of the rubidium state in the free atom. is the
orbital angular momentum operator and the electronic
spin operator. Next, the total interaction operator
is represented in the basis
and diagonalized algebraically. Exciplexes of two
different structures are formed as in the case of cesium-helium
exciplexes. When one or two helium atoms are bound the electronic
wavefunction has an apple shape with the helium atoms attached in
its dimples, whereas for the electronic wavefunction has a
dumbbell shape, with the bound helium atoms distributed along a
ring around the dumbbell’s waist. The potential curves leading to
the formation of these two classes of structures are represented
in Fig. 2 using the examples of
Rb∗He2 and Rb∗He6. The potential curves
shown represent the -dependent eigenvalues of the operator
of Eq. (2).
In
the same figures we also show the ground state potentials .
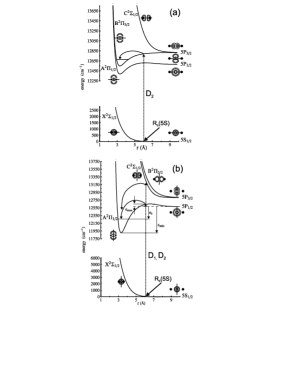
As can be seen from Fig. 2(a) the energetically most favorable formation channel for Rb∗He2 proceeds via D2 excitation; when two helium atoms approach along the nodal line of the apple-shaped electron distribution of the B state, they are attracted into the potential minimum. When the system is excited on the D1 transition the approaching helium atoms see a repulsive spherical electronic distribution of the Rb atom at large distances with a potential barrier of 29. We recall that the corresponding barrier height in cesium is 79 Moroshkin et al. (2006a) due to the larger spin-orbit interaction energy in that atom Dupont-Roc (1995). The approaching helium atoms deform the electronic configuration of the state from spherical to apple shaped.
The exciplexes with [Fig. 2(b)] have no potential well in the B state, which is purely repulsive and which correlates to the atomic state. However, the A state possesses a potential well and a potential barrier. The barrier is associated with the transformation of the electronic wavefunction from spherical to dumbbell-shaped when several helium atoms approach the Rb atom. Exciplexes with can only be formed in the A state.
The electronic distributions of the rubidium-helium system for the different states at various interatomic separations are illustrated by pictographs in Fig. 2. The solid lines represent the quantization axis, which is the internuclear axis for Rb∗Hen≤2 and the symmetry axis of the helium ring for the Rb∗Hen>2 complexes, while helium atoms are drawn as filled disks with a radius of 3.5 Å.
In a next step we have calculated the vibrational zero-point energies for all Rb∗Hen for . Details of this calculation were discussed in Moroshkin et al. (2006a) for the case of cesium. Only the lowest vibrational state is considered as higher vibrational states are not populated at the temperature (T=1.5 K) of the experiment. The binding energies (Rb), (Cs), the well depths (Rb) and the barrier heights (Rb) are shown in Fig. 1 for Rb(A)Hen=1…9.
As a last step we calculate the emission spectra of all Rb∗Hen=1…9 exciplexes under the Franck-Condon approximation as discussed in Moroshkin et al. (2006a). The theoretical emission spectra for Rb(B)Hen=1,2 and for Rb(A)Hen=6,7 are shown in Fig. 3.

III Experimental results
III.1 Experimental setup
The experimental setup is similar to the one described in our previous publication Nettels et al. (2005). A helium crystal is grown at pressures around 30 bar in a pressure cell immersed in superfluid helium at 1.5 Kelvin. The matrix is doped with rubidium atoms by laser ablation using a frequency-doubled Nd:YAG laser. The cell has five windows for admitting the ablation beam and the beam of the spectroscopy laser (a tunable cw Ti:Al2O3 laser) and for collecting fluorescence from the sample volume. The fluorescence is dispersed by a grating spectrometer and recorded, depending on the spectral range under investigation, either by a CCD camera (950013500 cm-1) or by an InGaAs photodiode (55009500 cm-1). We shall refer to these as CCD-spectrometer and InGaAs-spectrometer respectively. With the InGaAs-spectrometer spectra were recorded by a stepwise tuning of the grating, while integral spectra could be recorded with the CCD-spectrometer.
III.2 Atomic Bubbles
Defect atoms in solid helium reside in atomic bubbles, whose size and structure can be described by the equilibrium between a repulsive alkali-helium interaction due to the Pauli principle on one hand and surface tension and pressure volume work on the other hand Kanorsky et al. (1994); Kinoshita et al. (1995); Kanorsky et al. (1995). The interaction with the helium bulk shifts the 5 (D1) and 5 (D2) transitions of Rb by approximately 35 nm to the blue with respect to their values (794 nm and 780 nm respectively) in the free atom. This shift of the excitation lines as well as a smaller blue shift of the corresponding emission lines is well described by the bubble model Kanorsky et al. (1995); Bauer et al. (1990). We have calculated the equilibrium radius of the atomic bubble formed by the ground state of the Rb atom to be Å (Fig. 2) following the model described in Kanorsky et al. (1994); Kinoshita et al. (1995). For the interaction potential between groundstate Rb and He atoms we have used the same semi-empirical potentials Pascale (1983) as for the exciplex model.
It is the close vicinity of the helium atoms in the first solvation shell, together with their large zero point oscillation amplitudes, which form the basis of the efficient exciplex formation in solid helium.
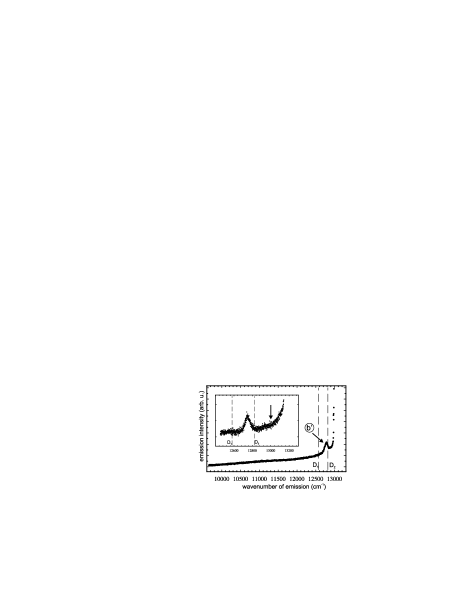
III.3 Emission spectra following D1 excitation
Fig. 4 shows the emission spectrum recorded with the CCD-spectrometer following excitation at the D1 wavelength 13140 cm-1 (758 nm). The peak at 12780 cm-1 represents fluorescence from the atomic 5 state. While D1 atomic fluorescence from Cs in solid helium has been studied and used extensively in the past it was believed that rubidium would not fluoresce on the D1 transition when embedded in solid helium. This belief was based on the reported quenching of that fluorescence at high pressures in superfluid helium Kinoshita et al. (1996a). It should be noted that the observed Rb-D1 fluorescence is orders of magnitude weaker than the corresponding line in Cs and could only be detected with long integration times (4 seconds) of the CCD camera, which probably explains why this spectrum was not observed in previous experiments Eichler et al. (2002).
The apple-shaped exciplexes with one or two bound helium atoms are expected to fluoresce within the spectral range of Fig. 4 and the absence of any prominent spectral feature indicates that these complexes are not formed upon D1 excitation. The sloped background visible in Figs. 4 and 6 is a strong wing of scattered laser light. The inset in Fig. 4 shows a spectrum which was recorded using a grating with a higher resolution. The excitation laser was shifted by 65 cm-1 (still in the D1 absorption band (Fig. 7) to the blue with respect to the spectrum of Fig. 4 to make clear that no D2 emission can be observed after D1 excitation. The arrow in the inset indicates the position of the D2 emission measured after D2 exciation (peak a in Fig. 6).
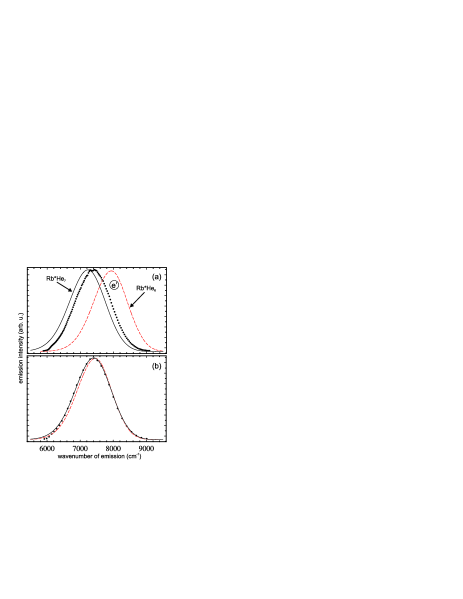
When exploring the longer wavelength range with the InGaAs-spectrometer we found a very strong fluorescence band (Fig. 5) centered at 7420 cm-1, which we assign to Rb∗Hen>2 exciplexes in the A state. This is the first recording of such exciplexes after D1 excitation and the proof that the quenching of atomic D1 fluorescence is due to exciplex formation. The dashed and the solid lines in Fig. 5 are theoretical emission spectra from Rb∗He6 and Rb∗He7 respectively. Figure 5(b) shows the theoretical curves, shifted such as to make their blue wings coincide with the experimental points. The line shape of the experimental curve is well reproduced by the two theoretical curves. The theoretical curve of the Rb∗He7 fits the experimental points better on the low energy side, while on the high energy range both curves are in very good agreement with the experimental spectrum. A small discrepancy is visible on the low energy wing, which can be due to imprecisions of the strongly sloped ground state potential (Fig. 2) or to changes of the latter due to the helium bulk. It is a remarkable fact that the fluorescence yield of this exciplex after D1 excitation in solid helium is larger than after D2 excitation, while it was not observed at all in superfluid helium. We will come back to this point in Sect. III.
A similar emission at around 7200 cm-1 has been seen in liquid helium by the Kyoto group Hirano et al. (2003) after D2 excitation and was assigned to the emission by the Rb∗He6 exciplex.
III.4 Emission spectra following D2 excitation
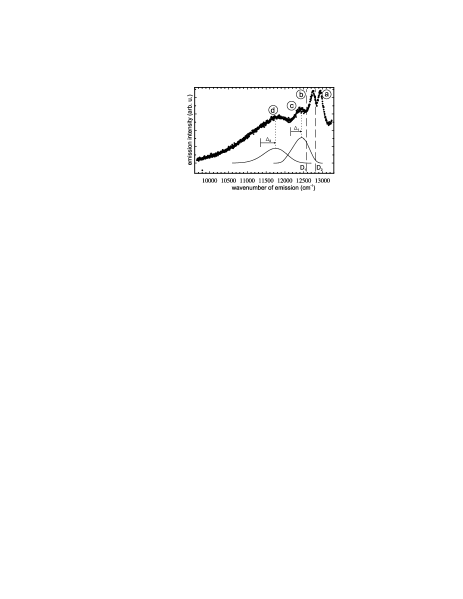
Fig. 6 shows the emission spectrum, measured with the CCD-spectrometer, when the laser is tuned to the atomic D2 transition at 13420 cm-1 (745 nm).
Four prominent spectral features can be seen in the emission spectrum. The two rightmost peaks (labelled a and b) represent atomic D2 and D1 fluorescence respectively. Together with the peak of Fig. 4 they constitute the first observation of atomic fluorescence from rubidium in solid helium. The presence of D1 emission after D2 excitation is evidence for the existence of a fine structure relaxation channel. We assign the two broader features c and d peaked at 12400 cm-1 and 11800 cm-1 respectively to the emission from Rb(B)He1 and Rb(B)He2 exciplexes. The solid lines in Fig. 6 are the calculated and emission spectra of Fig. 3 shifted to the blue by and respectively, so that their line centers coincide with the positions of the measured curves. The shifts are probably due to the interaction with the surrounding helium bubble. Note that the two theoretical curves have to be shifted by different amounts in order to match the experimental lines. We have found previously in the Cs-He system Moroshkin et al. (2006a) that the rate and sign of the pressure shift of exciplex emission lines depend on the number of bound helium atoms.
As with the spectra of Sect. III.3 we have recorded the emission in the region of longer wavelengths with the InGaAs-spectrometer. As a result we find a spectrum, which is identical (same central wavelength and same width) with the one observed with D1 excitation (Fig. 5). This suggests that the emission stems from the same state (A) as the emission after D1 excitation. The population of that state following D2 excitation is another proof of the existence of a fine structure relaxation mechanism. No other exciplex emission was observed in the spectral range between the Rb∗Hen>2 and the Rb∗He2 exciplexe emission (peak e’ in Fig. 5(a) and peak d in Fig. 6 respectively).
III.5 Atomic excitation spectra
The experimental emission spectra presented above were recorded with two fixed excitation wavelengths, chosen such as to maximize the signals of interest. It is of course interesting to investigate how the different spectral features depend on the excitation wavelength. For this we have varied the wavelength of the Ti:Al2O3 laser in discrete steps over the spectral range of 1300013700 cm-1 (770730 nm). For every excitation wavelength we have measured the amplitudes of the emission peaks of Figs. 4, 5 and 6.
The top part of Fig. 7 shows the excitation spectrum of D2 fluorescence, which is centered at 13460 cm-1 (743 nm). One sees clearly that this fluorescence can only be produced by D2 excitation. The lower part of Fig. 7 shows the excitation spectrum of D1 fluorescence. It consists of two absorption bands centered at 13180 cm-1 and 13460 cm-1 respectively, which corresponds to excited states correlating with the atomic 5 and 5 levels respectively. D1 fluorescence can thus be produced directly via D1 excitation or via D2 excitation combined with a -mixing interaction due to the alkali-helium interaction.
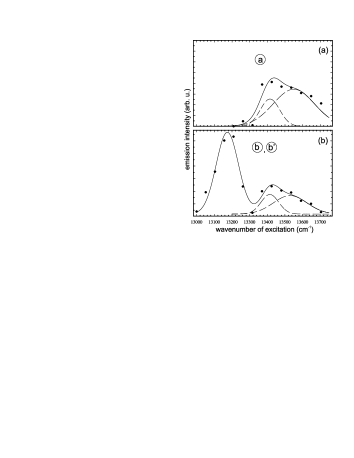
The D1 absorption band is slightly asymmetric with a longer wing on the low energy side. This feature has been observed before in Cs Kanorsky et al. (1995). The D2 absorption band measured for both D1 and D2 fluorescence, has a double peaked-structure. The scarce number of data points is well fitted by a superposition of two Gaussians separated by about 125 cm-1. This splitting of the D2 excitation lines of cesium and rubidium in superfluid helium has been explained before in terms of a dynamic Jahn-Teller effect due to quadrupolar bubble-shape oscillations which lift the degeneracy of the state Kinoshita et al. (1996b).
III.6 Exciplex excitation spectra
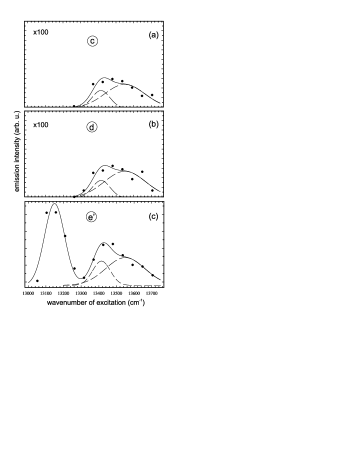
Fig. 8 shows the excitation spectra of the exciplex lines c, d, and e’ of Figs. 5 and 6. As the Rb∗He1,2 exciplexes can only be observed after D2 excitation (Fig. 8 c, d) we conclude that these apple-shaped complexes are formed in the B state. The D1, D2 and Rb(B)He1,2 emission lines are very weak and of similar amplitude. The bottom spectrum (e’) represents by far the strongest signal that comes from the Rb(A)Hen>2 exciplex which can be excited by either D1 or D2 radiation. Its emission line is about 100 times stronger than the other lines. This result is in strong contrast with the emission of the corresponding cesium exciplex, Cs(A)Hen>2, in solid helium, for which the emission after D1 excitation is very weak Moroshkin et al. (2006a). The double-peaked structure of the D2 excitation spectrum is not well resolved for the Rb∗He1,2 exciplexes. It was observed before for Cs∗He and Rb∗He exciplexes on superfluid helium nanodroplets Bünermann et al. (2004); Brühl et al. (2001).
IV Discussion
IV.1 Atomic lines
The assignment of the atomic D1 and D2 excitation and emission lines is unambiguous. The excitation lines are blue-shifted by approximately 600 cm-1, while the emission lines are shifted by only 65 cm-1 with respect to the free atomic transitions. These shifts have been studied in superfluid helium Kinoshita et al. (1995) and are well described by the bubble model. The blue shift results from the interaction with the bulk helium, which is less pronounced in the emission process as the latter occurs in a bubble of larger size Kanorsky et al. (1995). As already mentioned, excitation at the D1 transition leads to emission on the D1 line only, while excitation at the D2 line leads to emission on both the D1 and the D2 lines.
IV.2 Apple-shaped Rb(B)He1,2 exciplexes
One or two helium atoms approaching the apple-shaped atomic 5P3/2, m3/2 state do not experience a potential barrier on their way to the potential well of the B state. The formation process of Rb∗He1 and Rb∗He2 exciplexes is therefore straightforward after D2 excitation. Note that the potential diagram for Rb∗He1 is similar to the one for Rb∗He2, shown in Fig. 2, and that it has a reduced potential well depth. The Rb∗He1,2 exciplex emission line following D1 excitation is not observed because only the largest exciplex is formed as discussed in paragraph IV.4.
Cs∗He2 is the only apple-shaped exciplex that was observed in related experiments with cesium in superfluid Hirano et al. (2002) and in solid Moroshkin et al. (2006a); Nettels et al. (2005) helium, while in cold helium gas both Cs∗He1 and Cs∗He2 structures were detected Hirano et al. (2002). It remains an open question why the Cs∗He1 exiplex does not fluoresce in condensed helium, while the corresponding rubidium exciplex does.
IV.3 Dumbbell-shaped Rb(A)Hen>2 exciplexes
The emission line shown in Fig. 5 has the longest wavelength of all observed spectral lines and originates thus from the lowest-lying bound state, i.e., the A state of Fig. 2(b). Note that all Rb∗Hen>2 exciplexes have similar potential curves with potential wells/barriers increasing with . All of these structures have the shape of dumbbells, with the helium atoms bound around their waists Moroshkin et al. (2006a). Fig. 5 also shows the calculated line shapes of the emission from Rb∗He6 and Rb∗He7. Disregarding shifts of the line centers the theoretical line shapes match the experimental spectrum quite well. The good matching of the line width in particular indicates that this emission is from a single exciplex species with a specific number of bound helium atoms and that it does not come from a superposition of different exciplexes. The shift of the lines is most likely due to the interaction with the helium bulk, which was not taken into account in our calculation. It is difficult to estimate whether the bulk shifts the line to the blue or to the red. One can therefore not assign the observed emission band to Rb∗He6 or Rb∗He7 in an unambiguous way. The calculated binding energies (Rb) (Fig. 1) show that the complex with 6 helium atoms has the lowest binding energy and is therefore the most stable exciplex. Observations in liquid He Hirano et al. (2003) confirm this prediction. However, the exact calculation of the energy of the lowest lying bound state involves a precise quantitative treatment of its oscillatory degrees of freedom. In Moroshkin et al. (2006a) we have described in detail how we calculate these oscillation energies. There is an uncertainty in the calculated binding energies due to the simplified assumptions we made. An additional uncertainty comes from the semi-empirical pair potentials Pascale (1983). For big exciplexes like the Rb∗He6 every uncertainty in the potential will be amplified because of the additive contribution of the helium atoms discussed in Sect. II. This can change the position and the depth of the well in the excited state. To all of this adds the effect of the helium bulk, which was not treated so far. The following arguments support the Rb∗He6 to be the structure observed. It has the minimal binding energy and the corresponding Cs exciplex line is shifted to lower wavenumbers with increasing pressure Moroshkin et al. (2006a). Assuming the same tendency for the Rb exciplex brings the spectral position of Rb∗He6 into better agreement with the experimental curve (Fig. 5). On the other hand the line shape of the calculated Rb∗He7 fits better to the data. Therefore we can not conclude which exciplex is the one observed in the experiment.
IV.4 Formation of dumbbell-shaped Rb(A)Hen>2 exciplexes
The radius of the bubble formed by the rubidium ground state has an equilibrium radius Rb of Å, which is smaller than the corresponding radius for cesium. The excitation process is a Franck-Condon transition to the state during which the radius does not change.
The D1 excitation starting at (5S) Å ends at the left of the potential barrier of the A state so that the exciplex is easily formed by helium atoms dropping into the well. Note that for cesium in solid helium the corresponding transition ends on the right side of the potential barrier in the excited state Moroshkin et al. (2006a). In that case the helium atoms have to tunnel through the potential barrier in order to form the exciplex. This explains why exciplex emission of Cs in solid helium after D1 excitation is much weaker than after D2 excitation, while for Rb the opposite holds. It also explains why no emission from Rb exciplexes after D1 excitation could be observed in gaseous (below 10 Kelvin) and in liquid helium environments Hirano et al. (2003) in which the helium atoms are, on average, further away from the Rb atom and where the excitation thus ends at the right of the potential barrier. Under those conditions the exciplex formation is strongly suppressed as the helium atoms have to tunnel one after another through the potential barrier to form the exciplex. This tunneling occurs at a rate which is smaller than the exciplex lifetime. The same is true for Rb on He droplets, where no exciplex was observed after D1 excitation Reho et al. (2000b). The authors of Reho et al. (2000b) estimated the tunneling time to be about 500 ns, much longer than the lifetime.
When exciting the system at (5S) Å on the D2 transition the corresponding fine-structure relaxation channel allows the system to form the terminal exciplex in the potential well of the A state.
In solid helium only the largest exciplex Rb∗He is observed after D1 excitation. This means that the potential well is filled up to the maximal value of helium atoms that it can hold on a time scale which is shorter than the radiative lifetimes of the intermediate products. It is therefore likely to assume, as we have previously done for the formation of the corresponding cesium exciplexes that the exciplex results from a collective motion of the helium atoms.
IV.5 Summary and conclusion
We have presented several new spectral features observed in the laser-induced fluorescence from a helium crystal doped by laser ablation from a solid rubidium target. We detected for the first time weak, but unambiguously identified D1 and D2 fluorescence lines from atomic rubidium, which were previously believed to be completely quenched in solid helium. We have shown that Rb∗Hen exciplex formation is possible after D1 excitation, in contrast to cesium doped He, in which exciplex formation proceeds only via absorption on the D2 transition. We have explained this in terms of the smaller bubble diameter of rubidium, which allows the excitation to proceed directly to a binding state without tunnelling processes as they are needed with cesium. We have further reported the observation of Rb∗He1,2 exciplex emission after D2 excitation, a process which could not be observed in liquid helium, as well as the observation of a larger exciplex. The main decay channel of laser excited Rb in solid helium is via the formation of this largest exciplex, assigned to be either Rb∗He6 or Rb∗He7 with subsequent emission of strongly red shifted fluorescence.
It remains an open question why one observes the two exciplexes Rb∗He1 and Rb∗He2, while in equivalent experiment with cesium there is only fluorescence form the Cs∗He2 complex. This feature could be related to a recently discovered absorption band of the Rb2 dimer which overlaps with the D2 atomic absorption line Moroshkin et al. (2006b). It may also be related to unexplained details of the different steps in the formation process. Femtosecond pump-probe experiments would clearly be the tool of choice for further investigations of this question.
Acknowledgements.
We thank J. Pascale for sending us his numerical Rb-He pair potentials. This work was supported by the grant number 200020-103864 of the Schweizerischer Nationalfonds.References
- Hirano et al. (2002) K. E. K. Hirano, M. Kumakura, Y. Takahashi, and T. Yabuzaki, Phys. Rev. A 66, 012722 (2002).
- Hirano et al. (2003) K. Hirano, K. Enomoto, M. Kumakura, Y. Takahashi, and T. Yabuzaki, Phys. Rev. A 68, 012722 (2003).
- Nettels et al. (2005) D. Nettels, A. Hofer, P. Moroshkin, R. Müller-Siebert, S.Ulzega, and A. Weis, Phys. Rev. Lett. 94, 063001 (2005).
- Dupont-Roc (1995) J. Dupont-Roc, Z. Phys. B 98, 383 (1995).
- Kanorsky et al. (1995) S. Kanorsky, A. Weis, M. Arndt, R. Dziewior, and T. Hänsch, Z. Phys. B 98, 371 (1995).
- Bünermann et al. (2004) O. Bünermann, M. Mudrich, M. Weidemüller, and F. Stienkemeier, J. Chem. Phys. 121, 8880 (2004).
- Schulz et al. (2001) C. P. Schulz, P. Claas, and F. Stienkemeier, Phys. Rev. Lett. 87, 153401 (2001).
- Brühl et al. (2001) F. R. Brühl, R. A. Trasca, and W. E. Ernst, J. Chem. Phys. 115, 10220 (2001).
- Reho et al. (2000a) J. Reho, J. Higgins, C. Callegari, K. K. Lehmann, and G. Scoles, J. Chem. Phys. 113, 9686 (2000a).
- Reho et al. (2000b) J. Reho, J. Higgins, K. K. Lehmann, and G. Scoles, J. Chem. Phys. 113, 9694 (2000b).
- Enomoto et al. (2004) K. Enomoto, K. Hirano, M.Kumakura, Y. Takahashi, and T. Yabuzaki, Phys. Rev. A 69, 012501 (2004).
- Moroshkin et al. (2006a) P. Moroshkin, A. Hofer, D. Nettels, S. Ulzega, and A. Weis, J. Chem. Phys. 124, 024511 (2006a).
- Kinoshita et al. (1996a) T. Kinoshita, K. Fukuda, T. Matsuura, and T. Yabuzaki, Phys. Rev. A 53, 4054 (1996a).
- Eichler et al. (2002) T. Eichler, R. Müller-Siebert, D. Nettels, S. Kanorsky, and A. Weis, Phys. Rev. Lett. 88, 123002 (2002).
- Pascale (1983) J. Pascale, Phys. Rev. A 28, 632 (1983).
- Aziz and Janzen (1995) R. A. Aziz and A. R. Janzen, Phys. Rev. Lett. 74, 1586 (1995).
- Kanorsky et al. (1994) S. I. Kanorsky, M. Arndt, R. Dziewior, A. Weis, and T. W. Hänsch, Phys. Rev. B 50, 6296 (1994).
- Kinoshita et al. (1995) T. Kinoshita, K. Fukuda, Y. Takahashi, and T. Yabuzaki, Phys. Rev. A 52, 2707 (1995).
- Bauer et al. (1990) H. Bauer, M. Beau, B. Friedl, C. Marchand, K. Miltner, and H. J. Reyher, Physics Letters A 146, 134 (1990).
- Kinoshita et al. (1996b) T. Kinoshita, K. Fukuda, and T. Yabuzaki, Phys. Rev. B 54, 6600 (1996b).
- Moroshkin et al. (2006b) P. Moroshkin, A. Hofer, S. Ulzega, and A. Weis, to be published (2006b).