A PMT-Block Test Bench
Abstract
The front-end electronics of the ATLAS hadronic calorimeter (Tile Cal) is housed in a unit, called PMT-Block. The PMT-Block is a compact instrument comprising a light mixer, a PMT together with its divider and a 3-in-1 card, which provides shaping, amplification and integration for the signals. This instrument needs to be qualified before being assembled on the detector. A PMT-Block test bench has been developed for this purpose. This test bench is a system which allows fast, albeit accurate enough, measurements of the main properties of a complete PMT-Block. The system, both hardware and software, and the protocol used for the PMT-Blocks characterisation are described in detail in this report. The results obtained in the test of about 10000 PMT-Blocks needed for the instrumentation of the ATLAS (LHC-CERN) hadronic Tile Calorimeter are also reported.
keywords:
Photomultiplier , F/E Electronics , CalorimeterPACS:
29.40.-n , 29.40.Vj , 29.50.+v, , , , , , , , , , , , , , , , , , , , , , , , , , , , , , , , ,
1 Introduction
A PMT-Block [1] [2] is the device used by the ATLAS Tile Calorimeter to convert light into electric signals. It is composed of a photomultiplier tube111Hamamatsu 7877, a light mixer, a high voltage divider and a 3-in-1 card [3]. The light mixer provides the interface between the PMT and the fiber bundle which collects some of the light produced in the scintillator of the sampling calorimeter. The 3-in-1 card forms the front-end of the electronic read-out chain. It provides three basic functions: fast pulse shaping and amplification to accommodate the large dynamic range needed by the detector, charge injection calibration and slow integration of the PMT signals for monitoring and calibrations. This paper will not enter into a detailed description of each element. A documentation of their characteristics has been already published for most of them.
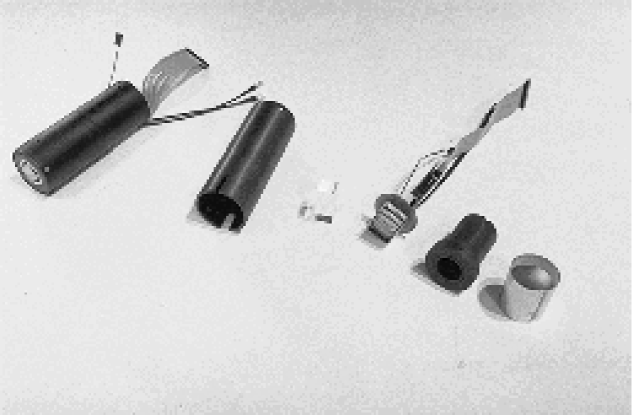
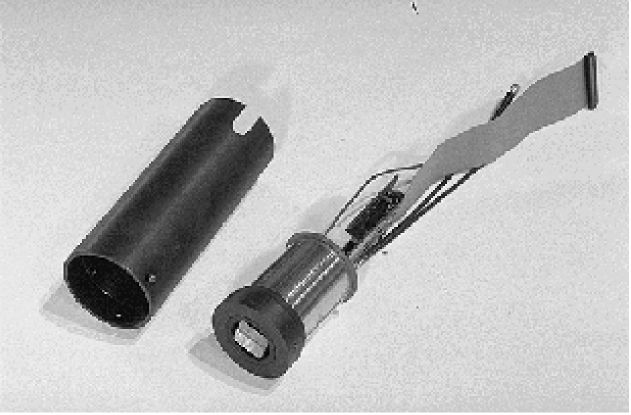
A PMT is assembled inside a soft iron and a mu-metal cylinder, which provides adequate magnetic shielding. The individual components and the fully assembled PMT-Block are shown in figure 1.
The PMT-Blocks are housed inside drawers. A drawer provides the mechanical support both for the PMT-Block and the electronic boards (also called mother boards). A drawer contains up to 24 PMT-Blocks. The mother boards are connected to each PMT-Block, supplying the PMT dividers with the high voltage, the 3-in-1 cards with the low voltages and conveying control and calibration signals to the 3-in-1 cards. The mother board also houses the electronics to process the signals coming from the shaper and the integrator.
All the components assembled in a PMT-Block underwent an individual Quality Control process. However, it is necessary to check the PMT-Block as a whole before inserting it in a drawer. This test bench is intended to check each specific functionality of a PMT-Block while no attempt is made to characterise the individual components, as specific test benches are dedicated to this task. The result of the test here described is either a certification of full functionality, or the identification of the parts of the PMT-Block which are not working properly, together with a brief description of the problem.
The PMT-Block test bench has been developed to be:
- –
-
Affordable. Commercial electronics can be very expensive and should be avoided whenever it is possible. On the other side spare electronics is available in the laboratories and can be employed for the tests.
- –
-
Easy to use. The system should be operated also by a non-expert crew, hence it must be very intuitive and easy to use.
- –
-
Stable. A few years of work were needed to characterize all the PMT-Blocks. During this time, the system had to operate in a stable way, with no major breakdowns. Moreover, the test bench will be kept working during all of the experiment’s lifetime for test purposes. This implies that the test bench must operate in stable conditions for about 15 years.
- –
-
Portable. Since the test bench has to operate for many years, we expect that the platform used for the DAQ system will change. It is desirable that the high level functionality of the test bench will not change, leaving the low level to cope with a changing platform. It has been decided to write the DAQ in ANSI C code to minimise the efforts to move the system to another platform and to reduce the costs that another institution would bear if a commercial DAQ system was used.
- –
-
Versatile. The DAQ system has to be easily modifiable and versatile enough to accomplish any change in the protocol and also in the hardware itself. This characteristic turned out to be very useful, since the same DAQ has been used also in other test benches for PMT characterization.
Keeping this in mind, the design of the test bench was split into three parts:
- –
-
The hardware used in this test bench
- –
-
The protocol used for the characterization of the PMT-Block test
- –
-
The DAQ software which is rather independent of this specific test bench
In this paper each one item of the above items is described in detail and the tests performed are reported.
2 The experimental set-up
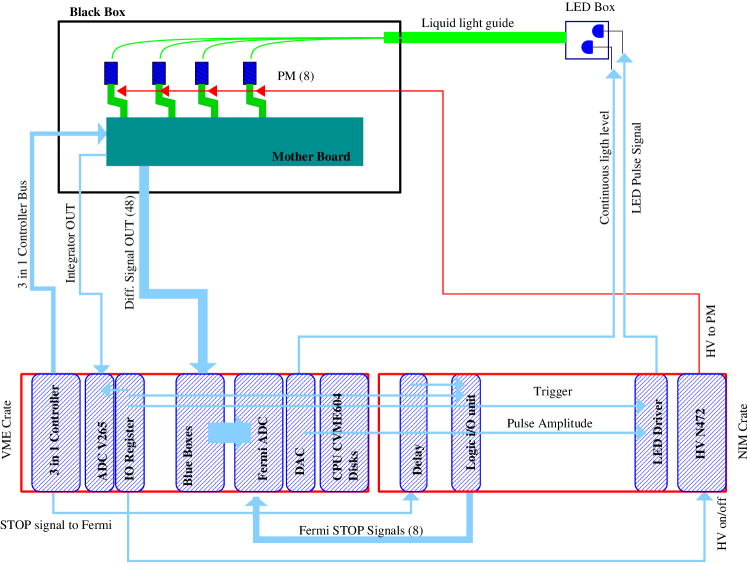
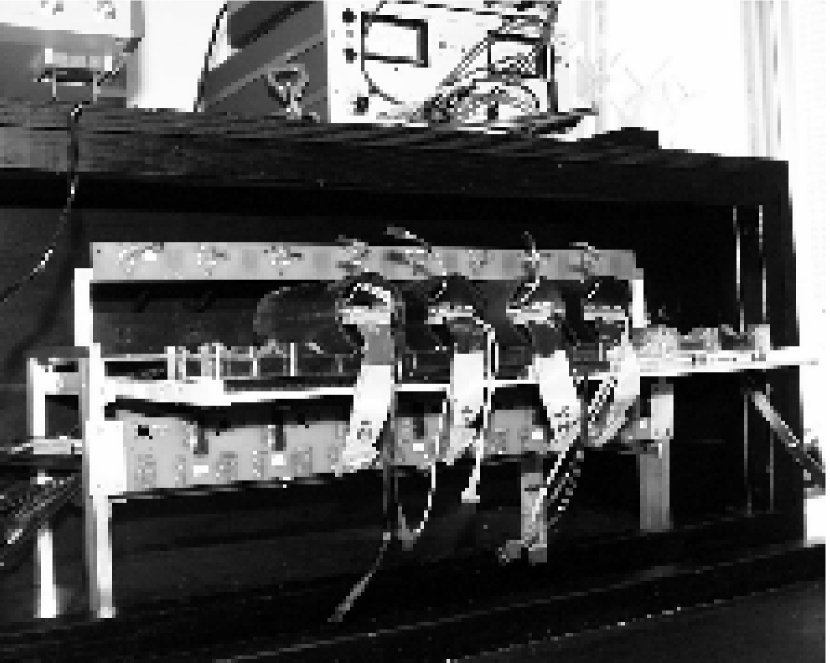
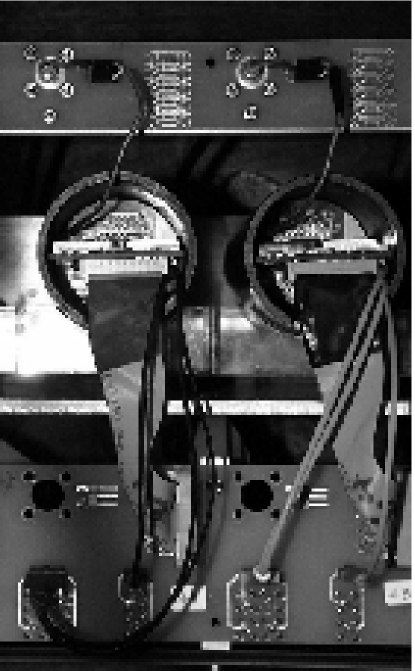
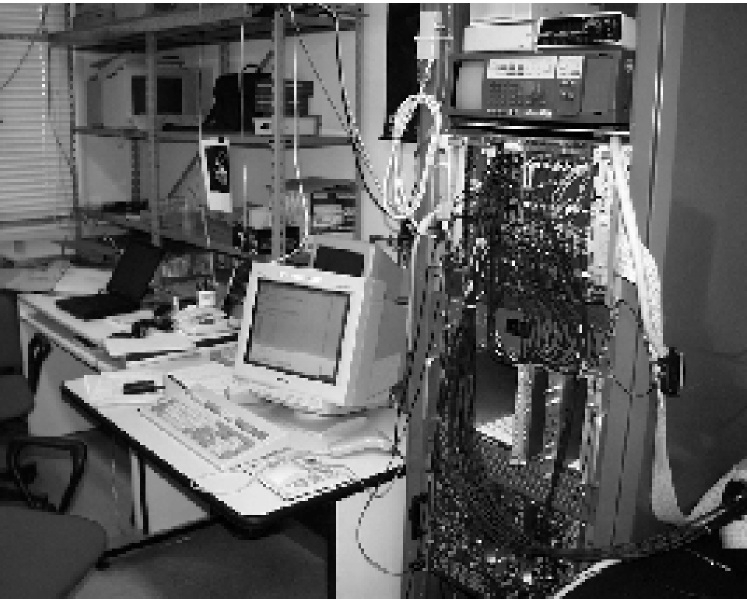
A schematic diagram of the test bench is shown in Figure 2. Up to eight PMT-Blocks can be housed in special cradles inside a light-tight box (Figures 3 and 4). The Blocks are connected to the High Voltage distribution, to the signal and to the control cables, which are routed through the motherboard as they are in the detector. In absence of a drawer the connection between the PMT-Blocks and the motherboard is provided by special home-made boards (Figure 4).
The controls and readout proceed through the motherboard with a protocol which is the same as the one used in the detector.
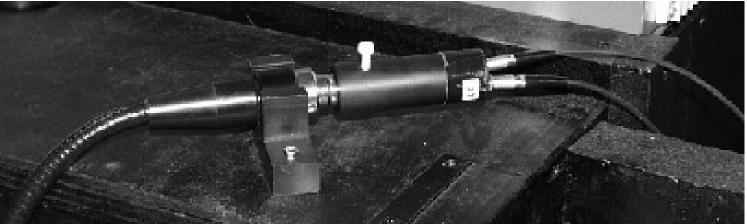
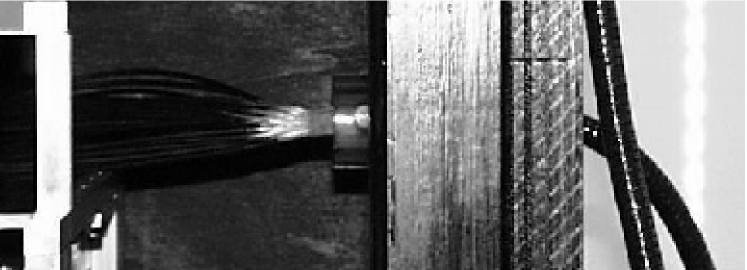
The PMTs are illuminated by two LEDs222Ledtronix PB280CWB1K, one operating in continuous and the second in pulsed mode. The LEDs are housed in a black plastic cylinder and face a liquid fiber which is connected, inside the black box, to a fiber bundle, in order to distribute the light to each PMT (Figure 5). The light source is very simple and was designed and built in our labs. The amount of light each PMT receives has been roughly equalised among the eight PMTs using neutral optical filters.
The DAQ of the test bench comprises the control and readout electronics located in one NIM and one VME crate. A single board PC (FIC 8232333CES, FIC8232 Fast Intelligent Controller) located in the VME crate has been programmed to control the sequence of operations. Control and pulse signals are produced by an I/O register444CAEN V262. The I/O bits of the register control the status of the HV power supply555CAEN N472. The signal to pulse the LED and to STOP the ADCs is generated acting on the I/O bits as well.
A VME Fermi ADC666CAEN V571 measures the light in the pulsed mode (i.e. the signal OUT from the 3-in-1 card of each PMT). A second ADC777CAEN V265 is used to measure the PMT current when operating in continuous light mode (integrator OUT from the 3-in-1 card). Though the two ADC models are not optimal for this task, they were available and could be easily included in the test bench. They accomplished their assigned task in a satisfactory way.
A receiver card (blue box in Figure 2) converts the fast differential signals from the 3-in-1 cards to single ended ones, and interfaces the 3-in-1 to the Fermi ADC.
A second detector-specific unit (3-in-1 controller in Figure 2) is used to set the mode of operation of the 3-in-1 cards and also to provide the charge injection for the tests of the 3-in-1 electronics.
As far as the LED drivers for pulse and continuous light are concerned, we have preferred two home-made circuits to commercial units. A VME DAC unit sets the continuous light of the LED to the desired intensity. A NIM circuit generates fast (20-30 ns) pulses, whose amplitude can be modulated by a DAC (0,+60 Volts) and is triggered by one bit of the I/O register.
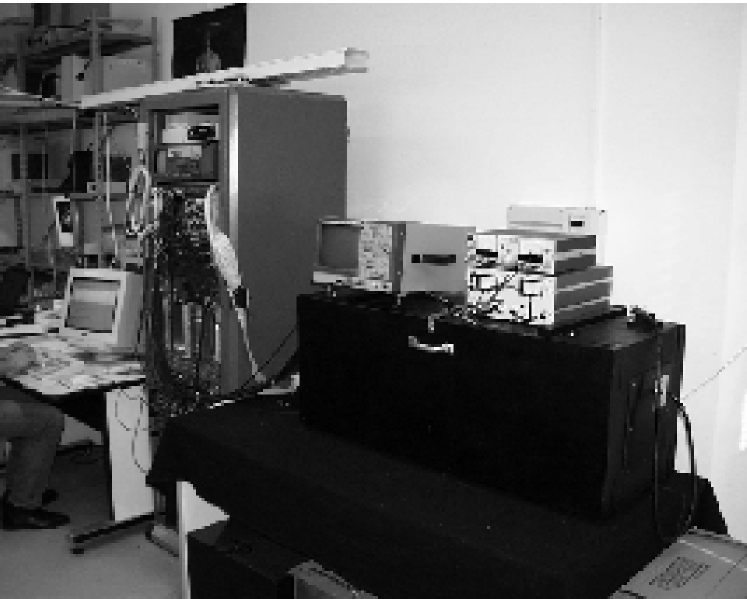
The DAQ system was required to be simple and inexpensive, hence it had to be designed with a few detector specific, home-made units. The whole system is shown in Figure 6.
3 Protocol
The sequence of operations needed for testing the PMT-Blocks is described in this section. As already mentioned, the PMT-Block is an assembly of three main parts: a light mixer, a PMT with its divider and the F/E electronics (the 3-in-1 card).
The 3-in-1 cards form the front end of the electronics chain. They provide 3 basic functions: a fast pulse shaping of the PMT output with two gains to provide the dynamic range, a slow integrator circuit for measuring DC current for detector monitoring [1], and a charge injection system for electronics calibration. These three functions are controlled by an on-board logic driven by a remote controller.
The test starts checking the functionality of the 3-in-1 card, independently of the PMT, by injecting a precise quantity of charge into the 3-in-1 input and recording the amplified and shaped output pulses. Then, short light pulses are sent to the PMT to check its performances. Finally, continuous light of different intensities is used to test the Integrator in different operating conditions.
3.1 The Test of the Charge Injection System
During the Charge Injection System test the high voltage and light system are OFF and the 3-in-1 card is set in the charge injection configuration. Different charges are then injected, covering the dynamic range of the device, both in the low and the high gain. Output signal from the low gain, high gain and trigger channels are recorded. At the end of this test, a linear fit of the measured output signal as function of the injected charge, is performed. The low and high gain of each channel are the slope of the fit line and are stored on disk for further analysis.
3.2 The test with light pulse
During this part of the test the high voltage is ON and the light system operates in pulsed mode. The aim is to simulate the working conditions of the PMT in the experiment by flashing the PMT with light of different intensities. In tests performed previously, all the PMTs have been characterized and their nominal voltage has been defined (nominal HV is that for which the gain of a given PMT is ). However, for this test a common value of the HV (800 V) was preferred for simplicity. Three different light levels were used to simulate: a) the signals produced in the calorimeter by a minimum ionizing particle, b) a signal falling in the energy region where the two gains overlap, and c) a jet with energy of about one TeV. For each PMT-Block, 5000 events are then recorded at each light setting. The pulse shape is recorded by the V571 flash ADC. The program performs the pulse measurement and the pedestal subtraction on-line. Two histograms for each PMT are filled: the first one for the low gain, the second one for the high gain. The average value of each histogram and its r.m.s. are stored to disk.
3.3 The Test of the slow integrator
During the Slow Integrator test the high voltage is ON, the light system is operated in DC mode and the 3-in-1 card is set to integrator mode. This operation will be used to monitor the calorimeter gain using minimum bias events when LHC is running and the light produced by a 137Cs source that, in special runs, will move through all of the calorimeter cells [6]. Three different levels of DC light are used to simulate the pile-up events, the Cs source and a level of light in between. The average output current for each level (pedestal subtracted) is measured and stored on disk.
3.4 Data analysis and decision
The data analysis is performed on-line, right after the data taking and, at the end of the test, the relevant information to the PMT-Block is available in an ASCII file. Since the aim of this test is to check the functionality of the PMT-Blocks without performing their full characterization, the measured values are checked to be within an acceptance range. If this is the case, the PMT-Block is accepted; otherwise it is rejected and sent back for repair. A screen message indicates to the operator which PMT-Blocks are to be rejected. The acceptance ranges used are summarized in Table 1.
| Acceptance window | |||
| CIS (gain ratio) | |||
| Fast Pulse: | |||
| DC Light | Min Bias | Medium | 137Cs source |
| Integrator | |||
At the end of each measurement the ASCII file is imported in Microsoft EXCEL™ which performs the statistics and the database functions.
3.5 Sequence of operations
The sequence of operations required to perform the tests of a PMT-Block batch described above, is the following:
-
1.
an ensemble of eight PMT-Blocks are mounted into the black box (manual);
-
2.
the cables of the PMT-Blocks are connected to the patch panel (manual);
-
3.
the identification information of the PMT-Block are collected and the database initialised (manual);
-
4.
the CIS test is then performed and the results are stored to disk (automatic);
-
5.
the fast pulse test is performed and the results stored to disk (automatic);
-
6.
the slow integrator test is performed and the results stored to disk (automatic);
-
7.
the results are analysed and the decision is made to accept or reject the PMT-Block (automatic);
-
8.
finally the PMT-Blocks are removed from the test bench. The PMT-Blocks to be rejected are put aside (manual).
A complete test of a batch of 8 PMT-Blocks takes about 25 minutes from the PMT insertion to their removal.
4 Software
The guidelines followed in the development of this test bench have been stated in the introduction. The software has to fulfill all these requirements, i.e. it has to be affordable, easy to use, stable, portable and versatile.
The software was developed by following a layered approach. The operations to be performed on the VME data bus are two: write to and read from the bus. Every board is interfaced by a small library which supplies the basic set of routines to operate the board itself.
The layered structure of our software is the following:
- –
-
kernel – This is the part of the code that interfaces to the menu, data and file handling and deals with error management. It takes care of the VME bus initialization and read/write functions. This is the only platform dependent part of the code and must be written accordingly to the hardware used to interface the VME bus;
- –
-
libraries – Each VME board has its own library of functions that are responsible for initialization, control and data acquisition. If a new board is added, a new library has to be written. The debugging is easy as only the basic functions have to be checked, while more complex functions can be obtained by suitable scripts. At this level, the software is platform independent and can be moved from one system to another without changing the code if the system supplies an ANSI-C compliant compiler;
- –
-
scripts – This is the part dealing with the implementation of a specific test. The user takes advantage of the hardware functions without worrying how operations are performed and has only to concentrate on the measurements. This part is, of course, platform independent.
The software has been originally developed on a Cetia PowerPC board (CVME 604) with LynxOS 2.4 operating system.
Every hardware board is activated by a set of commands available from a sub-menu in the DAQ program. These routines are used for simple operations like setting the number of boards present in the crate, setting the VME address to access them and the basic read/write functions.
The DAQ system is essentially a command line driven program, with simple operations available from menus and sub-menus that perform specific actions. Multiple commands can be written on the same line and the program takes care of splitting them into single tokens. These commands can be grouped in macros that the program is able to execute. Macros can be called and nested and complicated sequences of commands are easily obtained, thus providing a very high level of flexibility. Any kind of test bench can be implemented without too much trouble, provided the right macros are written.
To handle the data coming from the VME boards, we have included in the system a histogram handling package à la HBOOK [7] and a data handling package à la SIGMA [8], to perform simple mathematical operations as well as file handling. A preliminary analysis can be performed on-line but data can be written on disk for an accurate, off-line, analysis.
During the years this software has been tested on several systems, from Motorola 68x to PowerPC and Intel based platforms. Besides the usage in the ATLAS experiment, the same software has been used in several occasions; from data acquisition in the test beam setup for the AMS electromagnetic calorimeter [9] to the trigger interface in the framework of the MAGIC telescope [10].
An example of the scripts used in the test is shown in the Appendix.
5 Results from the PMT Block test
In the following some results from the test of about 10000 PMT-Blocks are presented.
5.1 Charge Injection System Test
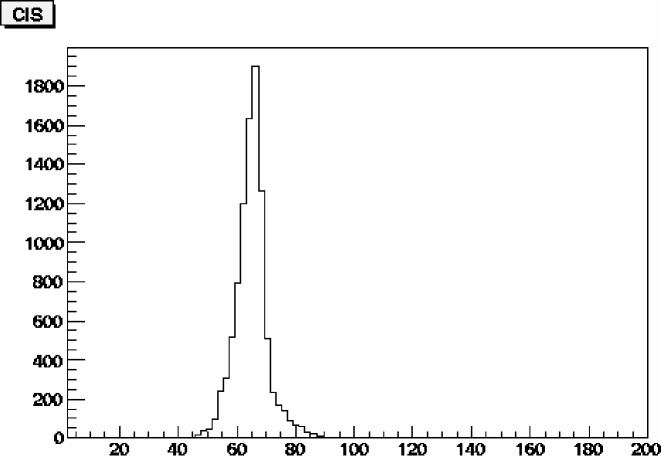
In the charge injection test, the important parameter is the ratio () of the gains measured in the high gain mode and low gain mode of the 3-in-1 card. The distribution of is shown in Figure 7. The mean value is 65.19, very close to the nominal value of 64. It should be noted that the resolution of this measurement does not reflect the quality of the hardware [3],[4], it rather represents the accuracy of this test procedure.
5.2 Light Pulse test
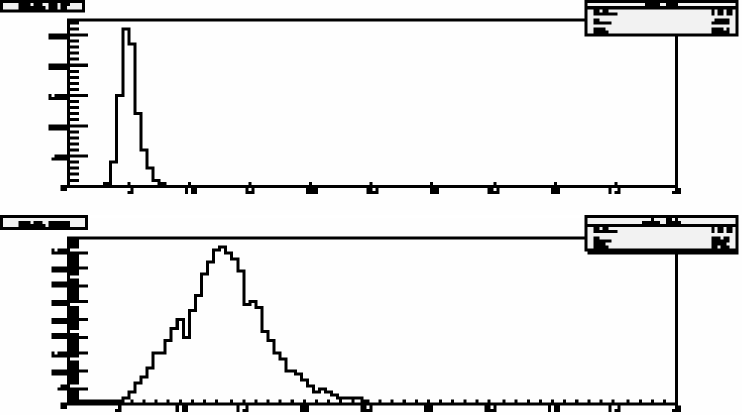
The output of the Pulse Test provides the mean value and the r.m.s. for the high and low gain mode of the 3-in-1 card. For a PMT-Block to pass this part of the test, the value of the ratio: r.m.s./mean has to be less than 25%. In Figures 8 and the distributions of this quantity for low and high gain respectively are shown. The effective resolution shown in the plots is due in part to the photo-statistics and in part to the different share of light in the different channels. It is clear that in both cases this condition is fulfilled for the vast majority of the PMT-Blocks.
5.3 Integrator test
In this third test, three different DC light levels are used. For each level, the current is measured and its mean value is recorded together with the corresponding r.m.s.. The aim of the procedure is to observe an increase of the mean value as a consequence of the increase of the light level. The mean values of the three levels are denoted as INT1, INT2 and INT3 from the lower to the higher, respectively. The distribution of the mean values of the three quantities is shown in Figure 9. The acceptance ranges of the three mean values were given in Table 1.
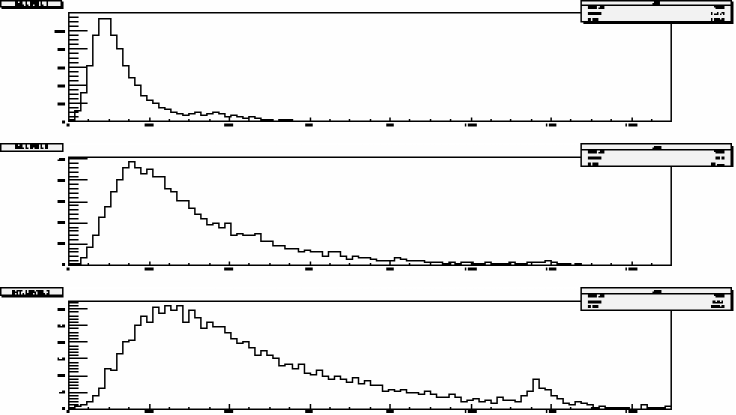
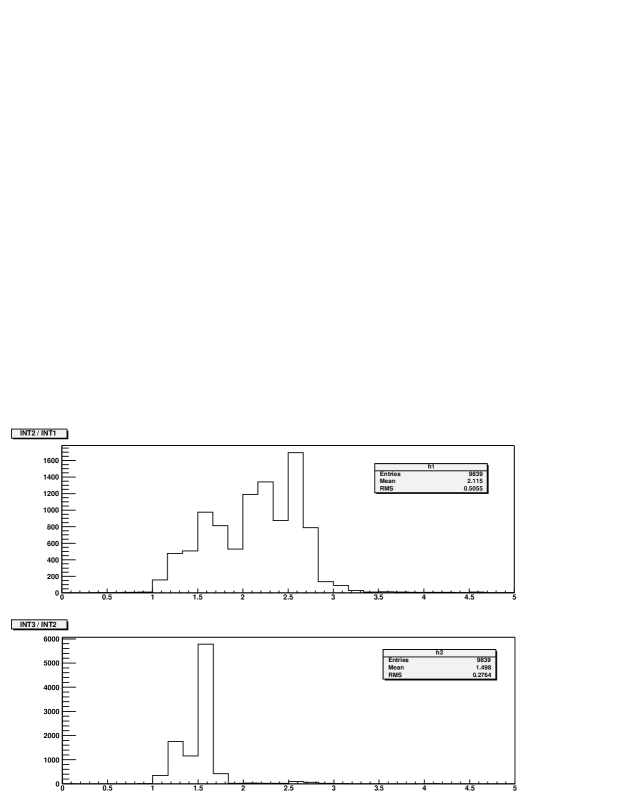
The distributions of figure 9 are quite wide because no attempt was done to equalize the gain of the PMTs. It was verified that the system is behaving correctly by plotting the ratios of the integral event by event, as is shown in Figure 10.
5.4 Fraction of rejected PMT-Blocks
The fraction of the PMT-Blocks rejected by each of the three tests in the first pass is shown in Table 2; the same table also summarizes the percentage of rejected PMT Blocks.
| Test | Fraction of rejected PMT-Blocks (%) |
|---|---|
| CIS slope | 2.1 |
| Fast Pulse test | 0.16 |
| Integrator Test | 0.16 |
| Total Fraction rejected | 2.42 |
6 Conclusions
A test bench for the PMT-Blocks employed in the ATLAS Tile Calorimeter has been developed. The aim of these tests was to ensure the functionality of the PMT-Blocks before their final insertion in the super-drawers. The test allows fast and accurate enough measurements of the main properties of a complete PMT-Block (light mixer / PMT and divider / 3-in-1 card). The ability of performing different tests, each of them checking a special operation mode of the PMT-Block, is another important characteristic of the system. This test bench has been used for the quality control of 10300 PMT-Blocks that will be used in the ATLAS experiment. The different operational modes of the Blocks were checked by three different tests, in order to ensure their full functionality. The DAQ system consists of basic routines, each one corresponding to a different electronic instrument housed in the VME crate, and it is based on a structure which permits high level calls from a non-compiled code. The fraction of the rejected PMT-Blocks in the first pass was about 2.5%.
7 Acknowledgments
We want to thank the Tile Cal group of the University of Chicago, in particular K. Anderson, for the help and advice in the operations of the 3-in-1 cards and for lending us the controller and its software. Our thanks also to Tile Cal group of Stockholm that lend us the 3-in-1 receivers. All the Tile Cal collaboration has encouraged this effort and we want to thank all those that have helped us with advice and support in understanding the details of the PMT-block system.
This work has been partly supported by the Italian Istituto Nazionale di Fisica Nucleare (INFN) and the University of Pisa, by the Greek General Secretariat for Research and Technology (GGSRT), by EEC RTN contract HPRN-CT-00292-2002, by INTAS-CERN grant N.O. 03-52-6477, by the Special Account for Research Grants of the National and Kapodistrian University of Athens and by the EPEAEKII (Operational Program for Education and Initial Vocational Training) program in the framework of the projects Pythagoras and Iraklitos.
Appendix A The DAQ software
In this section we show some examples of how the scripts used in the Data Acquisition for these tests look like.
The scripts are ordered in a hierarchy. The top level scripts organize the sequence of the different tests. The first script is the test.uic:
!!!!!!!!!!!!!!!!!!!!!!!!!!!!!!!!!!!!!!!!!!!!!!!!!!!!!!!!!
!   Macro Name: test.uicΨΨΨΨ!
!!!!!!!!!!!!!!!!!!!!!!!!!!!!!!!!!!!!!!!!!!!!!!!!!!!!!!!!!
!   CALLED BY: user input ΨΨΨΨ!
!   CALLS: Ψtest_cis.uicΨΨΨΨ!
!ΨΨtest_pulse.uicΨΨΨΨ!
!ΨΨtest_int.uicΨΨΨΨ!
!ΨΨtest_merge.uicΨΨΨΨ!
!!!!!!!!!!!!!!!!!!!!!!!!!!!!!!!!!!!!!!!!!!!!!!!!!!!!!!!!!
!ΨΨΨΨΨΨΨ!
!   This is the macro starting the PMT block testΨ!
!   ΨΨΨΨΨΨΨ!
!   Run this one with the command @test.uic in vmetestΨ!
!   to perform a complete test.ΨΨΨΨ!
!   Every newly implemented test part should be called Ψ!
!   from here.ΨΨΨΨΨΨ!
!ΨΨΨΨΨΨΨ!
!!!!!!!!!!!!!!!!!!!!!!!!!!!!!!!!!!!!!!!!!!!!!!!!!!!!!!!!!
message "************************************************\n"
message "*   The PMT Block Test Bench                   *\n"
message "*   Version 1.0          May 30th 2000         *\n"
message "************************************************\n"
!                        CIS Test
@test_cis.uic
!                        Pulsed Test
@test_pulse.uic
!                        Integrator Test
@test_int.uic
!                        Summarize results on test.dat
@test_merge.uic
message "Test is Finished\n"
message "RENAME the output file\n"
The script consists of several calls to other scripts. The first is the script test_cis.uic which is listed below:
!!!!!!!!!!!!!!!!!!!!!!!!!!!!!!!!!!!!!!!!!!!!!!!!!!!!!!!!!
!   Macro Name: test_cis.uic                            !
!!!!!!!!!!!!!!!!!!!!!!!!!!!!!!!!!!!!!!!!!!!!!!!!!!!!!!!!!
!   CALLED BY: test.uicΨ                                !
!   CALLS:  cis_fast.uic     ΨΨΨΨ!
!!!!!!!!!!!!!!!!!!!!!!!!!!!!!!!!!!!!!!!!!!!!!!!!!!!!!!!!!
!                                                       !
!   This is the macro for Charge Injection calibration  !
!ΨΨΨΨΨΨΨ!
!   The real work is done in cis_fast.uicΨΨ!
!   This macro is only the final interface. ΨΨ!Ψ
!ΨΨΨΨΨΨΨ!
!   call @test_cis.uic from vmetest to perform only Ψ!Ψ
!   CIS test (for debugging purposes)ΨΨΨ!
!ΨΨΨΨΨΨΨ!
!!!!!!!!!!!!!!!!!!!!!!!!!!!!!!!!!!!!!!!!!!!!!!!!!!!!!!!!!

message "*************************\n"
message "* CIS calibrations      *\n"
message "*************************\n"
!                     Call to cis_fast.uic
@cis_fast.uic
!                     Print the results obtained for online monitoring
message @gain_low1.datΨmessage "\n"
message @gain_low2.datΨmessage "\n"
message @gain_low3.datΨmessage "\n"
message @gain_low4.datΨmessage "\n"
message @gain_low5.datΨmessage "\n"
message @gain_low6.datΨmessage "\n"
message @gain_low7.datΨmessage "\n"
message @gain_low8.datΨmessage "\n"
message @gain_high1.datΨmessage "\n"
message @gain_high2.datΨmessage "\n"
message @gain_high3.datΨmessage "\n"
message @gain_high4.datΨmessage "\n"
message @gain_high5.datΨmessage "\n"
message @gain_high6.datΨmessage "\n"
message @gain_high7.datΨmessage "\n"
message @gain_high8.datΨmessage "\n"
which, in turns calls cis_fast.uic:
!!!!!!!!!!!!!!!!!!!!!!!!!!!!!!!!!!!!!!!!!!!!!!!!!!!!!!!!!
!   Macro Name: cis_fast.uic                            !
!!!!!!!!!!!!!!!!!!!!!!!!!!!!!!!!!!!!!!!!!!!!!!!!!!!!!!!!!
!   CALLED BY: test_cis.uic                             !
!   CALLS:Ψcis_hist_book.uic                       !
!           Ψcis_init2.uicΨΨΨΨ!
!ΨΨcis_hist_reset.uic   ΨΨΨ!Ψ
!ΨΨcis_event_low.uicΨΨΨ!
!ΨΨcis_hist_fill_low.uicΨΨΨ!
!ΨΨcis_stack.uic ΨΨΨΨ!
!ΨΨcis_init1.uicΨΨΨΨ!
!ΨΨcis_event_high.uicΨΨΨ!
!ΨΨcis_hist_fill_high.uicΨΨΨ!
!   VARIABLES: X0 --> injected charge                   !
!!!!!!!!!!!!!!!!!!!!!!!!!!!!!!!!!!!!!!!!!!!!!!!!!!!!!!!!!
!                                                       !
!   This is the macro for Charge Injection calibration  !
!   Version using the fast Fermi reading to save cpu    !
!   time. ΨΨΨΨΨΨ!
!ΨΨΨΨΨΨΨ!
!   COMMENT: The fast fermi reading returns as a result !
!   the peak value subctracted by the average read      !
!   of the first 5 fermi samplings.ΨΨΨ!Ψ
!ΨΨΨΨΨΨΨ!
!   The real cis work is done here and divided into     !
!   submacros each doing simple actions.ΨΨ!
!!!!!!!!!!!!!!!!!!!!!!!!!!!!!!!!!!!!!!!!!!!!!!!!!!!!!!!!!
!
!                                Book histos used for the cis test
@cis_hist_book.uic
!                                Inizialize 3 in 1 controller
!                                Each of the 8 tubes are initialized
!                                by a call to cis_init2.uic
!
3in1
        @cis_init2.uic
        zone 0 sector 0 tube 47 address
!                                Repeat for all tubes (not listed)
return
!                                Reset and inizialize Fermi modules.
Fermi
Ψselect 1 reset sample_write 30 delay_write 0
!                                Repeat for all Fermis (not listed)
return
!
!                                Low gain CIS calibration:
!                                Injected charged is 0, 200, 400, 600, 800
message 0\n
wait 1
sigma <   0 > X0 ret
!                                Acquire 10 CIS events.
loop 10 @cis_event_low.uic
!                                The mean is stored in another histo
!                                (1111 for pmt 1) as a function of Qinj.
!
@cis_hist_fill_low.uic
!                                Repeat for all  Change injected values
!                                (not listed)
!                                Put results into files.
sigma
Ψfopen gain_low1.dat
!                                write tube number
        fwrite "1\t"
!                                Convert the value to appropiate units
        < 1.249 > x6 pull
!                                Linear fit to the histo
Ψfit 1111 @cis_stack.uic fclose
!                                Repeat for the other tubes
!                                (same but not listed)
return
!                                High gain calibration (same but not listed).
This last script consists of several calls to ancillary scripts to manage histograms. The most relevant call is the one to FERMI. This routine performs basic I/O operation on the VME bus. This routine is coded in C and, part of it is listed below:
/*
 *  This command performs a read to the Fermi V571 samples
 *  and returns the difference between the maximum sampling value
 *  and the mean of the first 5 samplings
 *
 *  This is a replacement of the READ command to speed up the test
 *
 */

if(strcmp(verb,"FASTREAD")==0) /* User command is FASTREAD */
{
/*
 *  Get the qualifiers associated with the FASTREAD command
 *  Debug  : 1 Debug is on / 0 Debug is off
 *  Channel: number of channel to be read (1,2,3)
 */

  if((status = get_qualifier("PMT_Fermi_Menu", "FASTREAD", "CHANNEL",&nch))==0){}
  if((status = get_qualifier("PMT_Fermi_Menu", "FASTREAD", "DEBUG",  &deb))==0){}
/*
 * arr[256] is used to store the Fermi samplings information. It is first
 * set to zero and then filled up by a call to Fermi_wait_for_trigger
 */

  uzero(arr,256);
  err=Fermi_wait_for_trigger( nch, arr);
/*
 * Detect eventual errors
 */
  if(err>0)
  {
          error_logger( "Fermi_wait_for_trigger", ERWARN, "Timeout error");
          return;
  }
  else
  {
/*
 * Debug if it is requested
 */
     if(deb>0) printf("Fermi %ld Channel=%ld\n", this_fermi, nch);
/*
 * average is the average of the first 5 samplings used as a pedestal
 */
     average=(float)arr[0]+arr[1]+arr[2]+arr[3]+arr[4];
     average /= 5.;
/*
 * Look for the maximum voltage in the 256 Fermi samplings
 */
     vmax= 0.;
     for(i=0;i<sample;i++)
     {
        if(deb>0)printf("%d %d\n",i,*(arr+i));
        if((float)arr[i]>vmax)vmax=(float)*(arr+i);
     }
/*
 * Push into the BBmenu stack the relevant information, i.e. the
 * difference between the maximum and the average of the first 5 samplings
 */
     pushStack(vmax-average);
  }
}
References
- [1] ATLAS Collaboration, Tile Calorimeter Technical Design Report, CERN/ LHCC/ 96-42, ATLAS TDR,15 December 1996.
- [2] M. Crouau et al, Characterization of 8-stage Hamamatsu R5900 Photomultiplier for the TILE Calorimeter, TILECAL-NOTE 97-129 1997.
- [3] K. Anderson et al, Front-end Electronics for the ATLAS Tile Calorimeter, Proceedings of the Fourth Workshop on Electronics for LHC Experiments (LEB 98), Roma 1998, pag. 239.
- [4] K. Anderson et al, ATLAS TILE CALORIMETER INTERFACE, Proceeding of the 8th Workshop on Electronics for LHC Experiments, Colmar, France, 2002, pag. 269–273.
- [5] S. Berglund et al, THE ATLAS TILE CALORIMETER DIGITIZER, Proceedings of 5th Workshop on Electronics for the LHC Experiments (LEB 99), Snowmass, Colorado, 1999, pas 255–259.
- [6] E. Starchenko et al, Cesium Monitoring system for ATLAS hadronic calorimeter, Nucl. Instrum. Meth. A494 (2002) 508–523.
- [7] R. Brun, HBOOK users guide, Program Library Y250, CERN, 1992.
- [8] R. Brun, O. Couet, C. Vandoni and P. Zanarini, PAW users guide, Program Library Q121, CERN, 1991.
- [9] F. Cadoux et al., The AMS-02 Electromagnetic Calorimeter, Nucl.Phys.Proc.Suppl., 113 (2002) 159–165.
- [10] M. Meucci et al, (the MAGIC Collaboration), The Trigger System of the MAGIC Telescope: on-line selection Strategies for Cherenkov Telescopes, Nucl.Instrum.Meth., A518 (2004) 554–556.