Statistical modelling of electrochemical deposition of nanostructured hybrid films with ZnO-Eosin Y as a case example
Abstract
We study models of electrodeposition of hybrid organic-inorganic films with a special focus on the growth of ZnO with eosin Y. First we propose a rate equation model which assumes that the organic additives form branches with an exposed part above the deposit, growing with larger rate than the pure film and producing at the exposed length. This accounts for the generation of ions from reduction of dissolved oxygen near the branches and reactions with ions to form molecules. The film grows with the same rate of the branches, which qualitatively explains their catalytic effect, and we discuss the role of the additive concentration. Subsequently, we propose a statistical model which represents the diffusion of the hydroxide precursor and of eosin in solution and adopt simple probabilistic rules for the reactions, similarly to diffusion-limited aggregation models. The catalytic effect is represented by the preferencial production of ions near eosin. The model is simulated with relative concentrations in solution near the experimental values. An improvement of the growth rate is possible only with a rather large apparent diffusion coefficient of eosin in solution compared to that of hydroxide precursors. When neighboring eosin clusters competitively grow, the increase in the growth rate and a high eosin loading are observed in the simulated deposits. Those features are in qualitative agreement with experimental results.
keywords:
Zinc oxide , Eosin Y , cathodic electrodeposition , growth model , diffusion-limited aggregation1 Introduction
The growth of thin films from solutions has emerged as an efficient, low temperature, versatile preparation route which can be used at large scale for the production of high quality materials [1]. One of the interests of these methods is the possibility of adding foreign soluble compounds to the deposition bath and modulating film properties by playing with the interactions which arise between the growing film and these compounds. Among the additives, organic ones are of utmost interest since many of them have been shown to act as templating agents and/or crystal growth directing agents, and in many cases as functionalizing agents for the deposits.
These effects are well-documented in the case of zinc oxide. This inorganic compound has attracted much attention due to a broad range of potential high technology applications such as surface acoustic wave filter [2], light emitting diodes [3], lasers [4], varistors [5], gas sensors [6] and solar cells [7]. can be prepared as a thin film by chemical deposition methods [8, 9] or by electrodeposition [10, 11, 12, 13, 14, 15]. The dramatic effects of organic additives on film structures and morphologies have been reported with both deposition routes. For instance, in the presence of citrate, chemically deposited are formed of stacked nanoplates assembled in a biomimetic manner [9]. However the most impressive morphological changes have been observed in electrodeposited zinc oxide. In the presence of sodium dodecylsulfate (SDS), the formation of lamellar nanostructures has been shown [16, 17]. The SDS can be removed from the film and highly porous thin films are released [17]. Different dyes, such as eosin Y (EY) [18, 19, 20, 21], fluorescein (FL) [22], Tetrasulfonated phthalocyanines (TSPc) [23, 24, 25, 26] and riboflavin (RI) [27], have also been shown to incorporate in the film and to give rise to nanostructures. These organic dyes contain negatively charged functions (carboxylate (EY, FL), sulfonate (TSPc) or phosphonate (RI) groups) which allow their direct binding to the oxide crystal surface during the synthesis.
While the effects of additives in film shaping are widely illustrated in experimental works, particularly that of the organic ones, the exact role of these compounds in the growth process remains to be clarified in most cases. The aim of the present work is to fill this gap by proposing kinetic and statistical models for zinc oxide electrodeposition in the presence of EY in solution, which focus on a small number of basic features of those processes. The starting point for this modeling is a series of experimental results, some of them also observed in deposition with different organic additives [17].
The first step of electrochemical zinc oxide synthesis is the cathodic reduction of a hydroxide precursor such as molecular oxygen [11, 13], hydrogen peroxide [14, 15] or nitrate ions [10, 18]:
| (1) |
| (2) |
or
| (3) |
At a temperature slightly above room temperature [28], well crystallized zinc oxide with the wurtzite hexagonal structure is precipitated at the electrode surface:
| (4) |
In many cases, it has also been shown that the organic component presents catalytic properties for the deposition process. This catalytic effect is connected to the improvement of reduction (Eq. 1) with EY [20], TSPc [26], SDS [17], whereas EY has also been shown to catalyze the reduction (Eq. 2) [19]. Thus, one of the assumptions of our models is a distinguished rate of formation of near the species that represent aggregated eosin molecules.
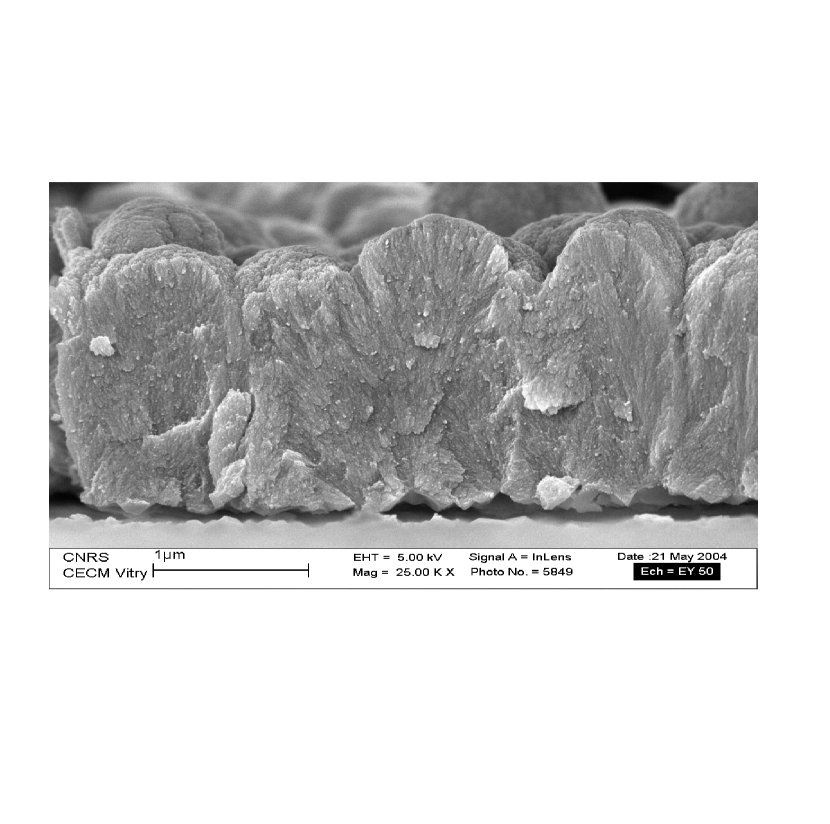
The zinc oxide films prepared in the presence of EY show large round shaped single crystals of zinc oxide filled with self-assembled dye aggregates, as shown in Fig. 1 [21]. It is observed that the dye can be almost completely removed by a soft chemical treatment [29, 30], revealing a network of mesopores which is connected to the surface and can be filled with a solution. This network, formed by aggregated dye molecules, acts as a template for the growth of . In our models, these experimental facts justify the assumption of formation of connected branches of the species that represent the additive molecules in the films.
In Sec. II of this paper, we will introduce our first model, which is based on rate equations, and explains some features of the cooperative growth of a film and additive aggregates. This model is particularly useful for understanding the role of additive concentrations and diffusion coefficients in a qualitative way. Subsequently, in Sec. III we will present a statistical model which represents the main microscopic features of those processes by adopting probabilistic rules of diffusion and aggregation of some chemical species in solution and in the deposit. The hypothesis of a growth mechanism controlled by diffusion-limited aggregation of the eosin molecules was anticipated in Ref. [31]. Simulation results of that statistical model, presented in Sec. IV, provide estimates of growth rates, structures of and EY deposits and shows a role of diffusion coefficients which are in qualitative agreement with experimental findings. Finally, in Sec. V we summarize our results and present our conclusions.
2 Rate equation model
This model aims at explaining basic kinetic features of the growth of with organic additives with drastic simplifications of the film structure.
First we assume that pure growth takes place with rate (in nanometers per second), due to reactions of type (4) near the film surface. If the average volume occupied by one molecule is , then is the growth rate per unit area in that case. Even in the presence of the additives, the roughness of the film surface will be neglected.
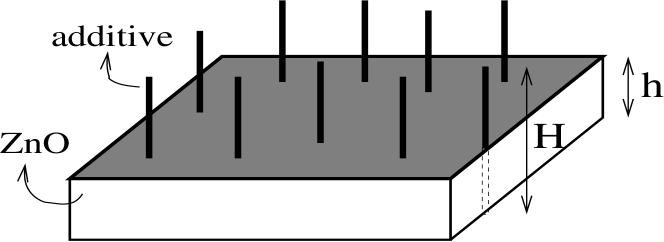
When the additive is present, we assume that it forms straight structures which grow from the electrode, as shown in Fig. 2. This is consistent with the experimental finding of porous structures when eosin Y was removed from the hybrid films [29, 30], but with an initial oversimplification of that structure. The total number of linear branches of the additive is , which depends on the nucleation of the additive at the electrode surface in the beginning of the growth process. Each branch is assumed to grow with rate if it is not covered by the deposit (), so that the height of each branch increases as . is expected to increase with the concentration and the diffusion coefficient of the additive in solution, but the exact dependence on those quantities will not be important at this point.
In order to represent the catalytic effect of the additive, we assume that an excess of is produced near the branches, which leads to the production of at those regions. The rate of production of is expected to be proportional to the length of those branches which is exposed above the film surface, (see Fig. 2), where is the film height. Consequently, the total rate of production of molecules near the additive branches is , where is a reaction constant. A constant reaction rate in this model accounts for the assumption that the oxygen reduction reaction is not under diffusion control. Also, it is assumed that the molecules immediately precipitate and aggregate to the flat film surface, leaving the branches uncovered.
Under these conditions, if the area of the film is , then the number of molecules deposited per unit time is
| (5) |
Here, the first contribution in the right hand side comes from the reactions ocurring near the film surface and the second one comes from the reactions near the branches. The growth rate of the deposit is , which gives
| (6) |
The solution of Eq. (6) is
| (7) |
It gives a constant growth rate for the deposit at long times, with being the characteristic time of decay. It means that the film growth rate attains the same growth rate of the branches in the steady state. The rate of production of near the film surface is , but the exposed height of the branches saturates at , and produces an excess of molecules in their neighborhood which is enough for branches and film to grow with the same rate.
The dependence of on is not explicit in the model, but it exists. As the number of branches per unit area increases, the aggregation of the diffusing additive to them is facilitated and, consequently, their growth rate increases. From the dependence of the saturation value of on , we expect that it decreases as increases: the steady state regime is more rapidly attained ( decreases), with a smaller exposed height of the branches. On the other hand, the dependence of on suggests the opposite behavior, i. e. that it increases with . The interplay of these effects will determine the overall dependence of on . Anyway, this analysis shows the nontrivial consequences of the nucleation processes (which determine ) on the long time behavior of the system.
Now let us consider the effect of the additive concentration in solution, , assuming that its diffusion coefficient is constant (constant temperature conditions). Since only represents the reactions occurring near the film surface, it is expected to be constant as increases. On the other hand, the growth rate of the branches, , is some monotonically increasing function of . For low concentrations, is small, consequently the branches will be covered by . Quantitatively, this is the case where , which implies , where is a critical concentration of additive such that . For higher concentrations, we have and the above solution of the rate equation model is valid.
The dependence of the growth rate on the additive concentration, with the catalytic effect only for , is illustrated in Fig. 3. There, we assume that linearly increases with when the concentration is not too large (first order reaction). This is the regime where our model is expected to work. For large concentrations, Fig. 3 shows a saturation of growth rate, which is a consequence of the limitations to oxigen diffusion towards the surface. Indeed, in this regime, the catalytic effect of eosin to reduce oxygen does not result in an increased production of hydroxide ions anymore. The hydroxide precursor current towards the electrode becomes constant, which also occurs with the growth rate of ZnO, which is directly linked to the availability of hydroxyde ions.
The behavior observed in the intermediate EY concentration range is in qualitative agreement with the findings of Ref. [19] for /EY electrodeposition with hydrogen peroxide as hydroxide precursor: no significant effect in the growth rate is found for EY concentrations below , but an increase is observed for EY concentrations above that value. On the other hand, no well-defined plateau in the growth rate is observed in electrodeposition with molecular oxygen [32], but an increase in the growth rate even for small additive concentrations. This is probably due to nucleation features that are not properly represented in the present simplified model.
The main parameters of the rate equation model are the growth rates and , which depend on several parameters, such as concentrations of hydroxide precursors and additives in solution, zinc ions concentration and the respective diffusion coefficients. However, the model leads to two important conclusions. First, in order that the catalytic effect is observed, it is necessary that , consequently the concentration and the diffusion coefficient of the additive in solution must be combined in a suitable way to fullfill this condition. Secondly, if the additive branches are able to grow above the film surface, then the film growth rate is the same of those branches in the stationary state ( in Eq. 7), independently of the rate of pure films growth. These conclusions will guide the simulation work on the microscopic model.
3 Microscopic model
Now we present a more complete model for the electrodeposition of with organic additives, in which the physical properties of different species in solution and in the deposit are taken into account. This is particularly important to understand the role of diffusion coefficients and to predict the structure of the deposit, as well as to perform quantitative comparisons with experimental data. At the latter point, we will basically refer to /EY films data available, thus the presentation of the model will be inspired by this growth process.
We will consider a lattice model with two species executing random walks in solution and two species forming a deposit grown above a flat electrode. All lengths will be given in lattice units. Due to the relative complexity of this model, it will be solved by simulation. A two-dimensional version will be discussed, which we expect to capture the main features of the real process, at the same time of being amenable for computation.
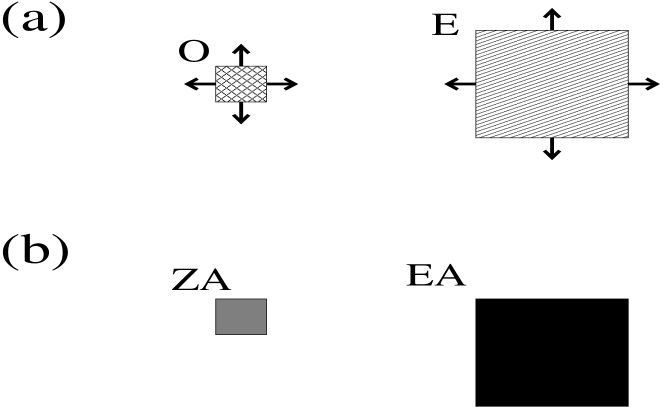
The species in the solution, O and E, represent the hydroxide precursor ( or ) and eosin Y, respectively. Their different sizes, as shown in Fig. 4a, qualitatively account for the different masses and radius. Their auto-diffusion coefficients are and , i. e. each O (E) in solution executes () random movements of unit size per unit time. These rates set the time scale of our model.
The deposit will be formed by two aggregated species, named ZA and EA, representing respectively the and the eosin Y molecules in the film, as shown in Fig. 4b. For simplicity, their sizes are the same as those of the species in solution.
Although the zinc and hydroxide ions play an essential role in the reactions leading to the formation of (Eqs. 1, 2 and 4), they will not be explicitely represented in our model. Instead, their effects will be described by probabilities of removing O particles from the solution and producing new aggregated particles, thus avoiding the complications of the explicit representation of the above mentioned reactions. Following this reasoning, the growth process is represented by the simplified reactions and , which can take place with given probabilities and under conditions that are related to the neighborhood of the particles in solution.
The growth process begins with a flat electrode (a line of length ) and a solution with concentrations and of O and E particles, respectively.
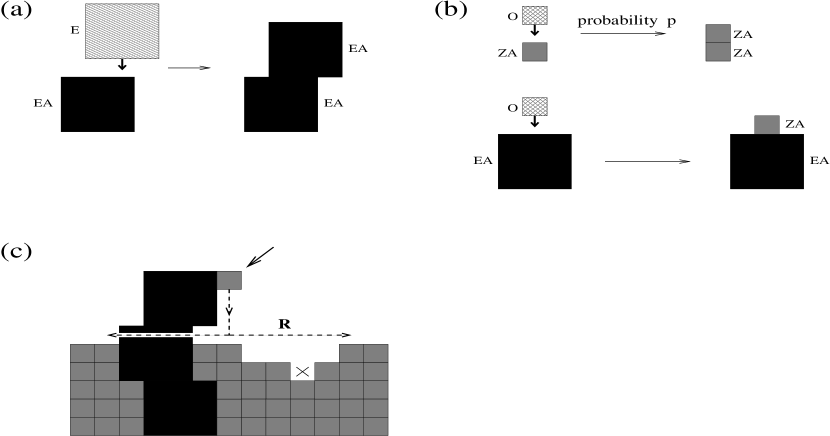
The aggregation of an E particle (reaction ) occurs when that particle has a nearest neighbor of a previously aggregated EA (Fig. 5a) or when it has a nearest neighbor site belonging to the electrode (the initial substrate). The new EA particle permanently sticks at the position where it is formed. The contact of E particles with ZA sites never generates EA particles, which is a key hypothesis for explaining the formation of continuous fibers of eosin Y in the films.
The reaction occurs upon contact of a particle O with ZA or EA. When the O particle has a neighbor site ZA or a neighbor site belonging to the electrode (initial substrate), the reaction occurs with probability , otherwise the O particle remains in the solution. When the O particle has a neighboring EA, that reaction occurs with probability . These rules are illustrated in Fig. 5b.
Contrary to the EA particles, ZA particles are allowed to precipitate and diffuse on the film surface after their formation. In order to represent the main features expected for this process and save computational time, a simple diffusion mechanism will be mimicked immediately after the ZA particle is created: it precipitates to the topmost empty site of its current column, searches for the point with the highest number of nearest neighbors ZA whithin a certain radius (defined below), and permanently sticks at that point. These processes are illustrated in Fig. 5c.
The above stochastic rules are motivated by some experimental features of the /EY films growth. The rules for formation of EA particles represent the initial nucleation of EY at the electrode and the subsequent formation of EY clusters upon reduction of the molecules that reach the film surface. Since EA is not formed upon contact of E with ZA, there will be no isolated EA particle in the ZA matrix, which accounts for the fact that almost all EY can be removed from the hybrid films, leaving them with a porous structure [29, 30]. As regards the formation of ZA particles, the higher probability of occurrence after contact of O with EA follows from the assumption that oxygen precursors reduction is enhanced near the eosin clusters, which facilitates the formation of in those regions. This accounts for the catalytic effect of eosin Y, also observed experimentally.
For the diffusion of a ZA particle on the ZnO film surface after its formation, we consider a surface diffusion coefficient , which gives a radius for searching the final aggregation position as , where is the current average time for one layer deposition. This time is updated during the simulation, while is kept fixed. The condition to choose the final aggregation point follows the same ideas of the Wolf-Villain model for thin film deposition [33], and are reasonable for formation of a crystalline structure due to the trend of increasing the binding energy.
The height of the solution above the film surface is kept constant during the simulation of the growth process. New particles (O or E) are left at random positions of the top layer of the solution immediately after an aggregation event (rections , ), in order to maintain constant concentrations. This height was lattice units in our simulations. The diffusion layer near the film surface, in which concentrations of O and E were reduced, was of order of lattice units or less. These conditions are reasonable to represent experiments in which a rotating disk electrode was used, thus avoiding the growth of the diffusion layer and the subsequent decrease of the growth rate.
We recall that the rules for aggregation of E particles are the same of the original diffusion-limited aggregation (DLA) model of Witten and Sander [34], in which growth took place from a single seed. Extensions to the case of an initial flat surface were also considered by several authors [35, 36, 37, 38]. To be more precise, due to the collective diffusion mechanism of E particles in solution, the growth kinetics of E is equivalent to that of the multiparticle biased DLA (MBDLA) in the condition of zero bias [39, 40, 41, 42]. Indeed, MBDLA was proposed as a model for electrodeposition of alloys [40, 43]. On the other hand, the aggregation rules of ZA particles, which include surface relaxation, suggest Edwards-Wilkinson growth in that case [44, 45]. However, in the cooperative growth model, a nontrivial interplay of both processes is observed, as shown below.
4 Results for the microscopic model
In all simulations presented here, we considered , and in most cases the lattice lenghts are and the diffusion coefficient of aggregated ZA is . Some data for were also collected in order to search for possible finite-size effects, mainly when the thickest deposits were grown. In experiments, the maximum ratio of concentrations of eosin and hydroxide precursor in solution is in the range , thus in this model we worked with ratios between (no eosin) and .
The results of the rate equation model of Sec. II suggest that the growth rate of the additive (eosin) is proportional to , while the growth rate of the pure deposit, , is proportional to . In the following, the model parameters will be tuned in the light of these relations and the conclusions of the model of Sec. II.
First the model was simulated considering (thus ), in order to account for the much larger mass of eosin when compared to the hydroxide precursors. was considered in all simulations, some of them with , , and others with , . Several different values of were considered, with .
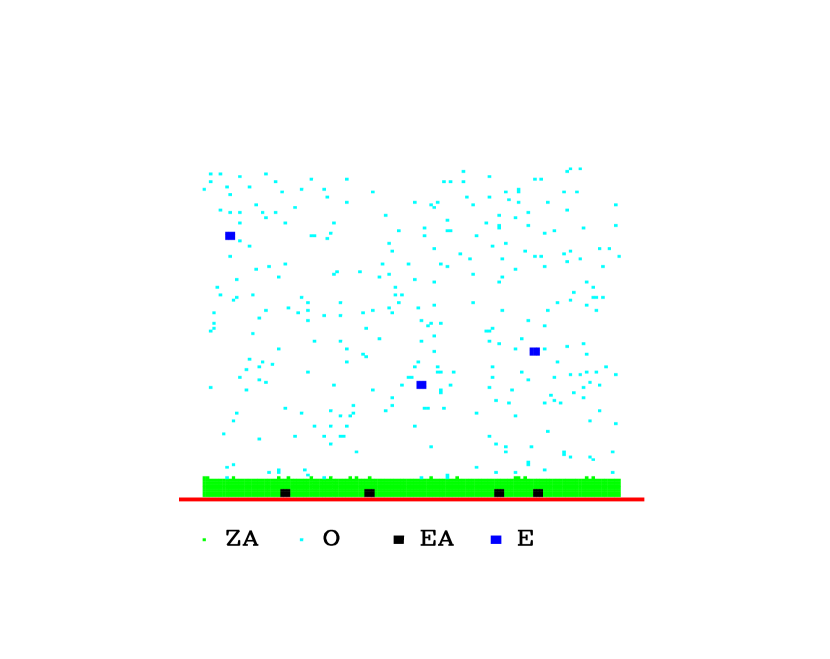
In Fig. 6 we show a region of a deposit obtained with , and , at . Some EA particles are present at the initial electrode surface, but they are rapidly covered by the ZA layer. Subsequently, there is no possibility for uptaking other eosin molecules in the film, then the final growth rate is determined by ZA aggregation. From the results obtained with such small diffusion coefficient of E in solution, we conclude that this is not the suitable condition to observe the catalytic effect of the additive.
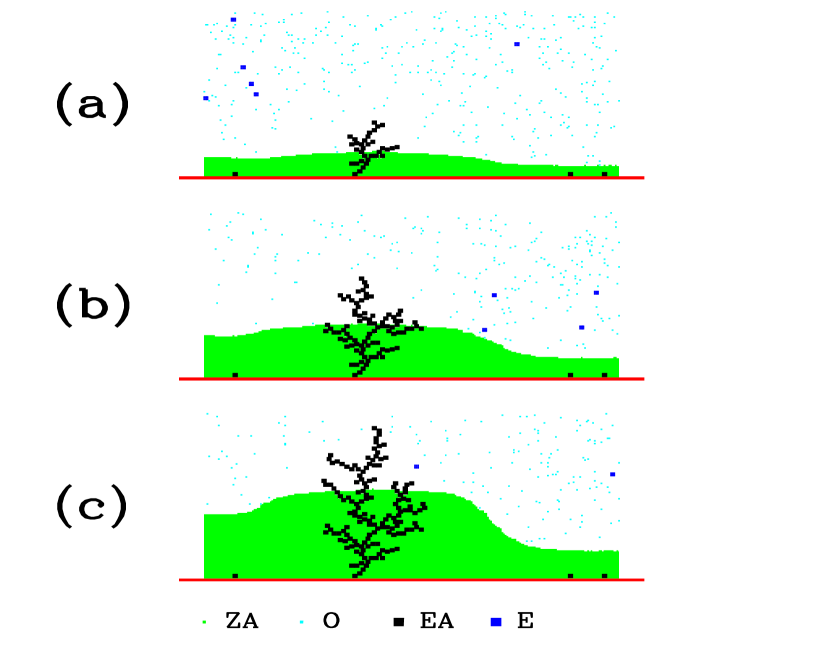
Subsequently, we assumed that E particles had a significantly large diffusion coefficient, , which is equal to the coefficient of Z. In Figs. 7a, 7b and 7c, we show the time evolution of a region of a deposit grown with , and . Although many EA particles attach to the electrode in the beginning of the process, they frequently become covered by ZA particles after some time, even with a small probability of O-ZA aggregation. The growth process is improved only at isolated regions where clusters of EA particles succeed to grow, as shown in Figs. 7a-7c.
When compared to the case without E particles, the average height of the deposit increases more than twice near the clusters of Figs. 7a-c, for the same time of growth. However, the large distance between the surviving branches leads to a very large surface roughness at long lengthscales. Moreover, this roughness rapidly increases in time because the mounds growing with large rates are separated by long valleys which slowly grow. These features are not observed in experiments, for which we refer to Fig. 1 as a typical example. We also tested smaller concentrations of , but keeping the relative concentration between E and O fixed (), obtaining similar results (growth of EA branches may be even more difficult for the same ). We conclude that larger values of must be tested in order to find the suitable conditions to represent the experimental results.
Following this reasoning, we also considered the case , and obtained results that qualitatively agree with experimental findings. In this case, small concentrations of E particles are able to improve the growth process, with the creation of a large number of nucleation centers in the eletrode, the formation of a large number of branches and a competition between them as the deposit grows, as well as a much smaller surface roughness. The formation of an eosin interconnected network inside the ZnO matrix is clear, which also agrees with the main features of the experimental nanostructures.
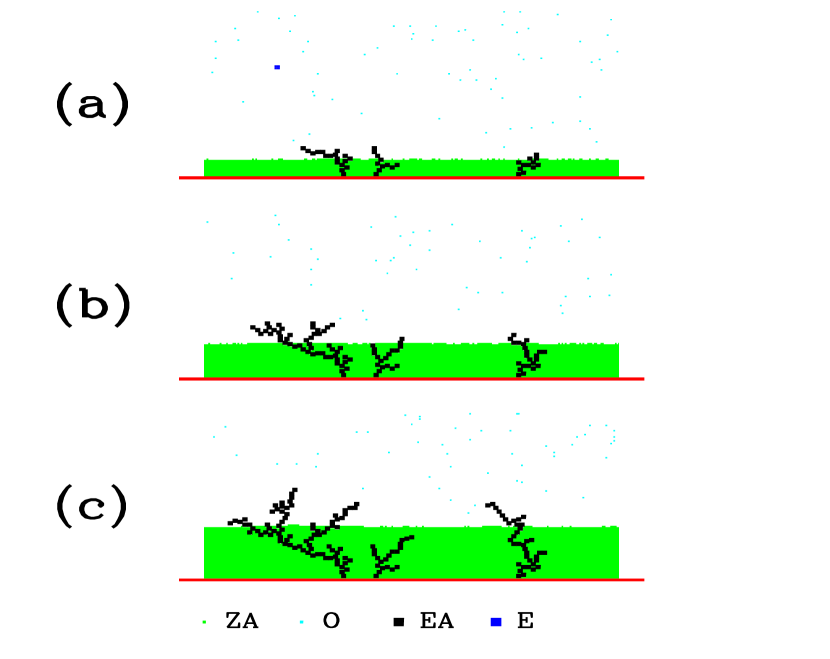
Fig. 8 illustrates the beginning of the growth of a region of a deposit with , , and . The average height for (Fig. 8c) is nearly times larger than the height of the film grown without E particles during the same time, and the eosin loadings in the deposits (ratio between number of EA particles and ZA particles) of Figs. 8a-8c increase from to . Simulation at longer times show sthat these quantities attain different steady state values, so that the features of Fig. 8 may be interpreted as typical of the initial growth process.
One interesting point revealed in Fig. 8 is the competition between the growing EA clusters. The central cluster of Figs. 8a and 8b grew slower than the neighboring ones and, consequently, was covered by particles ZA in Fig. 8c, while the larger surviving clusters created more branches.
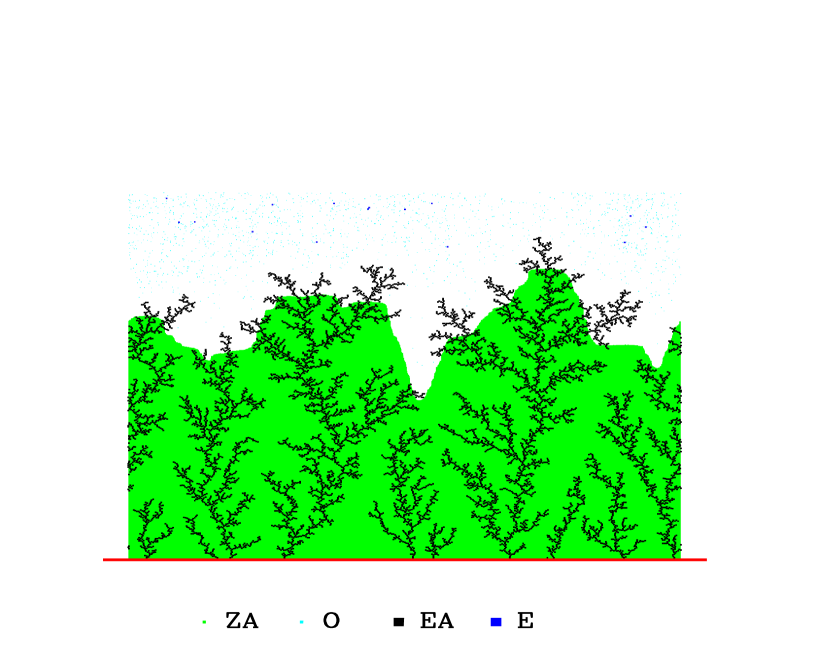
In Fig. 9 we show a region of a deposit grown until with the same parameters of those in Fig. 8, except that . The surface roughness is larger in this case due to the inhomogeneous growth of EA branches and smaller diffusion coefficient of aggregated particles. However, other quantities are not much different from those obtained with , such as the growth rate at steady state conditions, which is nearly times larger than the rate of film grown without E particles. It clearly shows the catalytic effect of the eosin clusters. Another important quantity is the EA loading in the film, which is nearly . This is a high value compared to the relative concentration of in solution.
The above results show that a realistic description of the growth of /EY films must take into account a remarkably large diffusion coefficient for eosin in solution. A quantitative comparison with the ratio of the model is not reliable because the model contains a small number of adjustable parameters, while the efficiency of other processes such as precipitation are not taken into account. However, it is noticeable that an unexpectedly large diffusion coefficient of EY is also obtained experimentally: and for and EY, respectively, in the classical deposition condition of the films, that is at and in chloride medium [19]. Consequently, the experimental ratio between diffusion coefficients is near , a much smaller value than the ratio between the masses of EY and , which is .
The order of magnitude of the growth rate increase in the films of Figs. 8 and 9, when compared to the films without EA particles, is also consistent with experiments: a factor was obtained in Ref. [19], with hydrogen peroxide as the oxygen precursor, when , while a factor was obtained in Ref. [32], with molecular oxygen precursor, when . Moreover, the high eosin loading of was observed in the latter experiments [32], which also agrees with the predictions of our model.
We also recall that the rules of the model were proposed so that all EA branches are connected to the electrode - see the images in Figs. 7, 8 and 9. At long times, it is also observed that most EA particles belong to some of the branches which are exposed above the film surface - see Figs. 8 and 9. Accordingly, a small fraction of EA particles is hidden in the deposit. This also agrees with the experimental finding that eosin can be almost completely removed by a soft chemical treatment of the hybrid films [29, 30].
Finally, it is interesting to point out that the configurations of EA branches are similar to those encountered in a model of diffusion-controlled deposition by Burlatsky et al [38], whose growth mechanisms are the same adopted for the E particles in our model. However, while the screening process of the larger clusters was the only reason for small clusters to stop growing in their model, here this effect is enhanced by the deposition of ZA particles, which may eventually cover an EA cluster and suppress its growth (see e. g. Fig. 8c). It is also important to notice the similarity between the EA clusters and the electrodeposited copper aggregates of Refs. [46, 47], which clearly show such screening effects.
From the point of view of competitive growth models, the results of the present paper also show nontrivial features. It is usually observed that one of the competing dynamics is dominant at long times and large lengthscales, such as in the widely studied EW-KPZ crossover [48, 49, 50, 51] or in random to correlated growth [52]. However, here it was shown that a less trivial association of these different dynamics to different chemical species leads to a cooperative behavior where features of both dynamics are to some extent preserved. In the present model, the competing dynamics are those of MBDLA without bias for the EA particles, and of the EW model for the ZA particles, as discussed in Sec. IV.
5 Conclusion
We proposed a rate equation model and a microscopic statistical model to represent some features of electrodeposition with organic additives, mainly focusing the application to electrodeposition with eosin Y.
The rate equation model assumes the formation of branches of the additive which are extended above the film surface, and is useful to understand the basic features of the growth process. Under conditions that the branches grow faster than the pure deposit, it was shown that both structures grow with the growth rate of the former.
With the statistical model, we were able to reproduce several qualitative features of the electrodeposition of /EY films by assuming that it may be viewed as a diffusion-limited aggregation process with an interplay between different chemical species in solution and a catalytic effect of the eosin clusters for the formation of . Among the predictions of the model which are in qualitative agreement with experimental findings, it is important to mention: 1) the requirement of particularly large diffusion coefficients of EY in solution, so that it is able to improve the growth process with small concentrations; 2) the formation of branches of EY connected to the surface and filling the film structure without significant large scale inhomogeneities; 3) the increase in relative growth rates and the high EY loadings. Consequently, we believe that this model incorporated most of the basic features of the electrodeposition with EY, and may be extended in order to provide quantitatively good results or to represent related growth processes.
Acknowledgements
The authors thank Dr. Aurélie Goux for the preparation of the film shown in Fig.1. FDAAR thanks Laboratoire de Electrochimie et Chimie Analytique where part of this work was done, for the hospitality, and acknowledges support by CNPq (Brazil) and CNRS (France). DL and TP acknowledge the fruitful collaboration with Prof. Tsukasa Yoshida devoted to the electrodeposition of ZnO-Eosin films.
References
- [1] D. Lincot, Thin Solid Films 487 (2005) 40.
- [2] N. W. Emanetoglu, C. Gorla, Y. Liu, S. Liang, and Y. Lu, Mater. Sci. Semicond. Process 2 (1999) 247.
- [3] R. Konenkamp, R.C. Word, and M. Godinez, Nanoletters 5 (2005) 2005.
- [4] M.H. Huang, S. Mao, H. Feick, H. Yan, Y. Wu, H. Kind, E. Weber, R. Russo, and P. Yang, Science 292 (2001) 1897.
- [5] Y. Lin, Z. Zhang, Z. Tang, F. Yuan, and J. Li, Adv. Mater. Opt. Electron. 9 (1999) 205.
- [6] N. Golego, S.A. Studenikin, and M. Cocivera, J. Electrochem. Soc. 147 (2000) 1592.
- [7] K. Keis, C. Bauer, G. Boschloo, A. Hagfelt, K. Westermark, H. Rensmo, and H. Siegbahn, J. Photochem. Photobiology A 148 (2002) 57.
- [8] L. Vaysieres, Adv. Mater. 15 (2003) 464.
- [9] Z.R. Tian, J.A. Voigt, J. Liu, B. Mckenzie, M. J. Macdermott, M.A. Rodriguez, H. Konishi, and H. Xu, Nature Mater. 2 (2003) 821.
- [10] M. Izaki and T. Omi, Appl. Phys. Lett. 68 (1996) 2439.
- [11] S. Peulon and D. Lincot, Adv. Mater. 8 (1996) 166
- [12] S. Peulon and D. Lincot, J. Electrochem. Soc. 145 (1998) 864.
- [13] T. Pauporté and D. Lincot, Appl. Phys. Lett. 75 (1999) 3817.
- [14] T. Pauporté and D. Lincot, J. Electrochem. Soc. 148 (2001) C310.
- [15] T. Pauporté and D. Lincot, J. Electroanal. Chem. 517 (2001) 54.
- [16] K.S. Choi, H.C. Lichtenegger, and G.D. Stucky, J. Am. Chem. Soc. 124 (2002) 12402.
- [17] E. Michaelis, D. Wöhrle, J. Rathousky, and M. Wark, Thin Solid Films 497 (2006) 163.
- [18] T. Yoshida, K. Terada, D. Schlettwein, T. Oekermann, T. Sugiura, and H. Minoura, Adv. Mater. 12 (2000) 1214.
- [19] T. Pauporté, T. Yoshida, A. Goux, and D. Lincot, J. Electroanal. Chem. 534 (2002) 55.
- [20] T. Yoshida, T. Pauporté, D. Lincot, T. Oekermann, and H. Minoura, J. Electrochem. Soc. 150 (2003) C608.
- [21] T. Pauporté, T. Yoshida, R. Cortès, M. Froment , and D. Lincot, J. Phys. Chem. B, 107 (2003) 10077.
- [22] K. Okabe, T. Yoshida, T. Sugiura, and H. Minoura, Trans. Mater. Research. Soc. Jap., 26 (2001) 523.
- [23] T. Yoshida, K. Miyamoto, N. Hibi, T. Sugiura, H. Minoura, D. Schlettwein, T. Oekermann, G. Schneider, and D. Wöhrle, Chem. Lett. 27 (1998) 599.
- [24] T. Yoshida, M. Tochimoto, D. Schlettwein, D. Wöhrle, T. Sugiura, and H. Minoura, Chem. Mater. 11 (1999) 2657.
- [25] D. Schlettwein, T. Oekermann, T. Yoshida, M. Tochimoto, and H. Minoura, J. Electroanal. Chem. 481 (2000) 42.
- [26] T. Pauporté, F. Bedioui, and D. Lincot, J. Mat. Chem. 15 (2005) 1552
- [27] S. Karuppuchamy, T. Yoshida, T. Sugiura, and H. Minoura, Thin Solid Films 397 (2001) 63.
- [28] A. Goux, T. Pauporté, J. Chivot, and D. Lincot, Electrochim. Acta 50 (2005) 2239.
- [29] T. Yoshida, M. Iwaya, H. Ando, T. Oekermann, K. Nonomura, D. Schlettwein, D. Wöhrle, and H. Minoura, Chem. Comm. (2004) 400.
- [30] T. Pauporté, T. Yoshida, D. Komatsu, and H. Minoura, Electrochem. Solid State Lett. 9 (2006) H16.
- [31] D. Lincot, T. Pauporté, A. Goux, V. Lair, and T. Yoshida, Meet. Abstr. - Electrochem. Soc. 501, 460 (2006).
- [32] T. Pauporté, unpublished results.
- [33] D. Wolf and J. Villain, Europhys. Lett. 13 (1990) 389.
- [34] T. A. Witten and L. M. Sander, Phys. Rev. Lett. 47 (1981) 1400.
- [35] P. Meakin, Phys. Rev. A 27, 2616 (1983); 30 (1984) 4207.
- [36] Z. Racz and T. Vicsek, Phys. Rev. Lett. 51 (1983) 2383.
- [37] R. Jullien, M. Kolb, and R. Botet, J. Physique (Paris) 45 (1984) 395.
- [38] S. F. Burlatsky, G. S. Oshanin, and M. M. Elyashevich, Phys. Lett. A 151, (1990) 538.
- [39] A. Sánchez, M. J. Bernal, and J. M. Riveiro, Phys. Rev. E 50 (1994) R2427 .
- [40] M. Castro, R. Cuerno, A. Sánchez and F. Domínguez-Adame, Phys. Rev. E 57 (1998) R2491.
- [41] M. Castro, R. Cuerno, A. Sánchez and F. Domínguez-Adame, Phys. Rev. E 62 (2002) 161.
- [42] W. Schwarzacher, J. Phys.: Condens. Matter 16 (2004) R859.
- [43] J. M. Riveiro and M. J. Bernal, J. Non-Cryst. Solids 160 (1993) 18.
- [44] S. F. Edwards and D. R. Wilkinson, Proc. R. Soc. London 381 (1982) 17.
- [45] A. L. Barabási and H. E. Stanley, Fractal concepts in surface growth (Cambridge University Press, Cambribge, England, 1995).
- [46] C. Léger, J. Elezgaray, and F. Argoul, Phys. Rev. Lett. 78 (1997) 5010.
- [47] C. Léger, J. Elezgaray, and F. Argoul, Phys. Rev. Lett. 58 (1998) 7700.
- [48] B. Grossmann, H. Guo, and M. Grant, Phys. Rev. A 43 (1991) 1727.
- [49] T. Nattermann and L.-H. Tang, Phys. Rev. A 45 (1992) 7156.
- [50] J. G. Amar and F. Family, Phys. Rev. A 45 (1992) R3373.
- [51] A. Chame and F. D. A. Aarão Reis, Phys. Rev. E 66 (2002) 051104.
- [52] F. D. A. Aarão Reis, Phys. Rev. E 73 (2006) 021605.