Vulnerability of weighted networks
Abstract
In real networks complex topological features are often associated with a diversity of interactions as measured by the weights of the links. Moreover, spatial constraints may as well play an important role, resulting in a complex interplay between topology, weight, and geography. In order to study the vulnerability of such networks to intentional attacks, these attributes must be therefore considered along with the topological quantities. In order to tackle this issue, we consider the case of the world-wide airport network, which is a weighted heterogeneous network whose evolution and structure are influenced by traffic and geographical constraints. We first characterize relevant topological and weighted centrality measures and then use these quantities as selection criteria for the removal of vertices. We consider different attack strategies and different measures of the damage achieved in the network. The analysis of weighted properties shows that centrality driven attacks are capable to shatter the network’s communication or transport properties even at very low level of damage in the connectivity pattern. The inclusion of weight and traffic therefore provides evidence for the extreme vulnerability of complex networks to any targeted strategy and need to be considered as key features in the finding and development of defensive strategies.
I Introduction
The network representation applies to large communication infrastructure (Internet, e-mail networks, the World-Wide-Web), transportation networks (railroads, airline routes), biological systems (gene and/or protein interaction networks) and to a variety of social interaction structures bara02 ; mendes03 ; psvbook ; AmaralPNAS . Very interestingly, many real networks share a certain number of topological properties. For example, most networks are small-worlds watts98 : the average topological distance between nodes increases very slowly (logarithmically or even slower) with the number of nodes. Additionally, “hubs” [nodes with very large degree compared to the mean of the degree distribution ] are often encountered. More precisely, the degree distributions exhibit in many cases heavy-tails often well approximated for a significant range of values of degree by a power-law behavior () bara02 ; mendes03 from which the name scale-free networks originated. Real networks are however not only specified by their topology, but also by the dynamical properties of processes taking place on them, such as the flow of information or the traffic among the constituent units of the system. In order to account for these features, the edges are endowed with weights: for example, the air-transportation system can be represented by a weighted network, in which the vertices are commercial airports and the edges are non-stop passenger flights. In this context, a natural definition of link weights arises, as the capacity (in terms of number of passengers) of the corresponding flight. Data about real weighted networks (communication and infrastructure networks, scientific collaboration networks, metabolic networks, etc.) have been recently studied, giving particular attention to the relation between weight properties and topological quantities barrat:2004a ; almaas:2004 ; Li:2003a . These findings have also generated several studies concerning modeling approaches in which the mutual influence of weights and topology plays an explicit role in determining network’s properties barrat:2004b ; barrat:2004c ; bianconi ; dorogovtsev:2004 ; wang:2005 .
One of the most striking effects of the complex topological features
of networks concerns their vulnerability to attacks and random
failures. Compared to “regular” -dimensional lattices and random
graphs with a bounded degree distribution, heavy-tailed networks can
tolerate very high levels of random
failure havlin01 ; newman00 . On the other hand, malicious attacks
on the hubs can swiftly break the entire network into small
components, providing a clear identification of the elements which
need the highest level of protection against such attacks
barabasi00 ; pv01a . In this context it is therefore important to
study how the introduction of traffic and geographical properties may
alter or confirm the above findings. In particular we are interested
in two main questions: (i) which measures are best suited to assess
the damage suffered by weighted networks and to characterize the most
effective attack (protection) strategies; (ii) how traffic and spatial
constraints influence the system’s robustness. In this article, our
attention is therefore focused on weighted networks with geographical
embedding and we analyze the structural vulnerability with respect to
various centrality-driven attack strategies. In particular, we propose
a series of topological and weight-depending centrality measures that
can be used to identify the most important vertices of a weighted
network. The traffic integrity of the whole network depends on the
protection of these central nodes and we apply these considerations to
a typical case study, namely the world-wide airport network. We find
that weighted networks are even more vulnerable than expected in that
the traffic integrity is destroyed when the topological integrity of
the network is still extremely high. In addition all attacks
strategies, both local and non-local perform with almost the same
efficacy. The present findings may help in providing a quantitative
assessment of the most vulnerable elements of the network and the
development of adaptive reactions aimed at contrasting targeted
attacks.
II Network data set
In the following we use the world-wide air-transportation network (WAN), built from the International Air Transportation Association database (www.iata.org). This database contains the direct flight schedules and available seats data from the vast majority of the world’s airlines for the year 2002. The network obtained from the IATA database contains interconnected airports (vertices) and direct flight connections (edges). This corresponds to an average degree of , while the maximal one is showing a strong heterogeneity of the degrees. This is confirmed by the fact that the degree distribution can be described by the functional form , where and is an exponential cut-off which finds its origin in physical constraints on the maximum number of connections that can be handled by a single airport luisair ; guimera . The WAN is a small-world: the average shortest path length, measured as the average number of edges separating any two nodes in the network, is . The data contained in the IATA database allow to go beyond the simple topological representation of the airports connections by obtaining a weighted graph weightbook that includes the traffic and actual length of each link, specyfying respectively the number of available seats in flights between cities and during the year 2002 and the euclidean distance specifying the route length between cities and barrat:2004a ; guimera ; Barrat:2005 . The weights are symmetric () for the vast majority of edges so that we work with a symmetric undirected graph. In addition to the very large degree fluctuations, both the weights and the strength are broadly distributed barrat:2004a ; Li:2003a adding another level of complexity in this network.
III Measures of centrality
A key issue in the characterization of networks is the identification of the most central nodes in the system. Centrality is however a concept that can be quantified by various measures. The degree is a first intuitive and local quantity that gives an idea of the importance of a node. Its natural generalization to a weighted graph is given by the strength of vertices defined for a node as yookwt ; barrat:2004a
| (1) |
where the sum runs over the set of neighbors of . In the case of the air transportation network it quantifies the traffic of passengers handled by any given airport, with both a broad distribution and strong correlations with the degree, of the form with barrat:2004a (a random attribution of weights would lead to and thus ).
Since space is also an important parameter in this network, other interesting quantities are the distance strength and outreach of
| (2) |
where is the Euclidean distance between and . These quantities describe the cumulated distances of all the connections from the considered airport and the total distance traveled by passengers from this airport, respectively. They display both broad distributions and grow with the degree as with Barrat:2005 , and , with , showing the existence of important correlations between distances, topology and traffic.
Such local measures however do not take into account non-local effects, such as the existence of crucial nodes which may have small degree or strength but act as bridges between different part of the network. In this context, a widely used quantity to investigate node centrality is the so-called betweenness centrality (BC) freeman , which counts the fraction of shortest paths between pairs of nodes that passes through a given node. More precisely, if is the total number of shortest paths from to and is the number of these shortest paths that pass through the vertex , the betweenness of the vertex is defined as , where the sum is over all the pairs with . Key nodes are thus part of more shortest paths within the network than less important nodes.
In weighted networks, unequal link capacities make some specific paths more favorable than others in connecting two nodes of the network. It thus seems natural to generalize the notion of betweenness centrality through a weighted betweenness centrality in which shortest paths are replaced with their weighted versions. A straightforward way to generalize the hop distance (number of traversed edges) in a weighted graph consists in assigning to each edge a length that is a function of the characteristics of the link . For example for the WAN, should involve quantities such as the weight or the Euclidean distance between airports and . It is quite natural to assume that the effective distance between two linked nodes is a decreasing function of the weight of the link: the larger the flow (traffic) on a path, the more frequent and the fastest will be the exchange of physical quantities (e.g. information, people, goods, energy, etc.). In other words, we consider that the “separation” between nodes and decreases as increases. While a first possibility would be to define the length of an edge as the inverse of the weight, , we propose to also take into account the geographical embedding of the network, through the following definition:
| (3) |
It is indeed reasonable to consider two nodes of the networks as further apart if their geographical distance is larger, however a large traffic allows to decrease the “effective” distance by providing more frequent travel possibilities.
For any two nodes and , the weighted shortest path between and is the one for which the total sum of the lengths of the edges forming the path from to is minimum, independently from the number of traversed edges. We denote by the total number of weighted shortest paths from to and the number of them that pass through the vertex ; the weighted betweenness centrality (WBC) of the vertex is then defined as
| (4) |
where the sum is over all the pairs with 111 As
already noted by Brandes, the algorithm proposed in
Ref. brandes can be easily extended to weighted graphs, using
in addition Dijkstra’s algorithm dijkstra which provides a way
to compute weighted shortest paths in at most where
is the number of edges. . The weighted betweenness represents a
trade-off between the finding of “bridges” that connect different
parts of a network, and taking into account the fact that some links
carry more traffic than others. We note that the definition
(4) is very general and can be used with any definition of the
effective length of an edge .
Centrality measures correlations
The probability distributions of the various definitions of centrality are all characterized by heavy tailed distributions. In addition a significant level of correlation is observed: vertices that have a large degree have also typically large strength and betweenness. When a detailed analysis of the different rankings is done,however we observe that they do not coincide exactly. For example, in the case of the WAN the most connected airports do not necessarily have the largest betweenness centrality luisair ; guimera ; Barrat:2005 . Large fluctuations between centrality measures also appear when inspecting the list of the airports ranked by using different definitions of centrality including weighted ones: strikingly, each definition provides a different ranking. In addition, some airports which are very central according to a given definition, become peripheral according to another criteria. For example, Anchorage has a large betweenness centrality but ranks only and in terms of degree and strength, respectively. Similarly, Phoenix or Detroit have large strength but low ranks () in terms of degree and betweenness.
While previous analysis have focused on the quantitative correlations between the various centrality measures here we focus on ranking differences according to the various centrality measures. A quantitative analysis of the correlations between two rankings of objects can be done using rank correlations such as Kendall’s num_rec
| (5) |
where is the number of pairs whose order does not change in the two different lists and is the number of pairs whose order was inverted. This quantity is normalized between and : corresponds to identical ranking while is the average for two uncorrelated rankings and is a perfect anticorrelation.
| Degree | 1 | 0.7 | 0.58 | 0.584 | 0.63 | 0.39 | |
|---|---|---|---|---|---|---|---|
| Distance strength | 0.7 | 1 | 0.56 | 0.68 | 0.48 | 0.23 | |
| Strength | 0.58 | 0.56 | 1 | 0.83 | 0.404 | 0.24 | |
| Outreach | 0.584 | 0.68 | 0.83 | 1 | 0.404 | 0.21 | |
| Betweenness | 0.63 | 0.48 | 0.404 | 0.404 | 1 | 0.566 | |
| Weighted | 0.39 | 0.23 | 0.24 | 0.21 | 0.566 | 1 |
Table 1 gives the values of for all the possible pairs of centrality rankings. For , two random rankings yield a typical value of so that even the smallest observed is the sign of a strong correlation (All the values in this table were already attained for a sublist of only the first most central nodes, with ). Remarkably enough, even a highly non-local quantity such as the BC is strongly correlated with the simplest local, non weighted measure given by the degree. The weighted betweenness is the least correlated with the other measures (except with the betweenness), because involves ratios of weights and distances.
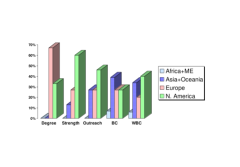
Another important issue concerns how the centrality ranking relates to
the geographical information available for infrastructure networks
such as the WAN. Figure 1 displays the geographical
distribution of the world’s fifteen most central airports ranked
according to different centrality measures. This figure highlights the
properties and biases of the various measures: on one hand,
topological measures miss the economical dimension of the world-wide
airport while weighted measures reflect traffic and economical
realities. Betweenness based measures on the other hand pinpoint the
most important nodes in each geographical zone. In particular, the
weighted betweenness appears as a balanced measure which combines
traffic importance with topological centrality, leading to a more
uniform geographical distribution of the most important nodes.
IV Vulnerability of weighted networks
IV.1 Damage Characterization
The example of the WAN enables us to raise several questions concerning the vulnerability of weighted networks. The analysis of complex networks robustness has indeed been largely investigated in the case of unweighted networks barabasi00 ; havlin01 ; newman00 ; holme02 . In particular, the topological integrity of the network has been studied, where is the size of the largest component after a fraction of vertices has been removed and is the size of the original (connected) network. When , the entire network has been destroyed 222Since the topological integrity focuses only on the largest component and overlooks the connectivity of smaller components, one can also monitor the average inverse geodesic length, also called efficiency crucitti .
Damage is generally studied for increasingly larger fractions of removed nodes in the network, where the latter are chosen following different strategies. Heterogeneous networks with a scale-free degree distribution are robust to situations in which the damage affects nodes randomly. On the other hand, the targeted destruction of nodes following their degree rank is extremely effective, leading to the total fragmentation of the network at very low values of havlin01 ; newman00 ; barabasi00 . Moreover, the removal of the nodes with largest betweenness typically leads to an even faster destruction of the network holme02 .
In the case of weighted networks, the quantification of the damage should consider also the presence of weights. In this perspective, the largest traffic or strength still carried by a connected component of the network is likely an important indicator of the network’s functionality. For this reason, we define new measures for the network’s damage
| (6) |
where , and
are the total strength, outreach
and distance strength in the undamaged network and
,
and
correspond to the largest strength, outreach or distance strength
carried by any connected component in the network, after
the removal of a density of nodes. These quantities measure
the integrity of the network with respect to either
strength, outreach or distance strength, since they refer to the
relative traffic or flow that is still handled in the largest operating
component of the network.
IV.2 Variable-ranking attack strategies
In order to evaluate the vulnerability of the air-transportation network WAN, we study the behavior of damage measures in the presence of a progressive random damage and of different attack strategies. Similarly to the simple topological case, weighted networks are inherently resilient to random damages. Even at a large density of removed nodes, and all integrity measures decrease mildly and do not seem to have a sharp threshold above which the network is virtually destroyed. This is in agreement with the theoretical prediction for the absence of a percolation threshold in highly heterogeneous graphs havlin01 ; newman00 . Very different is the scenario corresponding to the removal of the most central nodes in the network. In this case, however, we can follow various strategies based on the different definitions for the centrality ranking of the most crucial nodes: nodes can indeed be eliminated according to their rank in terms of degree, strength, outreach, distance strength, topological betweenness, and weighted betweenness. In addition, we consider attack strategies based on a recursive re-calculation of the centrality measures on the network after each damage. This has been shown to be the most effective strategy holme02 , as each node removal leads to a change in the centrality properties of the other nodes. Such procedure is somehow akin to a cascading failure mechanism in which each failure triggers a redistribution on the network and changes the next most vulnerable node.
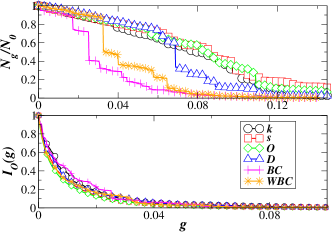
In Fig. 2 we report the behavior of and of the outreach integrity for all cases. As expected, all strategies lead to a rapid breakdown of the network with a very small fraction of removed nodes. More precisely, the robustness level of the network depends on the quantity under scrutiny. First, the size of the giant component decreases faster upon removal of nodes which are identified as central according to global (i.e. betweenness) properties, instead of local ones (i.e. degree, strength), showing that, in order to preserve the structural integrity of a network, it is necessary to protect not only the hubs but also strategic points such as bridges and bottle-neck structures. Indeed, the betweenness, which is recomputed after each node removal is the most effective quantity in order to pin-point such nodes holme02 . The weighted betweenness combines shortest paths and weights and leads to an intermediate result: some of the important topological bridges carry a small amount of traffic and are therefore part of more shortest paths than weighted shortest paths. These bridges have therefore a lower rank according to the weighted betweenness. The weighted betweenness is thus slightly less efficient for identifying bridges. Finally, we note that all locally defined quantities yield a slower decrease of and that the removal of nodes with the largest distance strength is rather effective since it targets nodes which connect very distant parts of the network.
Interestingly, when the attention shifts on the behavior of the
integrity measures, one finds a different picture in which all the
strategies achieve the same level of damage
(the curves of and present shapes very
close to the one of ). Most importantly, their
decrease is even faster and more pronounced than for topological
quantities: for
still of the order of , the integrity measures are typically
smaller than . This emphasizes how the purely topological
measure of the size of the largest component does not convey all the
information needed. In other words, the functionality of the network
can be temporarily jeopardized in terms of traffic even if the
physical structure is still globally well-connected.
This implies that weighted networks appear more fragile than thought
by considering only topological properties. All targeted strategies
are very effective in dramatically damaging the network,
reaching the complete destruction at a very
small threshold value of the fraction of removed nodes.
In this picture, the maximum damage is achieved still by strategies
based on non-local quantities such as the betweenness which lead
to a very fast decrease of both topological and traffic related
integrity measures. On the other hand, the results for the integrity
shows that the network may unfortunately
be substantially harmed also by using strategies based on
local quantities more accessible and easy to calculate.
IV.3 Single-ranking attack strategies.
The previous strategies based on a recursive re-calculation of
the centrality measures on the network are
however computationally expensive and depend
upon a global knowledge of the effect of each node removal. It is
therefore interesting to quantify the effectiveness of such a strategy
with respect to the more simple use of the ranking information
obtained for the network in its integrity. In this case the nodes are
removed according to their initial ranking calculated for the
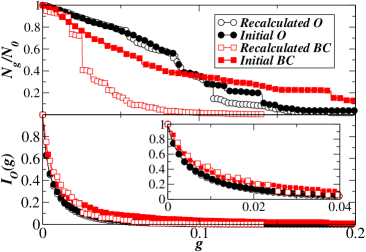
undamaged network. As shown in Fig. 3, successive
removals of nodes according to their initial outreach or BC lead to a
topological breakdown of the network which is maximized in the case
of recalculated quantities holme02 . This effect is very clear
in the case of global measures of centrality such as the betweenness
that may be altered noticeably by local re-arranegements. When traffic integrity
measures are studied, however, differences are negligible
(Fig. 3, bottom curves): a very fast
decrease of the integrity is observed for all strategies, based either
on initial or recalculated quantities. The origin of the similarity
between both strategies can be traced back by studying how much the
centrality ranking of the network vertices is scrambled during the
damage process. In order to quantify the reshuffling of the ranking
of the nodes according to various properties, we study the previously
used rank correlation as measured by Kendall’s , computed
between the rankings of the nodes according to a given property before
and after each removal. In all cases, remains very close to
, showing that the reshuffling caused by any individual removal
remains extremely limited. Slightly smaller values are observed when
we compare the rankings of the betweenness or of the weighted
betweenness. This fact can be understood since such quantities are
non-local and the betweennesses is more prone to vary when any node in
the network is removed. This evidence brings both good and bad news
concerning the protection of large scale infrastructures. On one hand,
the planning of an effective targeted attack does need only to gather
information on the initial state of the network. On the other hand,
the identification of crucial nodes to protect is an easier task that
somehow is weakly dependent on the attack sequence.
IV.4 Geographical heterogeneoity.
As shown in Fig. 1, various geographical zones contain
different numbers of central airports. The immediate consequence is
that the different strategies for node removal have different impacts
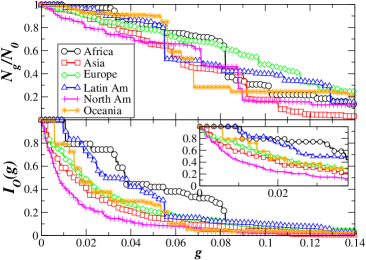
in different geographical areas. Figure 4 highlights this
point by showing the decrease of two integrity measures representative
of topological and traffic integrity, respectively. These quantities
were measured on subnetworks corresponding to the six following
regions: Africa, Asia, Europe, Latin and North America, and Oceania.
Figure 4 displays the case of a removal of nodes
according to their strength (other removal strategies lead to similar
data). While the curves of topological damage are rather intertwined,
the decrease of the different integrity measures is much faster for
North America, Asia and Europe than Africa, Oceania and Latin America;
in particular the removal of the first nodes do not affect at all
these three last zones. Such plots demonstrate two crucial
points. First, various removal strategies damage differently the
various geographical zones. Second, the amount of damage according to
a given removal strategy strongly depends on the precise measure used
to quantify the damage. More generally, these results lead to the idea
that large weighted networks can be composed by different subgraphs
with very different traffic structure and thus different responses to
attacks.
V Conclusions.
In summary, we have identified a set of different
but complementary centrality measures for weighted networks. The
various definitions of centrality are correlated but lead to different
rankings since different aspects (weighted or topological, and local
or global) are taken into account. The study of the vulnerability of
weighted networks to various targeted attack strategies shows that
complex networks are more fragile than expected from the analysis of
topological quantities when the traffic characteristics are taken into
account. In particular, the network’s integrity in terms of carried
traffic is vanishing significantly before the network is topologically
fragmented. Moreover, we have compared attacks based on initial
centrality ranking with those using quantities recalculated after each removal,
since any modification of the network (e.g. a node removal) leads to a
partial reshuffling of these rankings. Strikingly, and in contrast to the case
of purely topological damage, the integrity of the network is harmed in a very
similar manner in both cases. All these results warn about the extreme
vulnerability of the traffic properties of weighted networks and signals the
need to pay a particular attention to weights and traffic in the
design of protection strategies.
Acknowledgments
We thank IATA for making the airline commercial flight database available. A.B. and L.D. are partially supported by the EU within the 6th Framework Programme under contract 001907 “Dynamically Evolving, Large Scale Information Systems” (DELIS).
References
- (1) A.-L. Barabási, A.-L. and R. Albert, Rev. Mod. Phys. 74, 47-97 (2002).
- (2) S. N. Dorogovtsev and J. F. F. Mendes, Evolution of Networks: from biological nets to the Internet and WWW (Oxford University Press, Oxford 2003).
- (3) R. Pastor-Satorras and A. Vespignani, Evolution and structure of the Internet: A statistical physics approach (Cambridge University Press, Cambridge, 2004).
- (4) L.A.N. Amaral, A. Scala, M. Barthélemy, and H.E. Stanley, Proc. Nat. Acad. Sci. USA 97, 11149 (2000).
- (5) Watts D. J. and Strogatz S. H., Nature 393, 440 (1998).
- (6) A. Barrat, M. Barthélemy, R. Pastor-Satorras, and A. Vespignani, Proc. Natl. Acad. Sci. USA 101, 3747 (2004).
- (7) E. Almaas, B. Kovács, T. Viscek, Z. N. Oltvai and A.-L. Barabási, Nature 427, 839 (2004).
- (8) W. Li and X. Cai, Phys. Rev. E 69, 046106 (2004).
- (9) A. Barrat, M. Barthélemy, and A. Vespignani, Phys. Rev. Lett., 92, 228701 (2004).
- (10) A. Barrat, M. Barthélemy, and A. Vespignani, Phys. Rev. E 70, 066149 (2004).
- (11) G. Bianconi, Europhys. Lett. 71, 1029 (2005).
- (12) S. N. Dorogovtsev and J. F. F. Mendes, cond-mat/0408343.
- (13) W.-X. Wang, B.-H. Wang, B. Hu, G. Yan and Q. Ou, Phys. Rev. Lett. 94, 188702 (2005).
- (14) R. Cohen, K. Erez, D. ben-Avraham, and S. Havlin, Phys. Rev. Lett. 85, 4626 (2000);
- (15) D. S. Callaway, M. E. J. Newman, S. H. Strogatz, and D. J. Watts, Phys. Rev. Lett. 85, 5468 (2000).
- (16) R. A. Albert, H. Jeong and A.-L. Barabási, Nature 406, 378 (2000).
- (17) R. Pastor-Satorras, and A. Vespignani, Phys. Rev. Lett. 86, 3200 (2001).
- (18) R. Guimerà, S. Mossa, A. Turtschi, and L.A.N. Amaral, Proc. Natl. Acad. Sci. USA 102, 7794 (2005).
- (19) R. Guimerà, and L.A.N. Amaral, Eur. Phys. J. B 38, 381-385 (2004).
- (20) J. Clark and D.A. Holton, A first look at graph theory, World Scientific, Second reprint 1998.
- (21) A. Barrat, M. Barthélemy, and A. Vespignani, J. Stat. Mech. (2005) P05003.
- (22) S.H. Yook, H. Jeong, A.-L. Barabasi and Y. Tu Physical Review Letters 86, 5835 (2001).
- (23) L. Freeman, Sociometry, 40, 35 (1977).
- (24) Numerical recipes in Fortran, W.H. Press, B.P. Flannery, S.A. Teukolsky, W.T. Vetterling, Cambridge University Press, 2nd Edition 1992.
- (25) P. Holme, B. J. Kim, C. N. Yoon, S. K. Han Phys. Rev. E 65, 056109 (2002).
- (26) U. Brandes, Journal of Math. Sociology, 25, 35 (2001).
- (27) E.W. Dijkstra, Numer. Math. 1, 269 (1959).
- (28) V. Latora and M. Marchiori, Phys. Rev. Lett. 87, 198701 (2001).