Wavelet analysis of event by event fluctuations
Abstract
The temporal fluctuations of produced hadron density in heavy ion collisions, modelled by 2D Ising model at temperatures and below, are studied through a recently developed wavelet based fluctuation analysis method. At , long-range correlated multifractal behavior, matching with the recently observed Hurst exponent , is found. Below uncorrelated monofractal behavior is seen. The correlation behavior compares well with the results obtained from continuous wavelet based average wavelet co-efficient method, as well as with Fourier power spectral analysis.
pacs:
05.40.-a, 05.45.Tp, 24.60.KyI Introduction
The study of correlations and scaling behavior is an area of active research mandel . Various methods of analysis like rescaled range analysis hur , structure function feder , wavelet transform modulus maxima arn1 , detrended fluctuation analysis and its variants are used to study the correlation behavior and fractal characteristics gopi ; ple ; khu ; chen ; matia ; krs ; phand ; xu . Recently, we have developed a new method based on discrete wavelet transform to study the scaling properties of non-stationary time series mani2 . This procedure economically extracts the multifractal behavior in a time series. It has been applied to characterize current and voltage fluctuations in tokamak plasma and financial time series mani1 .
The goal of the present work is to apply this discrete wavelet based approach for the study of event by event fluctuations of hadron density produced during phase transition. The fact that, our method is a local one, makes it ideal for the analysis of fluctuations in a non-stationary data. The primary motivation for this work is the recent study of the event by event fluctuations of hadron multiplicities, carried out by Qin and Ta-chung, liu1 ; liu2 using rescaled range analysis, which has shown scaling behavior. The Hurst exponent , has been found to be . The geometry of the hadronization scenario in the context of heavy ion collisions, with two flavors, has led to the description of the same through a model like two dimensional (2D) Ising model. Hwa and co-workers have analyzed the scaling behavior of hadronic fluctuations through various methods like moment analysis etc., in the context of the above model hwa0 ; hwa1 ; hwa2 ; hwa3 .
A large number of studies have been done to analyze the characteristic behavior of hadron formation during quark hadron phase transition. Earlier studies regarding the fluctuations in particle production, like correlation analysis of hadronic fluctuations have been carried out using cluster expansion technique of Ursell and Mayer urs . Bialas and Peschanski have studied multiparticle production during quark hadron phase transition through factorial moment analysis bia . Using statistical methods, Ludlam and Slansky studied the mechanism of particle production during quark hadron phase transition lud .
Following Hwa et. al. hwa2 , we have carried out the Monte-Carlo simulation of 2D Ising model to mimic the multi-particle production during quark hadron phase transition. The time series of event by event fluctuations of average hadron densities below and at phase transition have been measured for characterization. The spatio-temporal fluctuations of produced hadrons show correlation behavior which have been characterized using wavelet transform techniques. We have made use of discrete and continuous wavelet transforms to analyze the hadronic fluctuations at various temperatures below and at critical temperature. We also study the scaling behavior through power spectral analysis.
Wavelet transform is a mathematical tool which finds applications in various fields, ranging from finance meg ; mani1 , biology pkp1 ; pkp2 , to chemistry chu , and physics arn1 ; ding ; mani0 etc. Wavelet transform decomposes any given function or data in a manner, which achieves optimal time-frequency localization. Wavelets are classified into discrete and continuous ones daub ; mall . We have made use of both the methods to analyze the fluctuations in this paper. In case of discrete wavelet analysis, we have used an approach which has been developed recently mani2 . Average wavelet coefficient method, a continuous wavelet approach as well as Fourier analysis are also used to study the correlation behavior of the fluctuations and corroborate our findings.
This paper is organized as follows. Section II deals with hadron density as computed from the Ising model. In Section III, discrete wavelet analysis of time series has been carried out for extracting multifractal behavior. In section IV, continuous wavelet analysis and Fourier power spectral analysis have been implemented to support the previous discrete wavelet transform approach. Section V concludes with discussions and future directions of work.
II Hadron density and the Ising model
In the context of heavy ion collisions, a two dimensional geometry can be invoked, where 2D Ising model captures the dynamics of the phase transition in a two flavor scenario. Earlier studies by Hwa et.al., hwa2 describe in detail the relationship between hadron density and the 2D Ising model. In this paper, we adopt the same procedure and deal with the correlation analysis and fractal characteristics through wavelet transforms. We have studied the hadronic fluctuations using both discrete and continuous wavelet transform as a time series analysis.
The two dimensional Ising model is defined by the Hamiltonian,
| (1) |
where takes the values and the sum is over the nearest neighbors. In our Monte-Carlo simulation of 2D Ising model landau , we use Wolff single cluster algorithm wolff for spin flipping in a configuration of a lattice size . We define the cell size to be with and the whole lattice is subdivided into cells. The hadron density at a particular cell is defined by
| (2) |
where is the net spin at cell defined to be positive along the overall magnetization, i.e.,
| (3) |
is the cell block of size located at , is the Heaviside function and is a constant. During the hadronization process fluctuates from cell to cell, which reflects in the average hadron density in event to event. The average density is calculated as;
| (4) |
Here, denotes the cells and is the configurations captured, where is the number of events simulated. We have calculated the equilibrium time series of the average hadron density over x iterations.
III Wavelet based fluctuation analysis
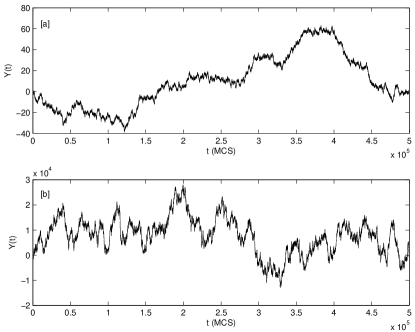
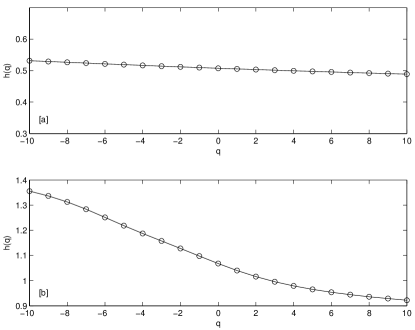
Considering the time series of average hadron density () from , we capture configurations at various temperatures like below, and at critical temperature. In most applications, the index will correspond to the time of the measurements. The profile () of the time series is obtained by subtracting the mean and taking cumulative sum of the average hadron density. The profiles have been analyzed by the wavelet based fluctuation analysis method to study the scaling behavior mani2 . We calculate the scaling exponents for various moments , in this case varies from to . For , is the Hurst exponent, which is one of the measures of correlation behavior in the time series analysis: . For persistent time series , for uncorrelated time series and for anti-persistent behavior. Recently, the anti-persistent regime has been mapped to statistics, widely employed in random matrix theory santh . The main aim here is to study the fractal characteristics of the time series and its multifractal nature. For the time series possessing multi-fractal behavior, decreases with increasing values of . For mono-fractal time series is constant for all values of . Fig. 1 depicts the profile of the time series of event by event fluctuations of average hadron density, [a] below , and [b] at .
We use a discrete wavelet based fluctuation analysis method (which is analogous to multifractal detrended fluctuation analysis method) to study the existence of scaling behavior of the time series. Our earlier paper gives the detail procedure of this approach mani2 . The fluctuations are extracted using a wavelet (Db-8) from Daubechies family. The fluctuation function is obtained for various scales . The power law manifests itself as a straight line in the log-log plot of versus , for each value of .
| (5) |
From the analysis of hadron density time series, below , uncorrelated monofractal behavior and long-range correlated multifractal behavior at are found. These results are shown in Fig. . It was found that the Hurst exponent matches with that of Qin et. al. liu. Very interestingly, multifractal behavior is clearly seen for event by event fluctuations at .
IV Average wavelet coefficient method
We now make use of average wavelet coefficient method to corroborate the above findings. This is a continuous wavelet based approach, which has been used to study the temporal correlations of the fluctuations in time series. We obtain the Hurst measure by transforming the time series, into wavelet domain. The continuous wavelet transform of a function is given by
| (6) |
where the mother wavelet is defined as,
| (7) |
Here is the scaling parameter and is the translation parameter and is the complex conjugate of .
It has been shown that awc ,
| (8) |
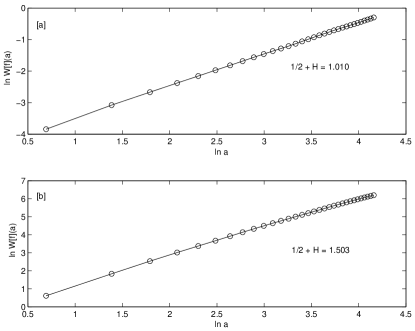
At a given scale, the wavelet energy of all locations have been averaged yielding . The same averaging is followed for all scales. Thus for a self-affine time series, the scaling exponent () is measured from the slope of the log-log plot of versus scale . The results are shown in Fig. 3. They clearly indicate that the fluctuations possess self-affine nature and the Hurst exponent is the measure of correlation. From the obtained , we found that the hadronic fluctuations are uncorrelated below () and at it possesses long-range correlation (). This matches with our previous discrete wavelet analysis.
We have also analyzed the scaling behavior through Fourier power spectral analysis,
| (9) |
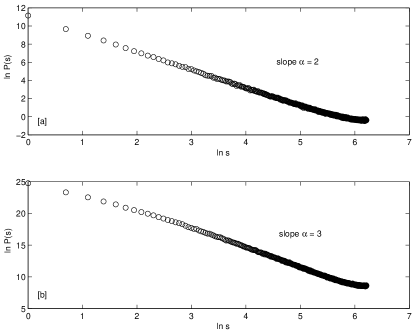
Here is the accumulated fluctuations after subtracting the mean . It is well known that, . The obtained scaling exponent is compared with Hurst exponent by the relation . For the time series far below from , the scaling exponent which reveals uncorrelated Brownian motion behavior and at , the scaling exponent , which reveals long range correlated fractional Brownian motion behavior as shown in Fig. 4.
V Conclusion
We have found that the event by event fluctuations of hadron density, as modelled by 2D Ising spins, possess long-range correlated multifractal and fractional Brownian motion behavior at . This is due to the correlation arising from phase transition. Uncorrelated monofractal and Brownian motion behavior below is observed as per physical expectations. The analysis has been carried out through discrete wavelet wavelet based fluctuation analysis method, which is well suited for non-stationary data. The continuous wavelet based average wavelet coefficient method and Fourier analysis fully supported the above conclusion.
We thank Prof. J. C. Parikh and M. S. Santhanam for useful discussions.
References
- (1) B. B. Mandelbrot, The Fractal Geometry of Nature (Freeman, San Francisco, 1999).
- (2) H. E. Hurst, Trans. Am. Soc. Civ. Eng. 116 770 (1951).
- (3) J. Feder, Fractals (Plenum Press, New York, 1988).
- (4) A. Arneodo, G. Grasseau, and M. Holshneider, Phys. Rev. Lett. 61, 2281 (1988); J. F. Muzy, E. Bacry, and A. Arneodo, Phys. Rev. E 47, 875 (1993).
- (5) P. Gopikrishnan, V. Plerou, L. A. N. Amaral, M. Meyer, and H. E. Stanley, Phys. Rev. E 60, 5305 (1999).
- (6) V. Plerou, P. Gopikrishnan, L. A. N. Amaral, M. Meyer, and H. E. Stanley, Phys. Rev. E 60, 6519 (1999).
- (7) K. Hu, P. Ch. Ivanov, Z. Chen, P. Carpena, and H. E. Stanley, Phys.Rev. E 64, 11114 (2001).
- (8) Z. Chen, P. Ch. Ivanov, K. Hu, and H. E. Stanley, Phys. Rev. E 65, 041107 (2002).
- (9) K. Matia, Y. Ashkenazy, and H. E. Stanley, Europhys. Lett. 61, 422 (2003).
- (10) R. C. Hwa, C.B. Yang, S. Bershadskii, J.J. Niemela, and K. R. Sreenivasan, Phys. Rev. E 72, 066308 (2005).
- (11) K. Ohashi, L. A. N. Amaral, B. H. Natelson, and Y. Yamamoto, Phys. Rev. E. 68, 065204(R) (2003).
- (12) L. Xu, P. Ch. Ivanov, K. Hu, Z. Chen, A. Carbone, and H.E. Stanley, Phys. Rev. E 71, 051101 (2005).
- (13) P. Manimaran, P. K. Panigrahi, and J. C. Parikh, eprint: nlin.CD/0601065;
- (14) P. Manimaran, P. K. Panigrahi, and J. C. Parikh, eprint: nlin.CD/0601074.
- (15) L. Qin, and M. Ta-chung, Phys. Rev. D 69, 054026 (2004).
- (16) L. Qin, and M. Ta-chung, Phys. Rev. D 72, 014011 (2005).
- (17) R. C. Hwa, and Y. Wu, Phys. Rev. C 60, 0544904 (1999).
- (18) F. Karsch, Quark-Gluon Plasma, edited by R. C. Hwa (World Scientific, Singapore, 1990).
- (19) M. R. Young, Y. Qu, S. Singh, and R. C. Hwa, Opt. Commun. 105, 325 (1994).
- (20) Z. Cao, and R. C. Hwa, Phys. Rev. E 56, 326 (1997).
- (21) H. D. Ursell, Proc. Cambridge Philos. Soc. 23, 685 (1927); J. E. Meyer, and M. G. Mayor, Statistical Mechanics (John Wiley, New York, 1940).
- (22) A. Bialas, and R. Peschanski, Nucl. Phys. B273, 703 (1986).
- (23) T. Ludhan, and R. Slansky, Phys. Rev. D 8, 1408 (1973); T. Ludhan, and R. Slansky, Phys. Rev. D 12, 59 (1975).
- (24) M. B. Porecha, P. K. Panigrahi, J. C. Parikh, C. M. Kishtawal, and S. Basu, eprint: nlin.CD/0507037.
- (25) N. Agarwal, S. Gupta, Bhawna, A. Pradhan, K. Vishwanathan, and P. K. Panigrahi, IEEE J. Sel. Top. Quantum Electron, 9, 154 (2003).
- (26) S. Gupta, M. S. Nair, A. Pradhan, N. C. Biswal, N. Agarwal, A. Agarwal, and P. K. Panigrahi, J. Biomed. Optics 10, 054012 (2005).
- (27) G. N. Chueva, and M. V. Fedorov, J. Chem. Phys. 120, 1191 (2003).
- (28) Y. Ding, T. Nanba, and Y. Miura, Phys. Rev. B 58, 14279 (1998).
- (29) P. Manimaran, P. K. Panigrahi, and J. C. Parikh, Phys. Rev. E 72, 046120 (2005).
- (30) I. Daubechies, Ten Lectures on Wavelets (SIAM, Philadelphia, PA, 1992); G. Kaiser, A Friendly Guide to Wavelets (Birkhäuser, Boston, 1994).
- (31) S. Mallat, A Wavelet Tour of Signal Processing (Academic Press, 1999).
- (32) D. P. Landau and K. Binder, A guide to Monte Carlo simulations in statistical physics (Cambridge University Press, UK, 2000).
- (33) U. Wolff, Phys. Rev. Lett. 62, 361 (1989).
- (34) M. S. Santhanam, J. N. Bandyopadhyay, and D. Angom Phys. Rev. E 73, 015201 (2006).
- (35) I. Simonsen, A. Hansen, and O.-M. Nes, Phys. Rev. E 58, 2779 (1998).