Comment on “Nuclear Emissions During Self-Nucleated Acoustic Cavitation”
In a recent Letter Taleyarkhan et al. (2006), Taleyarkhan and coauthors claim to observe DD fusion produced by acoustic cavitation. Among other evidence, they provide a proton recoil spectrum that they interpret as arising from 2.45 MeV DD fusion neutrons. My analysis concludes the spectrum is inconsistent with 2.45 MeV neutrons, cosmic background, or a Be source, but it is consistent with a source.
Figure 1(a) shows the detector’s pulse height spectra of two calibration sources, as extracted from Fig. 8 of the Letter’s supplement tal . I use Geant4 Agostinelli et al. (2003) to simulate the detector’s electron recoil spectra, which are then convolved with a gaussian resolution function and scaled to fit the measured spectra Dietze and Klein (1982). The two fits, showing excellent agreement with the data, validate the method and provide parameters for the detector’s light output function and resolution Birks (1964) .
As described in the supplementary methods sup , I simulate proton recoil spectra for the four separate cases. In the two limiting cases of 2.45 MeV neutron emission—no shielding and heavy shielding—the detector is placed 30 cm from the quartz flask containing the cavitation fluid. The two radioisotope simulations assume there are no intervening scattering materials. These techniques were used to accurately model a DD fusion proton recoil spectrum in Ref. Naranjo et al. (2005).
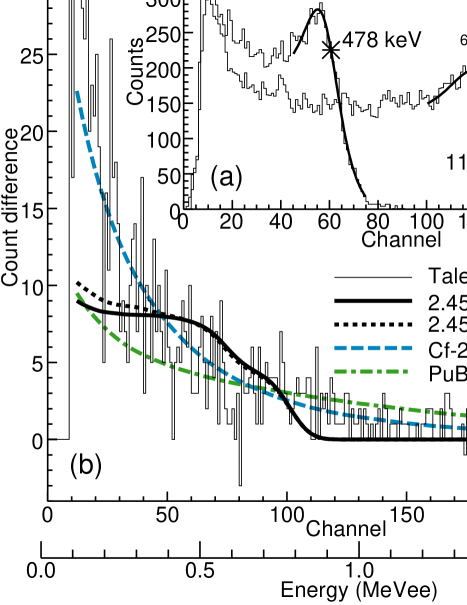
Figure 1(b) shows the simulated spectra, fit to data extracted from Fig. 4 of the Letter. As described in the supplementary methods, the fit is performed simultaneously over the raw cavitation ‘on’ and cavitation ‘off’ data, extracted from Fig. 9(b) of the supplement. The variable of Ref. Baker and Cousins (1984) determines both the best fit parameters and the goodness-of-fit.
The fit results, summarized in Table 1, show the data are statistically consistent with , since the observed value of is within one standard deviation of the mean. In contrast, the observed values of for the remaining cases are more than five standard deviations beyond the mean, and, consequently, the data are statistically inconsistent with DD fusion or a PuBe source.
| Z-value | ||
|---|---|---|
| 2.45 MeV | 653 | 5.9 |
| 2.45 MeV w/ shielding | 637 | 5.5 |
| Cf-252 | 432 | -0.45 |
| PuBe | 621 | 5.9 |
Comparing the shapes of the spectra in Fig. 9(b) of Ref. tal rules out the possibility of cavitation ‘on’ runs being longer than cavitation ‘off’ runs. Calling channels ten and below the ‘peak’ and channels eleven and above the ‘tail’, the ratio of tail to peak counts with cavitation off is . When cavitation is on, the tail becomes more pronounced so that the ratio is .
Acknowledgements.
I thank S. Putterman for valuable discussions. This work is supported by DARPA. B. NaranjoUCLA Department of Physics and Astronomy
Los Angeles, California 90095, USA
September 5, 2006
PACS numbers: 78.60.Mq, 25.45.-z, 28.20.-v, 28.52.-s
References
- Taleyarkhan et al. (2006) R. P. Taleyarkhan, C. D. West, R. T. Lahey, Jr., R. I. Nigmatulin, R. C. Block, and Y. Xu, Phys. Rev. Lett. 96, 034301 (2006).
- (2) EPAPS Document No. E-PRLTAO-96-019605.
- Agostinelli et al. (2003) S. Agostinelli et al., Nucl. Instr. and Meth. A 506, 250 (2003).
- Dietze and Klein (1982) G. Dietze and H. Klein, Nucl. Instr. and Meth. 193, 549 (1982).
- Birks (1964) J. B. Birks, The theory and practice of scintillation counting (Pergamon Press, Oxford, 1964).
- (6) See EPAPS Document No. XXX for complete description of Monte Carlo and statistical methods. For more information on EPAPS, see http://www.aip.org/pubservs/epaps.html.
- Naranjo et al. (2005) B. Naranjo, J. K. Gimzewski, and S. Putterman, Nature 434, 1115 (2005).
- Baker and Cousins (1984) S. Baker and R. D. Cousins, Nucl. Instr. and Meth. 221, 437 (1984).