Flow channelling in a single fracture induced by shear displacement
Abstract
The effect on the transport properties of fractures of a relative shear displacement of rough walls with complementary self-affine surfaces has been studied experimentally and numerically. The shear displacement induces an anisotropy of the aperture field with a correlation length scaling as and significantly larger in the direction perpendicular to . This reflects the appearance of long range channels perpendicular to resulting in a higher effective permeability for flow in the direction perpendicular to the shear. Miscible displacements fronts in such fractures are observed experimentally to display a self affine geometry of characteristic exponent directly related to that of the rough wall surfaces. A simple model based on the channelization of the aperture field allows to reproduces the front geometry when the mean flow is parallel to the channels created by the shear displacement.
keywords:
1 Introduction
The geothermal reservoir of Soultz-sous-Forêts, like most geological systems, contains fracture networks providing preferential paths for fluid flow and identifying these paths is crucial in geothermal applications. More precisely, the number of hydraulically connected fractures and their spatial distribution are key factors in determining the rate at which hot water can be produced or fluids can be re-injected into the system (Genter et al, 1997; Dezayes et al, 2004). Transport in these systems can be stimulated by the massive injection of water at high flow rates which is commonly used to increase the overall transmissivity : both borehole and microseismic observations have demonstrated that the relative shearing of the fracture walls is a key factor in this enhancement (Genter et al, 1997; Evans et al, 2005). Another important issue is the influence of the shear on the transport of suspended particles and dissolved species.
The present work analyzes the influence of shear displacements of the fracture walls on the pore space structure and, therefore, on the transport properties. The case of fractures with a self-affine geometry is specifically investigated : this statistical model describes indeed successfully a broad variety of fractured materials (see Bouchaud (2003) for a review). This model which will be described more precisely in section 3 accounts also well for the long range correlations in the topography of such surfaces.
An important factor in these processes is the anisotropy of the permeability field induced by the shear displacement of the fracture walls : the permeability is highest for flow perpendicular to the shear displacement vector and lowest along it (Gentier et al., 1997; Yeo et al., 1998). This anisotropy has been suggested by Auradou et al (2005) to be associated to the appearance, in the aperture field, of ridges perpendicular to . These ridges partly inhibit flow parallel to while they create long preferential flow channels connected in series in the perpendicular direction : this leads to model the pore space as long parallel channels extending over the length of the fracture. In the present work, the validity of this simple description of the void space will be confirmed by a detailed study of the geostatistical characteristics of the aperture field. It will be shown that both the anisotropy of the aperture field and the presence of large scale surface structures spanning the whole surface are needed to account for the anisotropy.
These analysis will then be extended to the spreading of a tracer advected by the flow. This process is largely determined by the structure of the flow field which would, at first, seem to be very complex. However, both experimental studies (Auradou et al, 2001) and numerical simulations (Drazer et al, 2004) suggest that, for shear displacements small compared to the fracture size and for flow perpendicular to , the flow lines are mostly parallel to the mean flow the velocity field remains correlated over distances of the order of the fracture length. Finally, the correlation of the velocities of tracer particles advected in the fracture will be shown to have also self-affine characteristics, and a model accounting for the geometry of miscible displacement fronts in such fractures will be presented.
2 Experimental setup and numerical models
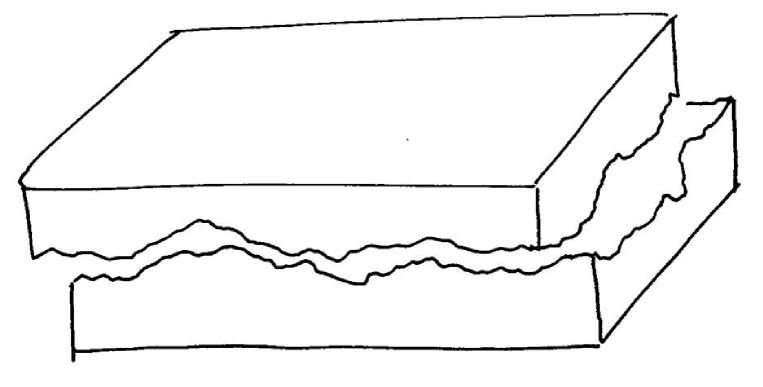
Both in the experiments and the numerical simulations, the fractures are modeled as the gap between two complementary rough surfaces, as shown in Fig. 1. Experimentally, these surfaces are transparent casts of granite or fracture surfaces that retain their self affine geometry. The experimental setup allows us to control both the normal distance and the lateral displacement between the two facing wall surfaces (a detailed description has been given by Auradou et al (2001, 2005) ). The normal distances investigated range from to , i.e. of the same order of magnitude as the mean aperture of fractures in the Soultz Geothermal reservoir (Sausse, 2002). The lateral displacement mimics a relative shear displacement of the walls and induces spatial variations of the aperture. The magnitude of the shear displacements ranges from zero (no shear configuration) to a few millimeters when the lateral displacement brings the opposite surfaces in contact. The shear displacement amplitudes are of the same order of magnitude than those estimated by Evans et al (2005) after an hydraulic stimulation. The resulting aperture fluctuations are also similar to those reported by Sausse (Sausse, 2002) for fractures in the Soultz reservoir.
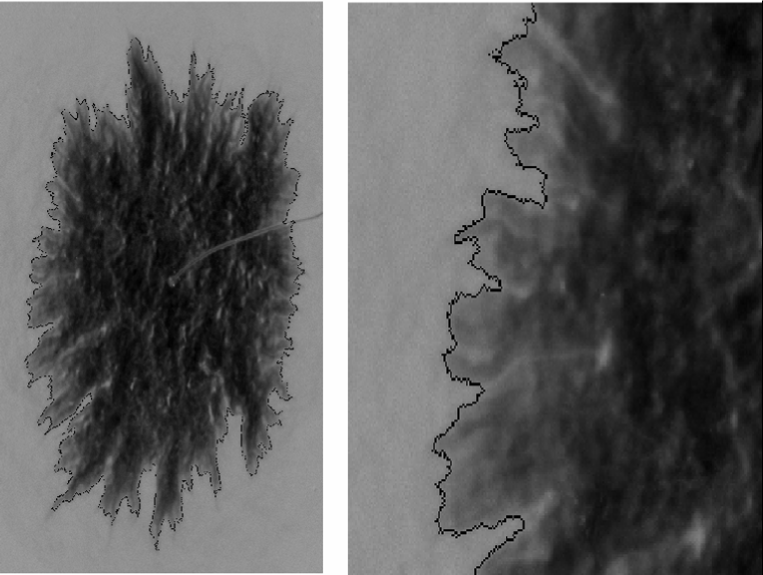
The fracture model is fitted inside a parallelepipedic basin : both are initially carefully saturated with a transparent solution so that no air bubble gets trapped inside the setup. The same solution, but dyed, is then injected through a small borehole in the middle of the upper epoxy cast and pictures of the dye invasion front are obtained at regular time intervals. Figure 2 displays a typical invasion front geometry : its larger elongation in the direction perpendicular to the shear reflects the influence of the permeability anisotropy discussed above. Moreover, as discussed by Auradou et al (2005), the ratio of the elongations of the front parallel and perpendicular to the shear is directly related to the ratio of the permeabilities along these two same directions.
As mentioned above, aperture variations due to the lateral displacement of the fracture walls strongly perturb the flow field. The numerical simulation of the above experiments requires therefore an accurate 3D description of the fracture geometry and of the velocity field : the lattice Boltzmann technique has been selected for that purpose because it is well adapted to complex geometries (Drazer and Koplik, 2000, 2002). A large cubic lattice ( sites) is used to reproduce a model fracture of mean aperture and area (one fourth of the experimental area). Using these numerical simulations, the variability of the results from one fracture to another has been investigated and the permeabilities for flow both parallel and perpendicular to the shear direction have been determined (note that only their ratio can be measured experimentally).
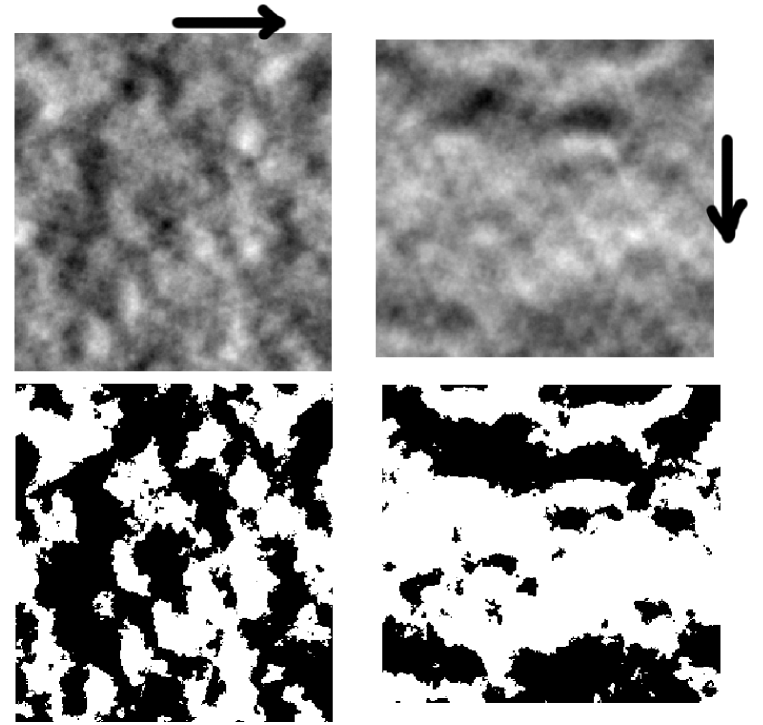
Figure 3 compares aperture fields obtained in numerical simulations and corresponding to relative displacements of the same complementary surfaces in two directions at right angle. Permeability values computed in these two cases for constant pressure gradients parallel and perpendicular to the shear are listed in the caption. One observes the appearance of near continuous streaks perpendicular to the shear displacement and marking preferential flow paths. The appearance of these paths is reflected in the difference between the permeabilities and for flow respectively parallel and perpendicular to them. More precisely, the permeability for flow perpendicular to the displacement increases with while decreases. These variations are observed (Auradou et al, 2005) to be related to the permeability for and to the ratio of the variance of the aperture fluctuations, by the mean aperture, through the approximate equations :
| (1) |
The two constants, and , depend on the specific statistical properties of each individual fracture surfaces but satisfy the relations: and .
As stated above, the binarized aperture fields shown in Fig. 3 displays ridges perpendicular to the dispacement and extending over a large part of the fracture length parallel to the flow. This observation has been used as the basic ingredient of a simple model in which the aperture field is replaced by a set of parallel channels, each of constant aperture and perpendicular to the shear. This model captures the linear dependence of the permeabilities with respect to and gives a good estimate of the respective upper and lower bounds of and (Zimmerman et al, 1991; Zimmerman and Bodvarsson, 1996; Auradou et al, 2005). These two limits correspond to and in Eq. (1). This simple model takes advantage of the fact that the correlation lengths in the aperture field are highly anisotropic and much smaller parallel to than perpendicular to it.
In addition to its global anisotropy, the experimental pictures displayed in Figure 2 show that the front between the transparent and dyed fluids is locally quite tortuous. More precisely, its geometry has been found experimentally to be self-affine with a characteristic exponent close to that of the roughness of the fracture surfaces (Auradou et al, 2001). This result has been verified numerically by Drazer et al (2004) for two values and of the characteristic exponent (Feder, 1988) of the fracture wall surfaces (note that has the same ”universal” value for the basalt and granite surfaces modeled in the present work and its influence could not therefore be investigated experimentally).
The spatial correlation of the aperture and velocity fields in these fractures will now be analyzed more quantitatively using standard geostatistical tools. A model based on these caracteristics will then be discussed in section 4 and shown to capture the key features of miscible displacement processes studied experimentally and numerically.
3 Spatial correlation of the aperture field
The following interpretations are realized on 2D maps with pixels measured experimentally on the epoxy surfaces by a mechanical profilometer; the spacing between pixels is in both directions of the mean plane of the fracture and the vertical resolution on the local height is . The statistical properties of the surface roughness have determined from these maps and, as stated above, can be characterized in terms of a self-affine geometry. The main property of a self-affine surface is that it remains statistically unchanged under the transformation :
Where are the coordinates in the mean surface plane, is the local height of the surface and is refered to as the Hurst, roughness, or self-affine exponent (Feder, 1988). For the experimental model fractures, one has (Auradou et al, 2005), in agreement with published values for granite surfaces (Bouchaud, 2003). In the simulations, the self-affine surfaces are generated numerically (see Drazer and Koplik (2002) for a detailed description of the method).
In the present work, we consider fractures made of complementary walls that are separated both vertically in order to open the fracture and laterally in order to mimic shear displacements (if any). Under such conditions, if is the mean aperture and the relative shear displacement in the plane of the fracture, the local aperture at a point satisfies :
| (2) |
This equation allows to determine the aperture field for a given shift from the experimental surface profile map . The correlations in the aperture field are characterized by the following correlation function, also called semivariance (Kitanidis, 1997):
| (3) |
which measures the spatial correlation of the aperture field between two points separated by the 2D vector .
Combining Eqs. 2 and 3, one sees that the value of is determined by the correlation between the heights of the surface at four points located at the corners of a parallelogram of sides and . The orientations of the lag respectively parallel and perpendicular to the shear displacement are of special interest (in the following, they are respectively referred to as and ).
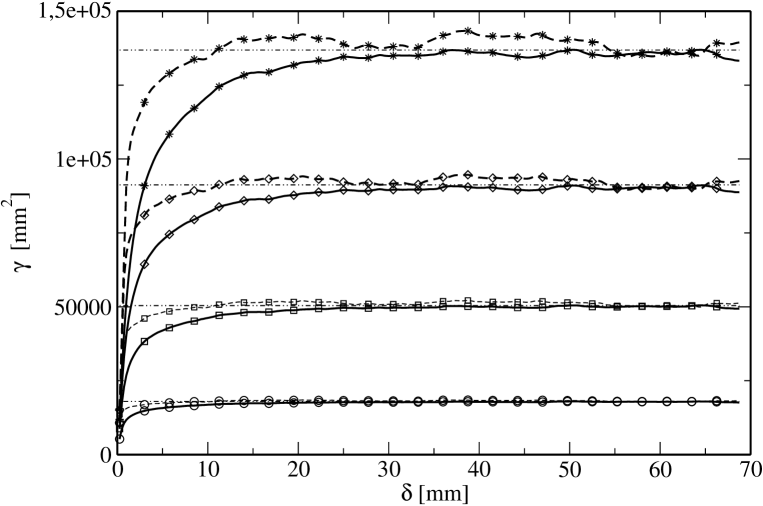
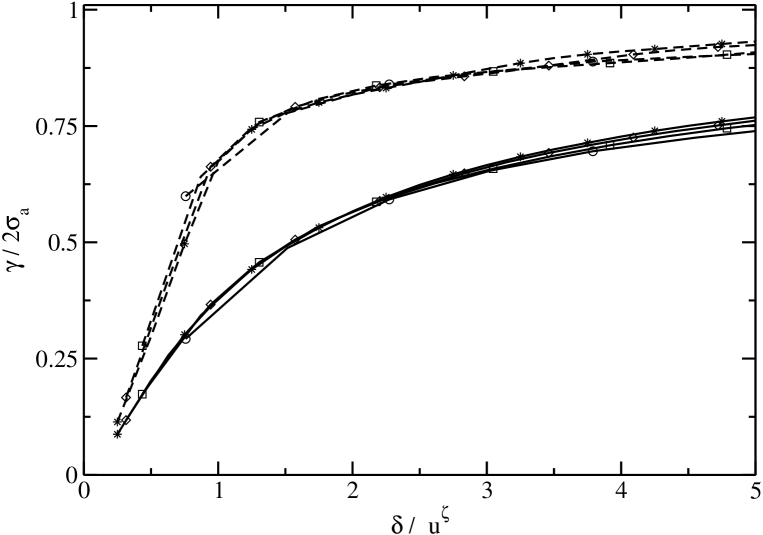
Figure 4 displays variations with of the semivariances and for aperture fields computed from a same experimental surface profile map but for different shear displacements . For small values of the lag , the apertures at and are very similar (high spatial correlation at short distances) and the value of is low. As increases, so does because the correlation decreases. As increases further to a value higher than the correlation length of the aperture field, the apertures at and become uncorrelated; then, from Eq. (3), and should reach a same constant saturation value equal to twice the aperture variance . The values of corresponding to the different shear amplitudes are plotted as horizontal dashed lines on Fig. 4 : they represent indeed the limit of both and at high values. Also, as previously shown by Auradou et al (2005), increases with the magnitude of the shear displacement : in the range of values used in Fig. 4, one verifies experimentally that with a best fit corresponding to and .
Even though the limits of and are the same at large values for a given shear displacement , the way in which this saturation is reached differs very much for the two semivariances due to the anisotropy of the aperture field. The semivariance for perpendicular to never exceeds its saturation value and reaches it in an overdamped way whereas ( parallel to ) displays an overshoot reflecting a local anticorrelation. These different behaviors result directly from the large scale anisotropic structures observed above on Fig. 3. Let us consider the aperture at two points separated by a small distance perpendicular to the shear displacement (and therefore parallel to the length of the structures) : they will most likely be both either above or below the average aperture if they are inside a same large scale structure. Then, the corresponding value of aperture semivariance will be less than . On the other hand, two points with a separation parallel to have a high probability to correspond to different structures of the binarized picture : some amount of anti correlation can therefore be expected.
Let us now investigate the parameters determining the variation of in the transition regime. For that purpose, we have seeked to collapse the different curves of Fig.4 onto master curves. In Fig. 5, and are normalized by which represents their limit at large values of while, for the horizontal scale, is a natural reduced coordinate (see Plouraboué et al. (1995)). These two normalizations allow indeed to collapse in Fig. 5 the different variations into two independent master curves, corresponding to the two orientations of with respect to . This demonstrates, that, in all cases, the characteristic distance over which the aperture field gets decorrelated is proportional to the shift : in addition, the ratio of this distance by is significantly larger for perpendicular to the shear than parallel to it. While this latter result will remain valid, the actual values of both distances may vary significantly from one sample to another.
Fig. 5 also shows that, for small lag values ), the semivariograms increase linearly with (). This indicates that the random field is not as smooth as in the case of a Gaussian covariance function for which .
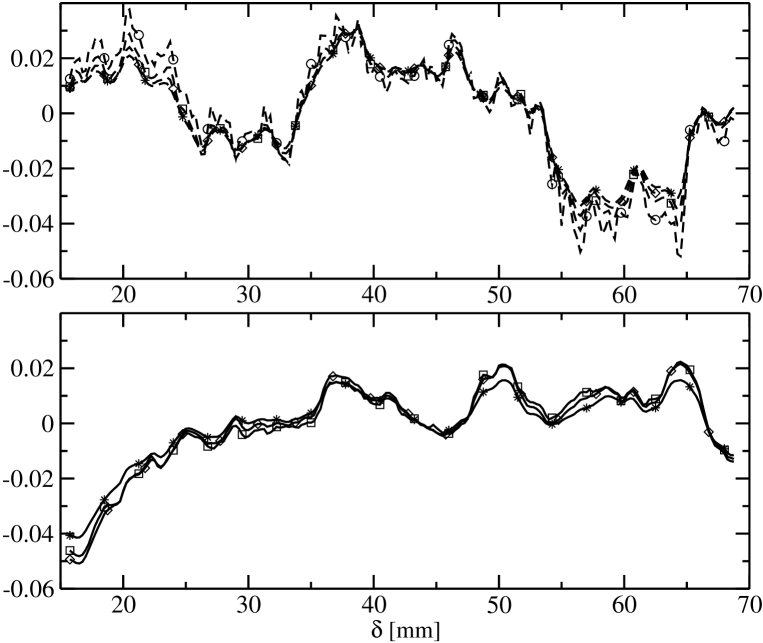
At large distances , the semivariance still displays large fluctuations with excursions above and below the asymptotic value : these are visible in Fig. 6 that represents the normalized deviations of from its average value over all distances . It is observed that the fluctuations coincide provided is used as the horizontal scale (and not the normalized lag as in Fig. 5). This suggests that these variations reflect the large scale underlying structures displayed in Fig. 3 and that their location is independent on the magnitude of the shear displacement (these fluctuations will however be very variable from a sample to an other one). The variation of the amplitude of the fluctuations with is however non trivial : the normalized deviations had to be divided by to obtain the collapse of Fig. 6. This indicates that there is some influence of the local self-affine structure on these fluctuations; if they were only due to the large scale channels, the normalized deviations would be proportional to .
4 Correlation between fracture aperture fields and fluid displacement fronts
This section is devoted to the geometry of the front between two miscible fluids (or equivalently to the dispersion of a tracer) in a single fracture. Several mechanisms contribute to the spreading of the front (or of the tracer). These include molecular diffusion, Taylor dispersion related to the velocity profile in the fracture gap and geometrical dispersion due to velocity variations between flow lines in the mean fracture plane (see Drazer and Koplik (2002) and Drazer et al (2004) for a discussion of the contribution of the above mentioned mechanisms to tracer dispersion).
Here, we shall take only into account the last mechanism : this allows us to assume a two-dimensional flow field obtained by averaging the three-dimensional velocities over the gap of the fracture with . The pressure gradient inducing the flow and the resulting global mean velocity are parallel to the axis and the front (or the tracer) is initially located at the inlet of the fracture on a line parallel to the axis . In the following, we analyze the development of the front (or the tracer line) with time, assuming that its various points move at the local flow velocity, and we present a simple analytical model accounting for its geometry.
This model is based on the results discussed above, namely that the aperture field is structured into channels perpendicular to the shear displacement . For a mean flow parallel to these channels, the tracer particles follow paths that are only weakly tortuous; also, the variations of their velocity along these paths are small compared to the velocity contrasts between the different channels. Under these assumptions, the velocity of a particle located at a distance measured perpendicular to the mean velocity satisfies : , where is a unit vector parallel to the mean flow. Note also that there are no contact points between the walls of the fractures we have used : this avoids to take into account the large tortuosity of the flow lines in their vicinity. For each channel the velocity is related to the pressure gradient by Darcy’s equation :
| (4) |
in which is the equivalent (or hydraulic) aperture of the channel.
Then, particles starting at different distances at the inlet move at different velocities, , and their distance from the inlet at time after the injection satisfies ; the mean front position moves then at the average velocity with . Combining the previous relation with Eq. (4) we obtain:
| (5) |
Finally, previous studies have shown that, for relatively small aperture fluctuations, the hydraulic aperture is well approximated by the geometrical aperture (Zimmerman et al, 1991; Brown, 1987) : this suggests that can be approximated by the average of the local apertures along the direction with .
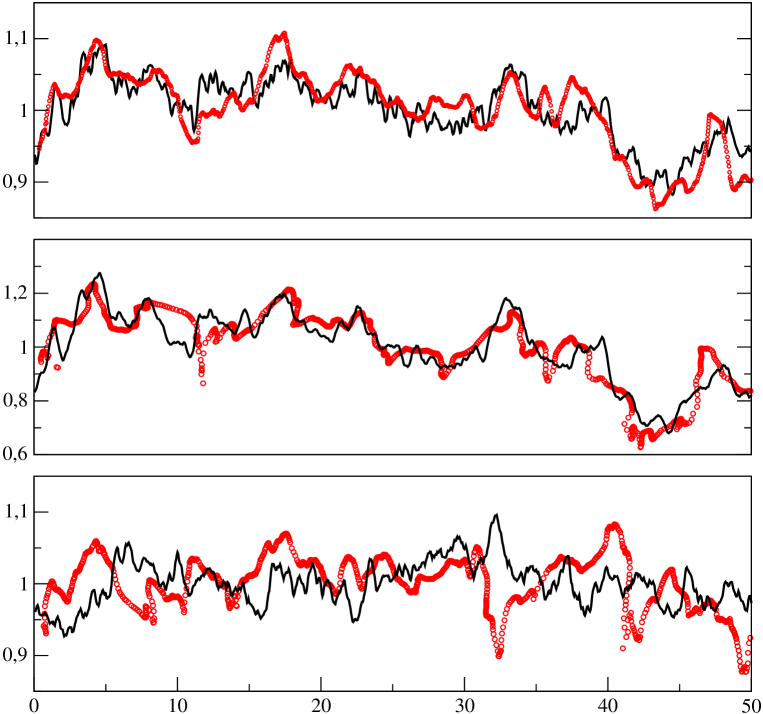
The validity of this assumption has been tested by comparing the shape of the front determined from simulations using the lattice Boltzmann method to the variations of the square of the effective aperture. For that purpose, the normalized displacements at a time parallel to the mean flow of particles released initially at are plotted in Fig. 7 as a function of the distance together with the normalized square of the aperture averaged parallel to the flow : . When the mean flow is perpendicular to the shear displacement , the variations with of the normalized position of the particles and of the normalized square aperture are very similar both for and (top and middle curves). The small differences may be due in part to the effect of viscous entrainment between adjacent flow channels due to viscous diffusion. On the contrary, when the mean flow is parallel to (bottom curves), there is very little correlation between the two curves and the amplitudes of the variations are very different (note that the curve corresponding to has been magnified by a factor of ).
These strong differences reflect and confirm the anisotropy of the aperture field induced by the shear displacement : the assumptions underlying the above model and, particularly, Eq. 5 are indeed only valid if the flow field can be described as parallel channels with a length of the order of that of the fracture. For a mean flow perpendicular to , this model represents a good approximation : the aperture of the flow channels displays long range correlations and particles are convected along each channel with a weakly fluctuating velocity. Note that, in this case, the global width of the front parallel to increases linearly with time while, for dispersive processes it increases from the square root of time. This difference results from the fact that the correlation length of the velocity of fluid particles is of the order of the total path length through the fracture; a dispersive regime can only be reached if the correlation length is much smaller. For flow parallel to , the flow lines are more tortuous and velocity fluctuations are enhanced : the model does not account any more for the geometry of the front and its width parallel to the mean flow is in addition reduced.
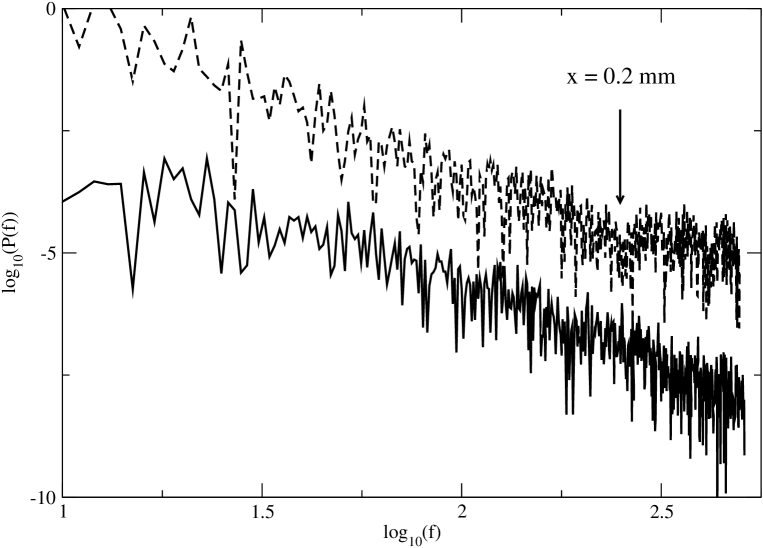
Further informations are obtained by performing Fourier transforms of the deviations of both the displacement of the front and the square of the estimated effective aperture from their mean values (the mean flow is perpendicular to the shear displacement ). The resulting power spectra are displayed in Fig. 8 and, as could be expected from the qualitative analysis of the curves of Fig. 7, both spectra are similar up to frequencies of the order of . In fact, for wavelengths smaller that the shear displacement , only displays self-affine properties.
5 Discussion and Conclusions
The experiments and numerical simulations realized in the framework of the present program have revealed new features of flow and transport in rough fractures which may be of importance in the modelization of fractured field reservoirs, such as those encountered at the Soultz site. We have specifically studied the influence of a relative shear displacement of complementary wall surfaces on the aperture field as well as on flow and transport between them. This is particularly relevant to geothermal reservoirs where fluid injections frequently induce relative displacements of the fracture walls. In agreement with many experimental results, the rough fracture walls have been assumed to display a self-affine geometry.
First, we have shown that the relative shear displacements induce an anisotropy of the flow field which reduces permeability for flow parallel to and enhances it in the perpendicular direction; this may account in part for the permeability enhancement in some sheared zones of the reservoirs. These variations are well predicted by assuming the appearance in the aperture field of large ridges perpendicular to the shear and extending over the full length of the fracture : these ridges act as parallel channels enhancing flow parallel to them and reducing transverse velocity fluctuations. This anisotropy has been confirmed quantitatively by computing semivariograms of the aperture fields : these display a correlation length proportional to the shear displacement for a given orientation but significantly larger perpendicular to than parallel to it.
A second important result is the strong correlation between the roughness of the fracture walls and the geometry of the displacement fronts, particularly for flow perpendicular to . In particular, the displacement front has a self-affine geometry characterized by the same exponent as that characterizing the fracture walls. Also, for a mean flow perpendicular to , the front width is found to increase linearly with distance : this reflects a channelization parallel the mean flow, resultinb in weak velocity fluctuations along the paths of the fluid particles. Another important consequence is the fact that the front geometry can be estimated accurately in this case from the variations of the square of the aperture averaged parallel to the mean flow.
These results raise a number of questions that will have to be considered in future studies. First, one may expect the spatial correlations of the velocity field to decay eventually, leading to a normal Gaussian dispersion process at long distances. This has not been observed in our experimental or numerical systems and we have currently no estimate of the corresponding correlation length. Also, the channeling effect might result in a motion of some fluid particles at a velocity substantially faster than the average flow velocity, at least in transient regimes of duration shorter than the time necessary to sample the flow variations inside the fracture. This effect may have a strong influence on the thermal exchange between the rock and the fluid, or on the transport of species in dissolution-deposition processes encountered, for instance, on the Soultz site. In the case of a channelized flow, for instance, the variability of the residence times in the various flow channels may result in temperature inhomogeneities in the outflowing fluid.
6 Acknowledgments
We are indebted to G. Chauvin and R. Pidoux for their assistance in the realization of the experimental set-up. Computer resources were provided by the National Energy Research Scientific Computing Center. HA and JPH are supported by the CNRS and ANDRA through the EHDRA (European Hot Dry Rock Association) and PNRH programs. GD and JK were supported by the Geosciences Program of the Office of Basic Energy Sciences (US Department of Energy), and by a PSC-CUNY grant. This work was facilitated by a CNRS-NSF Collaborative Research Grant and by the PICS CNRS n 2178.
References
- Auradou et al (2005) Auradou, H., Drazer, G., Hulin, J.P. and Koplik, J., 2005, Permeability anisotropy induced by the shear displacement of rough fracture walls, Water Resour. Res., 41, W09423, doi:10.1029/2005WR003938.
- Auradou et al (2001) Auradou, H., Hulin ,J.P., Roux, S., 2001, Experimental study of miscible displacement fronts in rough self-affine fractures, Phys. Rev. E, 63, 066306.
- Bouchaud (2003) Bouchaud, E., 2003, The morphology of fracture surfaces: A tool for understanding crack propagation in complex materials, Surface Review And Letters, 10, 797–814.
- Brown (1987) Brown, S.R., 1987, Fluid flow rough joints: The effect of surface roughness, J. geophys. Res., 92, 1337–1347.
- Dezayes et al (2004) Dezayes, Ch., Genter, A., and Gentier, S., 2004, Fracture network of the EGS Geothermal Reservoir at Soultz-sous-Forets (Rhine Graben, France), Geothermal Ressources Council Transaction, 28, 213–218.
- Drazer and Koplik (2000) Drazer, G., and J. Koplik, 2000, Permeability of self-affine rough fractures, Phys. Rev. E, 62, 8076–8085.
- Drazer and Koplik (2002) Drazer, G., and J. Koplik, 2002, Transport in rough self-affine fractures, Phys. Rev. E, 66, 026303.
- Drazer et al (2004) Drazer, G., H. Auradou, J. Koplik, and J. P. Hulin, 2004, Self-affine fronts in self-affine fractures: Large and small-scale structure, Phys. Rev. Lett., 92, 014501.
- Evans et al (2005) Evans, K., Moriya, H., Niitsuma, H., Jones, R.H., Phillips, W.S., Genter, A., Sausse, J., Jung, R., and Baria, R., 2005, Microseismicity and permeability enhancement of hydrogeologic structures during massive fluid injections into granite at 3km depth at Soultz H.D.R. site, Geophys. J. Int., 160, 388–412.
- Feder (1988) Feder, J., 1988. Fractals, Physics of Solids and Liquids, Plenum Press, New York.
- Genter et al (1997) Genter, A., Castaing, C., Dezayes, Ch., Tenzer, H., Traineau, H., and Villemin, T., 1997, Comparative analysis of direct (core) and indirect (borehole imaging tools) collection of fracture data in the Hot Dry Rock Soultz reservoir (France), Journal of Geophysical Research, 102, B7, 15,419–15,431.
- Gentier et al. (1997) Gentier, S., E. Lamontagne, G. Archambault, and J. Riss, 1997, Anisotropy of flow in a fracture undergoing shear and its relationship to the direction of shearing and injection pressure, Int. J. Rock Mech. & Min. Sci., 34(3-4), 412.
- Kitanidis (1997) Kitanidis, P.K., 1997, Introduction to geostatistics, Cambridge University Press.
- Kumar and Ghassemi (2005) Kumar, G.S., Ghassemi, A., 2005. Numerical modeling of non-isothermal quartz dissolution/precipitation in a coupled fracture matrix system, Geothermics, 34, 411–439.
- Olsson and Brown (1993) Olsson, W. A., and S. R. Brown, 1993, Hydromechanical response of a fracture undergoing compression and shear, Int. J. Rock Mech. Min. Sci. & Geomech. Abs., 30(7), 845–851.
- Plouraboué et al. (1995) Plouraboué, F., P. Kurowski, J. P. Hulin, S. Roux, and J. Schmittbuhl, 1995, Aperture of rough cracks, Phys. Rev. E, 51(3), 1675–1685.
- Sausse (2002) Sausse, J., 2002, Hydromechanical properties and alteration of natural fracture surfaces in the Soultz granite (Bas-Rhin,France), Tectonophysics, 348, 169–185.
- Yeo et al. (1998) Yeo, I. W., M. H. De Freitas, and R. W. Zimmerman, 1998, Effect of shear displacement on the aperture and permeability of a rock fracture, Int. J. Rock Mech. & Min. Sci., 35(8), 1051–1070.
- Zimmerman and Bodvarsson (1996) Zimmerman, R. W., and Bodvarsson G.S., 1996, Hydraulic conductivity of rock fractures, Transp. Porous Media, 23, 1–30.
- Zimmerman et al (1991) Zimmerman, R.W., Kumar, S. and Bodvarsson, G.S., 1991, Lubrification theory analysis of the permeability of rough-walled fractures, Int. J. Rock, Mech. Min. Sci. & Geomech. Abstr., 28, 4, 325–331.