A Study of the Water Cherenkov Calorimeter
Abstract
The novel idea of water Cherenkov calorimeter made of water tanks as the next generation neutrino detector for factories and beams is investigated. A water tank prototype with a dimension of is constructed, its performance is studied and compared with a GEANT4 based Monte Carlo simulation. By using measured parameters of the water tank, including the light collection efficiency, attenuation length, angular dependent response etc, a detailed Monte Carlo simulation demonstrates that the detector performance is excellent for identifying neutrino charged current events while rejecting neutral current and wrong-flavor backgrounds.
keywords:
Neutrino oscillation , Cherenkov detector , CalorimeterPACS:
14.60.Pq , 29.40.Ka , 29.40.Vj1 Introduction
Neutrino factories and conventional beams have been discussed extensively [1, 2] as the facility of neutrino physics for the next decade. The main physics objectives include the measurement of , , the leptonic CP phase and the sign of . All these quantities can be obtained through the disappearance probability and the appearance probability and . To measure these quantities, a detector should: 1) be able to identify leptons: and if possible ; 2) have good pattern recognition capabilities for background rejection; 3)have good energy resolution for event selection and to determine ; 4) be able to measure the charge for in the case of factories; and 5) be able to have a large mass(100-1000kt) at an affordable price.
Water is one of the most economic materials for large scale neutrino detectors. Water Cherenkov ring image detectors have been successfully employed in large scale experiments such as Super-Kamiokande [3], MiniBooNE [4] and IMB [5], etc. However such kind of detectors are not suitable for neutrinos with an energy more than due to complications of showers, therefore not the choice for very long baseline neutrino oscillation experiments. The water Cherenkov calorimeter made up by a matrix of water tanks, was proposed [6] for the long baseline neutrino oscillation experiments.
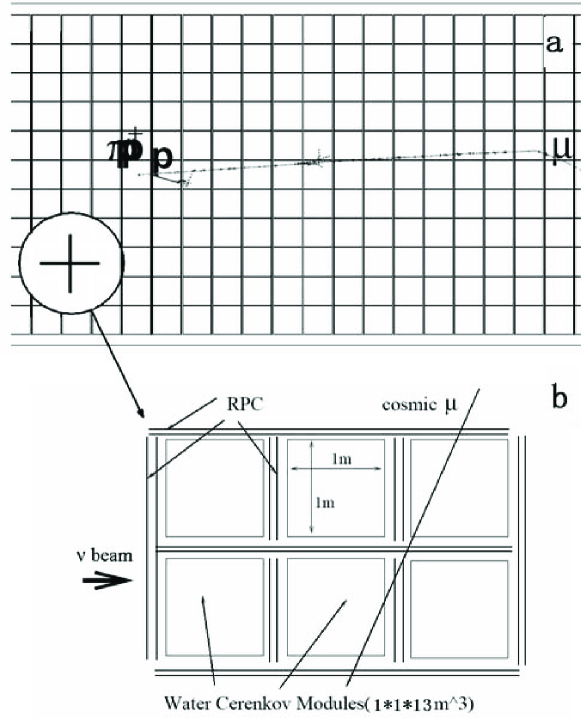
A water Cherenkov Calorimeter with a modular structure is shown in Fig.1. Each tank has dimensions of about , corresponding to 2.77X0 and 1.5 in its transverse dimension. The water tank is made of PVC with reflective inner lining. Photons are collected at both end of the tank, hence significantly reducing the photon collection area and the cost. Cherenkov light produced by charged particles in the water tank is estimated to be sufficient for energy resolution, and position is determined by the arrival time of photons to the phototubes at both ends of the tank. The directional information is obtained by the reconstruction of the event thrust. The event pattern in energy and space in the water tank matrix can be used to identify neutrinos undergoing charge current(CC) interactions, as shown in Fig. 1.a which is a typical CC event.
The water Cherenkov calorimeter is similar in a sense to the crystal calorimeter at accelerator experiments. It is a cheap solution for the long baseline neutrino oscillation experiments at a scale of 100-1000kt, and also applicable to cosmic-ray physics and astrophysics. Reports about these kind of applications can also be found in Ref. [7]. In this paper, we report our study with a prototype and a Monte Carlo simulation using measured parameters of the water tank performance for the identification of neutrino CC events.
2 Water Tank Prototype
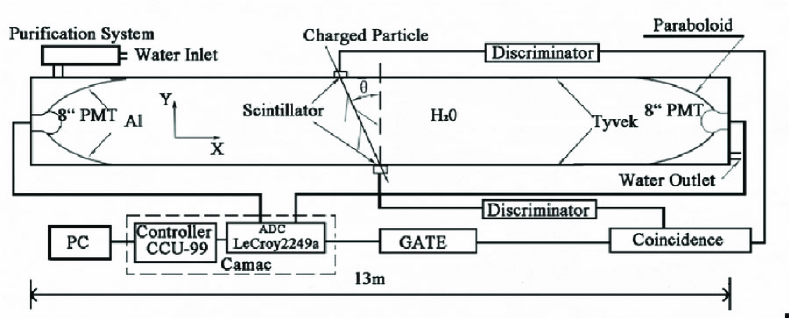
A water tank prototype [8] made of PVC with the dimension of is built as shown in Fig. 2. The inner wall of the tank is covered by the Tyvek film 1070D from DuPont. At each end of the tank there is a Winston cone [9] which can collect parallel light at its focal points, where an 8-inch photomultiplier is installed. The Winston cone is again made of PVC, covered by the aluminium film with protective coating. Cherenkov light produced by through-going charged particles are reflected by the Tyvek and the Al film and collected by the photomultiplier at the focus of the Winston cone. At the top of the tank there is an air gap(about 1cm) above the water level which serves as a total reflector for photons with certain incident angles.
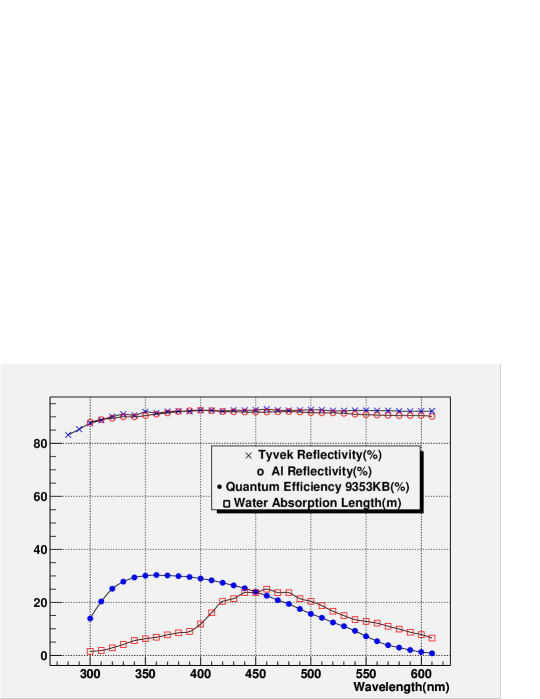
Tyvek is a diffuse reflector with a very high reflectivity which is measured in the frequency range of visible light as shown in Fig. 3. Although it is naively believed that mirror reflector such as the Al film has a better light collection for such a long optical module, our simulation shows that their performances are actually very similar [10]. The dominant factor is the bulk reflectivity. The good mechanical and chemical properties of the Tyvek film lead us to use it in order to have an easy handling and less aging effect in the deionized water. Tyvek as a reflector in water has been used by many experiments, including Super-Kamiokande, KamLAND, and Auger experiments [11].
Since the Winston cone needs a mirror reflection to collect light, a selected Al film is used. Al film has a very high reflectivity in theory, but is easy to be oxidized in water and loss its reflectivity. A protective coating is hence needed and the reflectivity is measured to be typically 90%, as shown in Fig. 3.
In order to have a good water transparency, the clean de-ionized water with a resistance of more than is used. The water is again purified by a simple system with a filter, which can increase the transparency by a factor of two. The water absorption length as a function of wavelength used in Monte Carlo simulation is obtained by scaling down the curve from the Auger experiment [12] based on our experimental data, as shown in Fig. 3. The phototube used is 9350KB from EMI, and its quantum efficiency [13] is shown in Fig. 3.
Cosmic-muons, triggered by two scintillator counters at the top and the bottom of the tank, are the primary charged particles which generate Cherenkov photons. The muon flux at the sea level is about , and the area of scintillation counters is , hence it takes typically 10 hours to accumulate one spectrum. Such a small trigger counter is selected to control the error due to the incident position, angle and the pass length of muons. A displacement of one of the two trigger counters in x direction(see Fig. 2) can define the incident angle of the muons. In addition, between two cosmic data taking runs a calibration run with the trigger counters at x=0.5m was taken to monitor the water quality.
The setup includes also a C205 ADC from CAEN to measure the charge of muon and the single photoelectron for calibration, a N844 discriminator from CAEN to generate trigger signals and the gate signal for ADC.
2.1 Monte Carlo Simulation
Since Geant4 provides quite powerful tools for describing the detector and the relevant physics with a fairly flexible optical model inspired by the work of Nayer et al. [14], a GEANT4 based Monte Carlo simulation program of this water tank prototype has been developed.
The so called UNIFIED model, which accommodates the principal features of both physical and geometrical optical models of surface reflection over a wide range of surface roughness and wavelengths, is used in our simulation. The implementation of UNIFIED model requires the specification of seven free parameters [15]: is the index of refraction of the incident medium; the index of refraction of the transmission medium; the specular lobe constant; the specular spike constant; the backscatter constant; the diffuse lobe constant; and the RMS of the angle between the average surface normal and microfacet normals. Since the construction of the water tank is similar in many ways to that of the Auger detector, some values of the parameters in our simulation programs are selected to be very similar [16]. We set with the corresponding , , and . and are from our experimental measurements. More details about optical models and its parameters have been discussed in Ref. [10, 17].
2.2 Experimental study of the Water Tank Prototype
2.2.1 PMT’s Single-photoelectron Spectrum
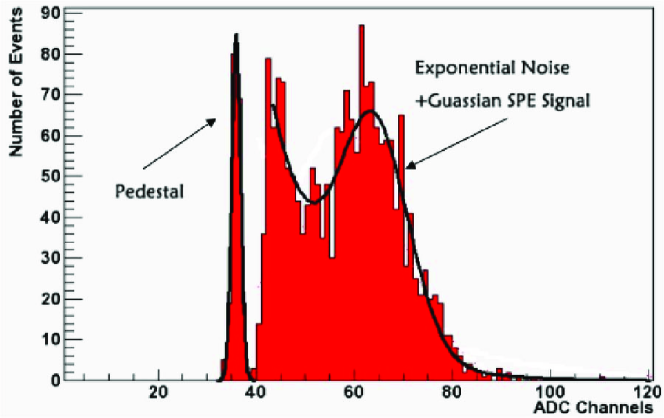
Single photoelectron spectrum(SPE) is measured before each run in order to calibrate the system since signal amplitudes normalized to that of SPE provide a unique measure of light collected by photomultipliers. SPE can be measured in many ways, one of which is the so called ”thermal noise” method. In total darkness, a photomultiplier can still generate pulses due to thermal emission of single electron by photocathode, equivalent to the charge spectrum of single photoelectron. Thermal emission of electrons by dynodes constitutes the noise below the SPE peak. A SPE spectrum of the PMT 9350KB, applying a high voltage of 1550V at the room temperature(about C), is measured as shown in Fig. 4. Since the ADC used is only 12 bit, the working voltage(1550V) of the PMT is selected to avoid saturation of ADC for cosmic-muons at all positions along the water tank. The SPE spectrum is obtained by a self-trigger with a threshold of 2mV and a gate width of 100ns. The first peak corresponds to the pedestal, the second peak comes from the dynode noise above the 2mV threshold, and the last peak is from SPE, whose position will be used as the normalization to count number of photoelectrons.
The effective attenuation length of water had worsened over time, hence calibration runs were taken before each measurement, and all data points in the late sections are after correction.
2.2.2 Position Dependent Response of the Water Tank
Light collected for cosmic-muons is a function of distance from the incident point of the muon to the phototube, since the water transparency and reflectivity of the Tyvek film is not perfect. Such a position dependent response of the tank is critical to its energy resolution and pattern recognition capability. Typically it is characterized by an exponential behavior of , where x is the distance of the muon event to the phototube and is the characteristic parameter, often called ”effective attenuation length”.
The characteristic parameter depends on the water transparency, the reflectivity of the Tyvek film, and the geometry of the tank. Fig. 6 shows the charge spectrum collected at x=0.5m with an incident angle of . Using the trigger scintillation counters to define the muon incident location, keeping the y coordinate constant as indicated in Fig. 2, the total light collected as a function of x at several locations is obtained as shown in Fig. 6. An exponential fit yields the measured effective attenuation length of the water tank of . The line represents the Monte Carlo prediction by adjusting the water absorption length as shown in Fig. 3, until the effective attenuation length is in agreement with that of the measurement. As to be discussed later, this tuning is justified by the agreement between data and Monte Carlo prediction for both the effective attenuation length and the angular dependent response.
![[Uncaptioned image]](/html/physics/0602169/assets/x5.png)
![[Uncaptioned image]](/html/physics/0602169/assets/x6.png)
It can be seen from Fig. 6 that, for a through-going muons entering the center of the tank, a total of 20 photoelectrons by each PMT will be collected, corresponding to a statistical fluctuation of about 7%/. Based on the Monte Carlo simulation, the number of photons at various stages of the photon transport in the water tank is listed in table 1. From the table, about 74% of light lost due to the Tyvek reflection and water absorption. The Winston cone has a collection efficiency of 3.1%, same as the ratio of PMT surface area to that of the water tank cross section. It means that the Winston cone did not improve the light collection efficiency, but the uniformity of the light collection.
There are several ways to improve the light collection of the water
tank: a) The water absorption length can be improved with a more
sophisticated purification system. In fact the Super-Kamiokande
experiment reached an absorption length of about 90m [18], a
factor of 3 better than what was reached here; b) The reflectivity
of the inner liner can be improved by using newly developed plastic
reflectors, VM2000 or ESR from 3M Co. [19]. They have a
reflectivity better than 99%, which can increase the total light
collected by more than 50%. In total, it is possible to increase
the light collection by a factor of two, corresponding to a
statistical fluctuation of about
5%/ for each tank.
| No. of Cherenkov photons produced | 35157179 |
|---|---|
| No. of photons entering Winston cones | 927476 |
| No. of Photons hitting the glass surface of two PMTs | 28818 |
| No. of photoelectrons collected by two PMTs | 423 |
2.2.3 Angular Dependent Response of the water tank
Since Cherenkov light produced is not isotropic, and its direction is correlated to that of the incident charged particles, the total light collected by phototubes at each end of the water tank is also correlated to the incident angle of the particles. By using trigger counters to define the angle as shown in Fig. 2, response of the water tank to through-going charged muons with incident angles varied from to are measured. The bottom trigger scintillator is fixed at x=0.5m, and the top trigger scintillator is moved along the -x direction. After normalizing the track length to 1m, results are shown in Fig. 7a together with predictions from the Monte Carlo simulation. Since the only free parameter to be tuned in the Monte Carlo prediction is the overall scaling of the water absorption length as discussed before, the good agreement between data and Monte Carlo simulation for both effective attenuation length and the angular dependent response shows that the optical behavior of the water tank is largely understood.
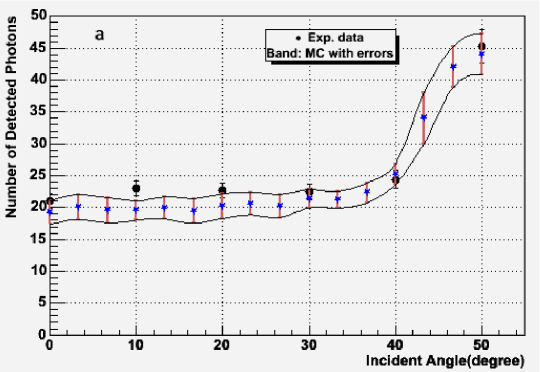
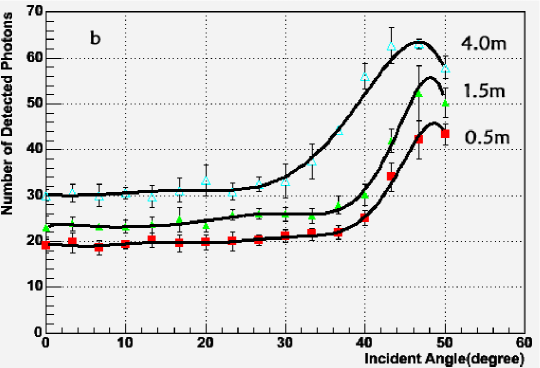
As can be seen from Fig. 7a, the number of photoelectrons is approximate constant for incident angles less then 3. This is confirmed by the Monte Carlo simulation, and true at almost all locations of the tank, as shown in Fig. 7b. This is significant since during the event reconstruction, this factor can be ignored and the energy resolution of neutrino event can be maintained at a reasonably good level.
3 the Water Cherenkov Calorimeter for Detection
Water Cherenkov calorimeter for the neutrino detection has been studied by using a GEANT3 based Monte Carlo simulation [6]. In this paper we report a new study taking into account the water tank properties such as attenuation length, light collection efficiency and its angular dependence, etc, based on prototype measurements. The optical process inside the water tank is parameterized by an efficiency distribution, , where is the incident angle of charged particles and x the position of energy deposit. Such a parameterization is obtained by a GEANT4 based Monte Carlo simulation as described in section 2.2, and confirmed by the prototype measurement as shown in Fig.7.
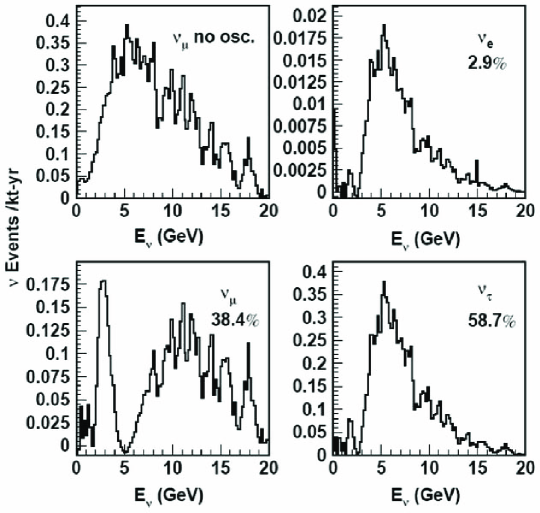
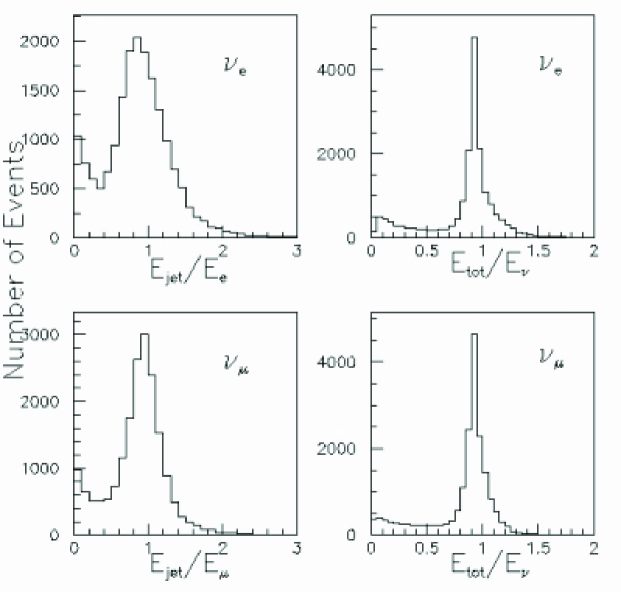
One possible application considered is the neutrino beam from JAERI [20] to Beijing with a baseline of 2100km [2]. A total of 60k and events(Fig.8) are simulated using an event generator from the Minos experiment. A CC signal event is identified by its accompanying lepton, reconstructed as a jet. Fig. 9 shows the jet energy normalized by the energy of the lepton. It can be seen from the plot that leptons from CC events can indeed be identified and the jet reconstruction algorithm works properly. It is also shown in the figure that the energy resolution of the neutrino CC events is about 13% in both cases.
Since the detector is made of a matrix of water tanks(Fig.1), it’s convenient and simple to obtain the following variables and their distributions for all different neutrino flavors, which are very effective to identify the neutrino CC events:
-
•
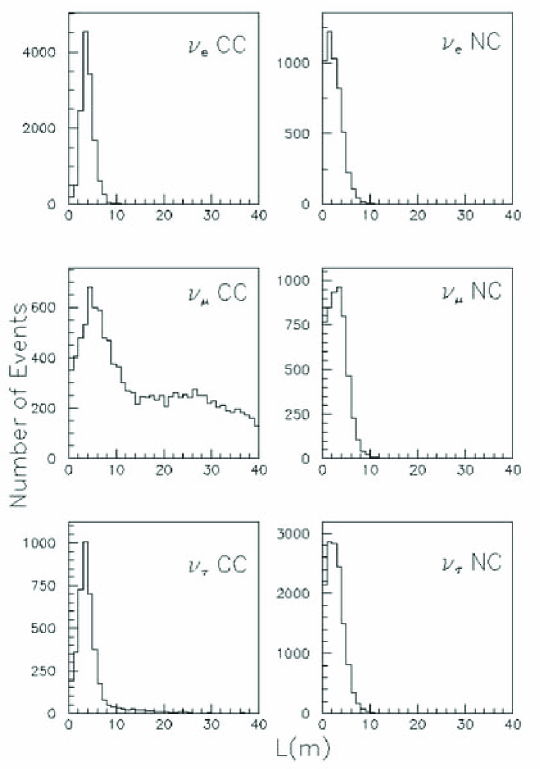
L after shower maximum: the longitudinal length of the jet from the shower maximum to the last cell, as shown in Fig. 10. Since leptons are only generated by CC process, this varible is good to distinguish the neutrino CC events and NC events. After the application of the cut , the remaining NC events is only 0.1%;
-
•
: the transverse event size at the shower maximum normalized to the total visible energy , as shown in Fig. 11. The difference between CC and NC events is not too much, but combined with others cuts, it can be used to effectively remove the backgrounds from each neutrino flavor.
-
•
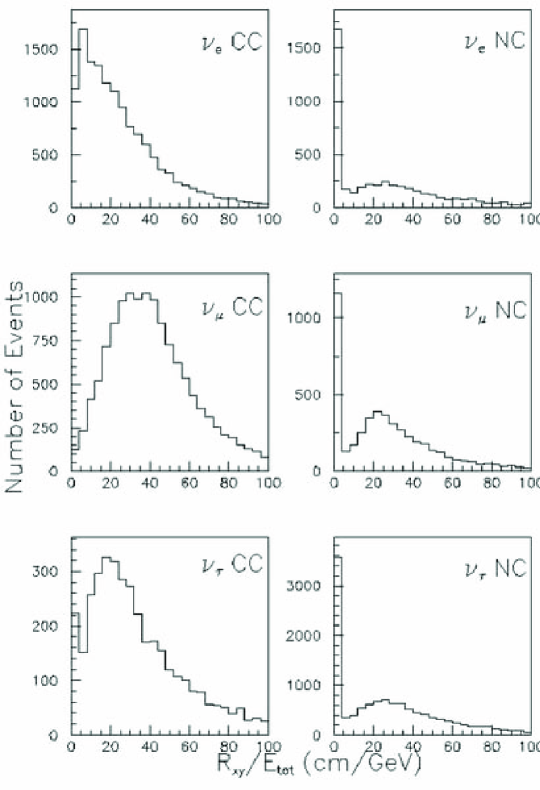
: the transverse event size normalized to , as shown in Fig. 12. It’s useful for the and events. For example, after application of the cut , the ratio of NC to CC events is about 0.38.
-
•
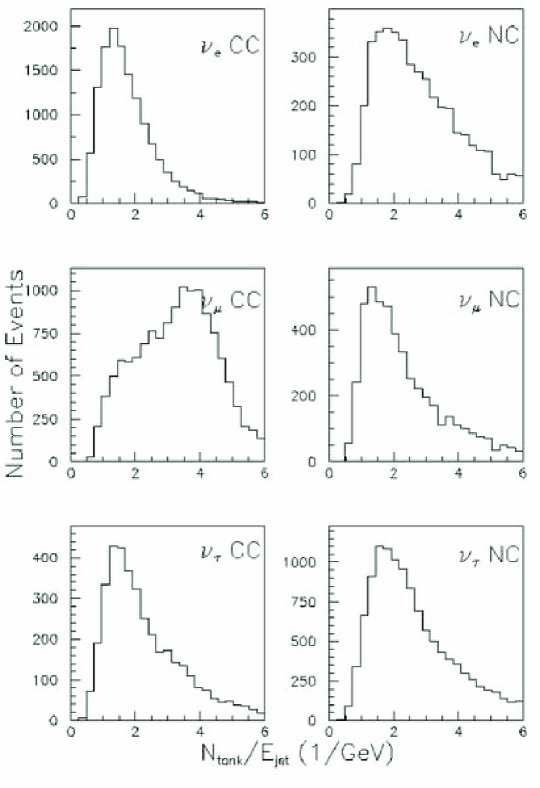
: the number of cells with energy above the threshold(10MeV) normalized to the jet energy of the event , as shown in Fig. 13. For the and events, most of NC events can be removed with certain range of .
-
•
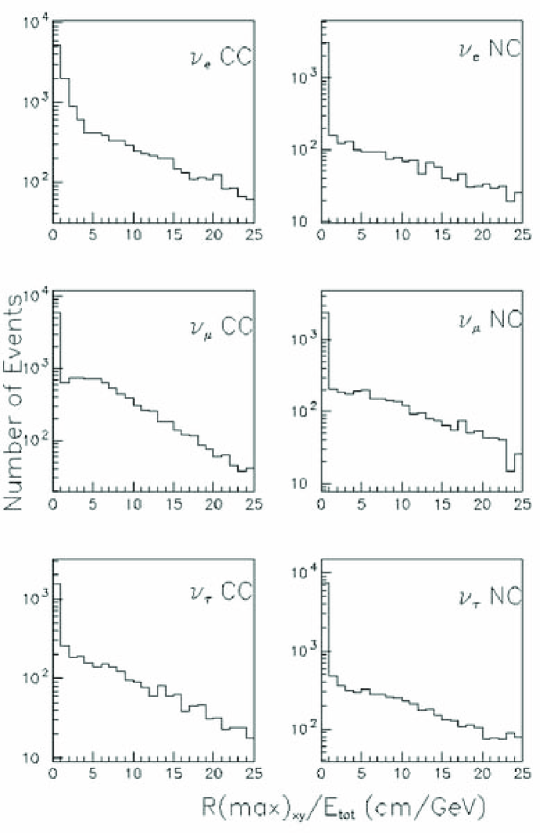
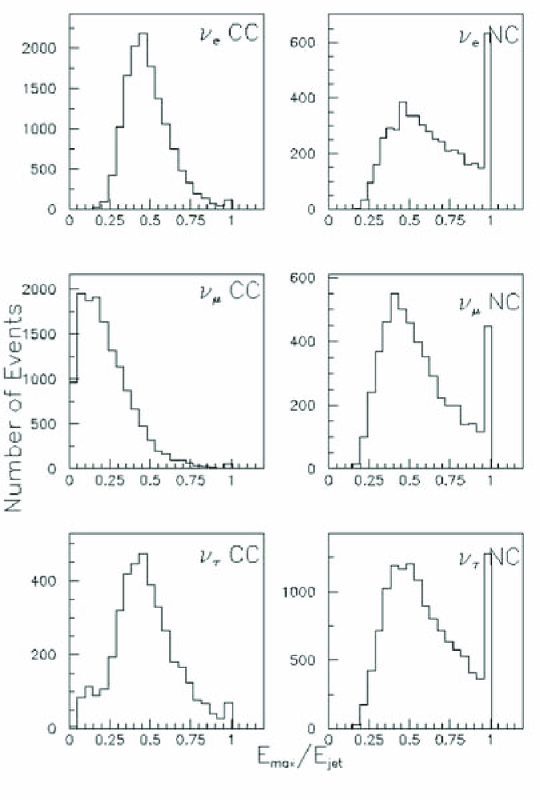
: the maximum energy deposition in one cell normalized to , as shown in Fig. 14. A total of 75.6% of CC events can be obtained after the application of the cut .
| CC Eff. | 22% | 51% | 15% |
|---|---|---|---|
| CC | - | 13720:1 | 7:1 |
| NC | 89:1 | 6110:1 | 55:1 |
| CC | 386:1 | - | 497:1 |
| NC | 45:1 | 2999:1 | 38:1 |
| CC | 15:1 | 18:1 | - |
| NC | 84:1 | 15802:1 | 48:1 |
| CC Eff. | 33% | 71% | 11% |
|---|---|---|---|
| CC | - | 740:1 | 6:1 |
| NC | 31:1 | 1033:1 | 37:1 |
| CC | 59:1 | - | 66:1 |
| NC | 14:1 | 434::1 | 14:1 |
| CC | 9:1 | 13:1 | - |
| NC | 300:1 | 593:1 | 350:1 |
Table2 shows the final results from this Monte Carlo study. It can be seen that CC events can be selected with reasonable efficiency and moderate backgrounds. For and events, CC events are dominant backgrounds, while for , the main background is . It is interesting to see that this detector can identify in a statistical way. With the application of the cut , much higher detection efficiencies of CC events can be obtained, the results are shown in the Table3. These results are similar to or better than those from water Cherenkov image detectors and iron calorimeters [21]. We would like to point out that using sophisticated jet reconstruction algorithms, shower shape analysis and neural network technique, better results are expected. Using Table2, we can explore the sensitivity of our detector to various quantities, such as , CP phase,etc. Assuming that the systematic error is not dominant, a sensitivity of 0.2% to at relevant can be reached for 500ktyr with the designed beam’s intensity of JAERI to Beijing.
4 Summary
A full size water tank prototype, with a dimension of , made of PVC with reflective inner liner was built. The effective attenuation length and the angular response of the tank was measured, and good agreement with a GEANT4 based full Monte Carlo simulation was obtained. The light yield, the total light collection efficiency, the effective attenuation length and the angular dependent response of the tank are all good enough for the long baseline neutrino oscillation experiment, and can be further improved. The performance is excellent for and appearance and disappearance from the GEANT3 based Monte Carlo simulation. The water Cherenkov calorimeter is a cheap and effective detector for factories and super beams, and such a detector is also desirable for cosmic-ray physics and astrophysics.There are no major technical difficulties although further R&D and detector optimization are needed.
5 Acknowledgement
This work is supported by the National Natural Science Foundation of China under contract No. 10225524 and the Chinese Academy of Science under contracts No. U-18 and U-35. We would like to thank X.-C. Meng for his technical assistance to the work presented here. We also acknowledge the fruitful discussions with Prof. C.-G. Yang and Prof. J. Cao.
References
- [1] C. Albright et al., hep-ph/0008064; BNL neutrino working group, hep-ex/0211001; M. Aoki et al., Phys. Rev. D 67(2003)093004;Y.F. Wang et al., Phys. Rev. D. 65 (2002)073021; Y.F. Wang et al., Phys. Rev. D. 65 (2002)073006.
- [2] H. Chen et al., hep-ph/0104266
- [3] Y Fukuda, et al., Phys. Rev. Lett. B 81 (1981) 1562.
- [4] Andrew O. Bazarko MiniBooNE: the Booster Neutrino Experiment Presented at DPF99, Los Angeles
- [5] R. Becker-szendy et al.,(IMB Collaboration), Phys. Rev. D 46 (1992) 3720
- [6] Yi-Fang Wang, talk given at Joint US-Japan workshop on ”New Initiatives in Muon Lepton Flavor Violation and Neutrino Oscillation with High Intense Muon and Neutrino Sources”,Hawaii,2000,hep-ex/0010081;Nucl. Instr. and Meth. A503 (2003) 141.
- [7] S. Steinbuegl, et al., Proceeding of ICRC (2001) 912
- [8] Chen Ming-jun, et al., HEP & NP, 29(10) (2005) 983.
- [9] Roland Winston, Jay M.Enoch. J.Opt.Soc. Amer., 61(1971) 1120
- [10] Chen Ming-jun, et al., HEP & NP, 27(11) (2003) 1015
- [11] A. Filevich, et al. Nucl. Instr. Meth. A423 (1999) 108, Auger technical note GAP-97-065
- [12] G. Matthiae, Auger technical note GAP-2002-061
- [13] http://www.electron-tubes.co.uk/pmts/pmt_menu.html
- [14] S. K. Nayer, et al. IEEE Trans. on Pattern Analysis and Machine Intelligence, 1991,13 (1991) 611
- [15] A. Levin, et al. TRIUMF internal note TRI-PP-96-64(1996)
- [16] L. A. Anchordoqui, et al., Nucl. Phys. B 97(2001)196
- [17] Tom McCauley, Tom Paul, Auger technical note GAP-2000-055
- [18] Choji Saji, Doctoral thesis, Studying of upward-going muons in Super-Kamiokande
-
[19]
MPI-K progress report (2001/2002) 43
VikuitiTH ESR Brochure http://www.3m.com - [20] http://jkj.tokai.jaeri.go.jp
- [21] K.Dick et al. Nucl.Phys. B598 (2001) 543-553