Present address:] Laboratoire Aimé Cotton, Campus d’Orsay, 91405 Orsay, France
Surface wave generation and propagation on metallic subwavelength structures measured by far-field interferometry
Abstract
Transmission spectra of metallic films or membranes perforated by arrays of subwavelength slits or holes have been widely interpreted as resonance absorption by surface plasmon polaritons (SPPs). Alternative interpretations involving evanescent waves diffracted on the surface have also been proposed. These two approaches lead to divergent predictions for some surface wave properties. Using far-field interferometry, we have carried out a series of measurements on elementary one-dimensional (1-D) subwavelength structures with the aim of testing key properties of the surface waves and comparing them to predictions of these two points of view.
Early reports of transmission through arrays of subwavelength holes in thin films and membranes ELG98 ; TPL01 ; GTG98 , enhanced well beyond conventional expectation B54 have motivated numerous attempts to explain the underlying physics of these surprising results. Since the early experiments were carried out on metal films, surface plasmon polariton resonances Raether88 ; BDE03 were invoked to explain the anomalously high transmission and to suggest new types of photonic devices BDE03 . Other interpretations based on “dynamical diffraction” in periodic slit and hole arrays T99 ; T02 or various kinds of resonant cavity modes in 1-D slits and slit arrays CL02 ; VLE03 have also been proposed. Reassessment of the early claims by new numerical studies CGS05 and new measurements LT04 have prompted a sharp downward revision of the enhanced transmission factor from to and have motivated the development of an alternative approach based on a composite diffractive evanescent wave (CDEW) LT04 . This model constructs a composite surface wave from the distribution of diffracted evanescent modes (the inhomogeneous modes of the “angular spectrum representation” of wave fields MW95 ) originating at an abrupt surface discontinuity such as a subwavelength-sized hole, slit, or groove when irradiated by a train of plane waves. The CDEW model exhibits three specific properties. First, the surface wave is considered to be a composite of modes labelled by the propagation vector component parallel to the surface, and evanescent in the direction normal to the surface. This composite “wave packet” exhibits well-defined, regular nodal positions spaced by a characteristic wavelength, ; second, the appearance of the first node at a distance of from the structured edge implies an effective phase delay of with respect to the E-field of the external driving source; and third, an amplitude decreasing inversely with distance from the launch site with an overall effective range of a few microns.
We have fabricated 1-D structures (slits and grooves with subwavelength widths) in thin silver films deposited on fused silica substrates designed to test these features of the CDEW model. The optical response can be studied with the structures facing toward (input-side experiments) or away from (output-side experiments) a distant coherent plane-wave source. Results from the input-side experiments, exhibiting light transmission interference as a function of slit-groove distance, have been reported elsewhere GAV06 . We report here measurements of output-side, far-field intensity fringes arising from interference between propagating waves transmitted through the slit and surface waves launched at the slit but, after travelling along the surface, reconverted to outgoing waves at the groove (see Fig. 2). Studies of fringe frequency, phase, and contrast as a function of slit-groove distance and groove depth provide new and complementary information to the previously reported input-side experiments.
The subwavelength structures are fabricated by focused ion beam (FIB) milling (FEI Nova-600 Dual-Beam system, Ga+ ions, 30keV) in a 400 nm thick layer of silver evaporated onto flat fused silica microscope slides. A low beam current (50 pA) is used in order to achieve surface features defined with a lateral precision on the order of 10 nm and characterised by near-vertical sidewalls and a minimal amount of edge rounding. Since it enables delivery of a variable ion dose to each pixel of the writing field, FIB milling conveniently allows the multiple-depth topography characteristic of the present devices to be formed in a single, self-aligned step. A 2-D matrix of structures is milled into the silver layer. Each matrix consists of 63 structures, nine columns, separated by 1.5 mm, and seven rows, separated by 2 mm. The first column contains only slits with no flanking grooves. Light transmission through the slits in this column is used to normalise the transmission in the remaining columns. Variations in transmission through each of the elements in the “slits only” column provide a measure of the uniformity of the FIB fabrication process. The remaining structures consist of slits flanked on one side by a groove. The groove-slit distance is systematically increased from the initial to final matrix positions. The square microscope slides themselves are 25 mm on a side and 1 mm thick.
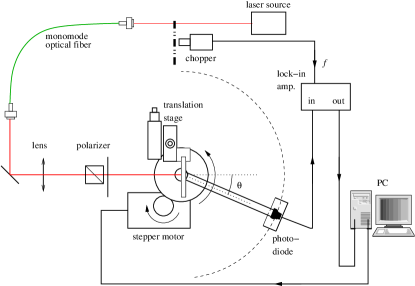
Measurements were carried out using a home-built goniometer shown in Fig. 1. Output from a diode laser source, temperature stabilised and frequency-locked to the Cs 2P crossover feature in a saturated absorption cell, is modulated at 850 Hz by a mechanical chopper, injected into a monomode optical fibre, focused and linearly polarised (TM polarisation, H-field transverse to the slit) before impinging perpendicularly on the structure matrix mounted in a sample holder. The beam waist diameter and confocal parameter of the illuminating source are 300 m and 33 cm, respectively. Throughout this series of measurements the laser power density was maintained W cm-2. The sample holder itself is fixed to a precision x-y translator, and individual slit-groove structures of the 2-D matrix are successively positioned at the laser beam waist. A photodiode detector is mounted at the end of a 200 mm rigid arm that rotates about an axis passing through the centre of the sample holder. A stepper motor drives the arm at calibrated angular increments of 2.05 mrad per step, and the overall angular resolution of the goniometer is mrad. The photodetector output current passes to a lock-in amplifier referenced to the optical chopper wheel. Data are collected on a personal computer that also controls the goniometer drive.
The structures consist of a single subwavelength slit, 100 nm wide flanked by one subwavelength groove. Both groove and slit are 20 m long. We have carried out measurements with grooves of two different widths (100 nm and 415 nm) and depths varying from 32 nm to 256 nm. Here we report results only for the 100 nm grooves since the wider structures yield similar results.
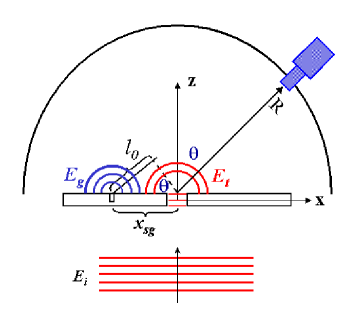
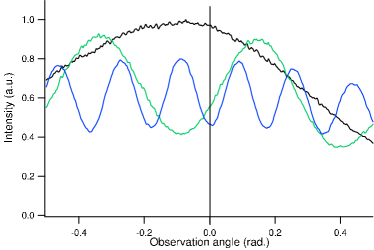
As illustrated in Fig. 2, the far-field intensity pattern should exhibit interference fringes between directly propagating through the slit and radiating from the grooves after having been transmitted by the surface waves launched at the output side of the slit. The frequency and phase of the interference pattern is a function of the optical path difference and any “intrinsic” phase shift (e.g. due to groove shape or surface wave phase lag) of with respect to . Figure 3 shows interference fringes at three representative slit-groove distances as a function of the goniometer detector angle . The fractional surface wave amplitude , normalised to the incoming plane wave amplitude , , is estimated from the Kowarz model K95 to be about 95%. The remaining 5% constitutes the amplitude fraction of the light directly transmitted through the slit . A further fraction is reconverted to propagating light at the groove site and interferes with . The intensity, , of the superposed wavefronts can be expressed as
| (1) |
The normalised intensity can then be expressed, with ,
| (2) |
with and . The relations between are shown in Fig. 2. The frequency and phase of the interference pattern depend on the slit-groove distance through the terms , and . The term represents the “intrinsic” phase shift due to groove geometry and surface wave generation at the slit edge.
With the goniometer detector oriented perpendicular to the structure plane (), Eq. 2 simplifies to
| (3) |
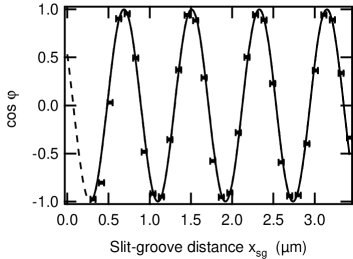
Figure 4 plots a series of measurements of the far-field intensity as a function of the slit-groove distance with the detector angle at . The interference term on the right side of Eq. 3 is fit to the data from which can be determined by extrapolation of to zero distance. The magnitude of the surface wave propagation vector is also determined from the fit. We mesure to be nm in agreement with the input-side experiments reported earlier GAV06 . The intrinsic phase for this groove groove geometry (100 nm width and depth) is determined from the plot to be .
In addition to the frequency and phase of the interference we have studied the ”visibility” or contrast of the output-side interference fringes as function of . The interference contrast is defined as
| (4) |
where are adjacent intensity maxima and minima of the fringes. According to Eq. 2 the contrast can be expressed as
| (5) |
Since , the fractional amplitude radiating at a groove, a plot of as a function of measures the dependence of this field amplitude (and therefore the surface wave amplitude) on the slit-groove distance. Figure 5 shows a plot of as a function of for narrow-groove structures. The form of the fitted curve through the data points, an inverse distance dependence with an additive constant, is given by Eq. 6 with fitting parameters as indicated in the captions of Fig. 5.
| (6) |
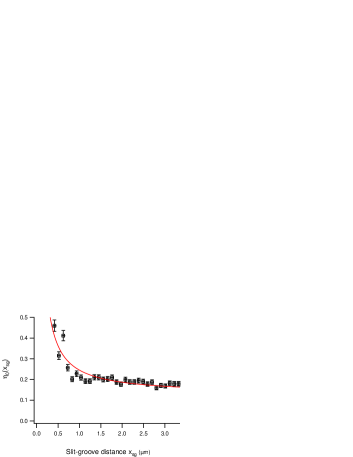
We can now compare these results to predictions of the CDEW model. Two key predictions are: (1) that the amplitude of the composite surface wave decreases as the inverse of the distance from the launch site, and (2) that there is an intrinsic phase delay of between , the directly transmitted wave and the composite evanescent wave. Figure 5 shows that the contrast (and therefore the amplitude of ) fits well a behavior for about the first 3 microns, but then stabilises at a constant contrast.
It appears therefore that there are two components to the surface wave amplitude: a rapidly decreasing component at short range followed by a constant component at longer range. Figure 4 shows that extrapolates to (not ) as approaches zero. However, it is well known that grooves exhibit “organ-pipe” phase shifts and amplitude resonances when the effective depth is close to an integer number of quarter wavelengths VLE03 . In order to investigate this contribution to the intrinsic phase we measured the contrast and phase as a function of groove depth. The results are shown in Fig. 6. The contrast indeed shows a maximum near 175 nm groove depth. Around this resonance the phase lag from the groove must be about modulo , and therefore any residual intrinsic phase between and around the groove resonance must be attributed to the phase delay between the surface wave and the directly transmitted wave . Figure 6 indeed shows that this residual phase is close to , the signature phase lag of the CDEW. Phase and amplitude data from the wide-groove studies GAV05 are consistent with results reported here.
We conclude from these phase and amplitude results that the surface waves exhibit both CDEW-like and SPP-like properties. The initial decrease in interference contrast, fitting well a behavior, at small slit-groove distances is consistent with a diffractive surface perturbation at the slit edge. The persistance of essentially constant contrast at slit-groove distances greater than m indicates the presence of an an SPP-like long-lived mode propagating along the surface. It should be noted, however, that the expected wavelength of a pure SPP mode on a plane silver service is nm Raether88 , but the measured (Fig. 4) . The reason for the discrepancy is unclear but this “output-side” determination is consistent with the “input-side” results GAV06 . When the “organ-pipe” phase contributions are taken into account, the results of Fig. 6 indicate that the the persistant SPP-like wave conserves the CDEW signature phase lag of . The detailed nature of the conversion from a diffracted surface wave packet to an SPP guided wave has yet to be explained.

Acknowledgements.
Support from the Ministère délégué à l’Enseignement supérieur et à la Recherche under the programme ACI-“Nanosciences-Nanotechnologies,” the Région Midi-Pyrénées [SFC/CR 02/22], and FASTNet [HPRN-CT-2002-00304] EU Research Training Network, is gratefully acknowledged as is support from the Caltech Kavli Nanoscience Institute and from the AFOSR under Plasmon MURI FA9550-04-1-0434. Discussions and technical assistance from P. Lalanne, R. Mathevet, F. Kalkum, G. Derose, A. Scherer, D. Pacifici, J. Dionne, R. Walters and H. Atwater are also gratefully acknowledged.References
- (1) T. W. Ebbesen, H. J. Lezec, H. F. Ghaemi, T. Thio, and H. J. Wolff, Nature 391, 667-669 (1998).
- (2) T. Thio, K. M. Pellerin, R. A. Linke, T. W. Ebbesen, and H. J. Lezec, Opt. Lett. 26, 1972-1974 (2001).
- (3) H. F. Ghaemi, T. Thio, D. E. Grupp, T. W. Ebbesen, and H. J. Lezec, Phys. Rev. B 58, 6779-6782 (1998).
- (4) C. J. Bouwkamp, Rep. Prog. Phys. 17, 35-100 (1954).
- (5) H. Raether,Surface Plasmons on Smooth and Rough Surfaces and on Gratings, (Springer-Verlag, Berlin, 1988).
- (6) W. L. Barnes, A. Dereux, and T. W. Ebbesen, Nature 424, 824-830 (2003).
- (7) M. J. Treacy, Appl. Phys. Lett. 75, 606-608 (1999).
- (8) M. J. Treacy, Phys. Rev. B 66, 195105-1–195105-11 (2002).
- (9) Q. Cao and P. Lalanne, Phys. Rev. Lett. 88, 057403-1–057403-4 (2002).
- (10) F. J. García-Vidal, H. J. Lezec,, T. W. Ebbesen, and L. Martin-Moreno, Phys. Rev. Lett. 90, 213901-1–213901-4 (2003). Note espeicially Fig. 3 in this reference which shows a transmission resonance at nm and groove depth in the range 175-200 nm, in accord with the results of Fig. 6 reported here.
- (11) S-H. Chang, S. K. Gray, and G. C. Schatz, Optics Express, 13, 3150-3165 (2005).
- (12) H. J. Lezec, and T. Thio, Optics Express 12, 3629-3651 (2004).
- (13) L. Mandel and E. Wolf, Optical Coherence and Quantum Optics, pp. 109-120 (Cambridge University Press, Cambridge England, 1995).
- (14) G. Gay et al., Nature Physics (in press).
- (15) M. W. Kowarz, Appl. Optics 34, 3055-3063 (1995).
- (16) G. Gay, O. Alloschery, B. Viaris, H. Lezec, and J. Weiner (unpublished).