Nonlinear magneto-optical rotation with frequency-modulated light in the geophysical field range
Abstract
Recent work investigating resonant nonlinear magneto-optical rotation (NMOR) related to long-lived () ground-state atomic coherences has demonstrated potential magnetometric sensitivities exceeding for small () magnetic fields. In the present work, NMOR using frequency-modulated light (FM NMOR) is studied in the regime where the longitudinal magnetic field is in the geophysical range (), of particular interest for many applications. In this regime a splitting of the FM NMOR resonance due to the nonlinear Zeeman effect is observed. At sufficiently high light intensities, there is also a splitting of the FM NMOR resonances due to ac Stark shifts induced by the optical field, as well as evidence of alignment-to-orientation conversion type processes. The consequences of these effects for FM-NMOR-based atomic magnetometry in the geophysical field range are considered.
pacs:
07.55.Ge, 32.80.Bx, 42.65.-kI Introduction
Sensitive magnetometers are essential tools in many areas of research, ranging from biology and medicine Ham93 ; Bis03 ; Bis05 to geophysics Joh94 ; Ren88 to tests of fundamental symmetries Mur89 ; Ber95 ; Bea00 ; Rom01 ; Reg02 ; Kor02 . Over the past few decades, magnetometers based on superconducting quantum interference devices (SQUIDs) have been the most sensitive magnetic field sensors Cla93 . In recent years, however, significant technical advances have enabled atomic magnetometers to achieve sensitivities rivaling Ale04 ; Gil01 ; Wei05 ; Bud98 ; Bud00sens ; Bud02 and even surpassing Kom03 that of most SQUID-based magnetometers. Atomic magnetometers have the intrinsic advantage of not requiring cryogenic cooling, and efficient methods for micro-fabrication of atomic magnetometers (with dimensions ) have recently been developed Sch04 ; Balabas05 . Thus atomic magnetometers offer the possibility of compact, affordable, and portable ultra-sensitive magnetic sensors.
The atomic magnetometer with the best short-term sensitivity is the spin-exchange-relaxation-free (SERF) magnetometer whose magnetometric sensitivity exceeds in practice and in principle Kom03 . However, the SERF magnetometer can only achieve optimum sensitivity at fields () because it requires the spin-exchange rate to be much greater than the Larmor precession frequency. Although operation of a SERF magnetometer in an unshielded environment has been demonstrated Sel04 by using a feedback system with three orthogonal Helmholtz coils to null the ambient magnetic field, it operated far from the limit of sensitivity due to imperfect cancelation of magnetic noise (demonstrated sensitivity ). In the present work we demonstrate a technique that enables direct measurement of geophysical-scale fields with sensitivity without requiring feedback coils. Considerable improvement in sensitivity is expected with further optimization.
II Nonlinear Magneto-optical Rotation with Frequency-Modulated Light (FM NMOR)
Our approach to atomic magnetometry Bud98 ; Bud00sens ; Bud02 ; Mal04 has focused on the use of nonlinear magneto-optical rotation (NMOR) NMOEreview related to long-lived () ground-state atomic coherences in alkali vapors. The long coherence times are obtained by containing room-temperature () alkali atoms in evacuated, buffer-gas-free, glass cells with antirelaxation (paraffin) coating on the inner surface Rob58 ; Bou66 ; Ale92 ; Ale02 . The paraffin coating enables atomic ground-state polarization to survive many thousand wall collisions Bou66 , leading to magnetic resonances with widths of Bud98 . It has been demonstrated that this approach offers the possibility of magnetometric sensitivities on the order of in the regime where the Larmor frequency is much less than the relaxation rate of the ground state atomic polarization Bud00sens .
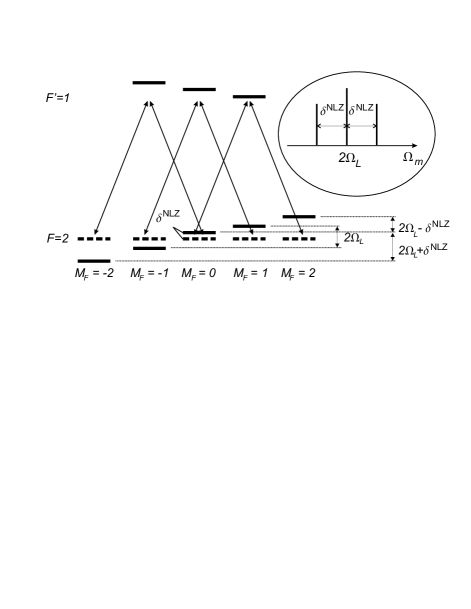
In order to translate the magnetometric sensitivity of NMOR in paraffin-coated cells to magnetic fields where , the technique of NMOR with frequency-modulated light (FM NMOR) was developed Bud02 ; Mal04 , with estimated sensitivities better than . Linearly polarized, frequency-modulated laser light, propagating in the direction of the magnetic field, is used for optical pumping and probing of the ground state atomic polarization. The linearly polarized light, which can be represented as a coherent superposition of left- and right-circularly polarized light, establishes coherences between Zeeman sublevels (Fig. 1). Since in this work the diameter of the laser beam () is much smaller than the vapor cell diameter of 3 cm, the atoms that have interacted with the light subsequently leave the laser beam path and bounce around the cell thousands of times on average before returning to the light beam in the appropriate velocity group. The energies of the Zeeman sublevels are shifted by the magnetic and optical electric field [see Sec. IV] causing the relative phase between the component states of the coherent superposition to evolve according to the time-dependent Schrödinger equation (quantum beats). A subsequent light-atom interaction, once the relative phase between the Zeeman sublevels has evolved, can cause a rotation of the plane of polarization of the light field (see recent reviews NMOEreview ; DynamicNMOEreview ).
Since the laser light is frequency modulated, the optical pumping and probing acquire a periodic time dependence. When the pumping rate is synchronized with the precession of atomic polarization, a resonance occurs and the atomic medium is pumped into a polarized state which rotates around the direction of the magnetic field (synchronous optical pumping Bel61a ). Consequently, the optical properties of the medium are modulated at the quantum-beat frequency, leading to modulation of the angle of the light polarization. If the time-dependent optical rotation is measured at the first harmonic of the modulation frequency , ultra-narrow resonances are observed at near-zero magnetic fields, and at fields where the modulation frequency is a subharmonic of one of the quantum-beat frequencies of the system Bud02 ; Mal04 ; Yas03 . It should be noted that this technique yields a scalar magnetometer: the precession frequency is dependent only on the magnitude of the magnetic field and not its direction. For light propagation that is not collinear with the magnetic field, broad, asymmetric resonances are observed at the same frequency as for propagation parallel to the magnetic field. At low magnetic fields and low light power, the quantum-beat frequency for a coherence between two ground-state sublevels differing in magnetic quantum number by is , where is the Landé factor for a particular hyperfine component. Here we specialize to the ground state of the alkali atoms, for which, neglecting the nuclear magnetic moment, for , where is the Landé factor for the electron and is the nuclear spin. In the range of geophysical fields and high light powers there are small corrections to the quantum-beat frequency, as discussed in Sec. IV. In the present work we concentrate on the signals obtained when . Such signals are dominated by the precession of the quadrupole moment (atomic alignment) associated with coherences, see Refs. Yas03 ; Roc01 ; NMOEreview . Higher order multipole moments were studied in Refs. Yas03 and Pustelny .
III Experimental Apparatus
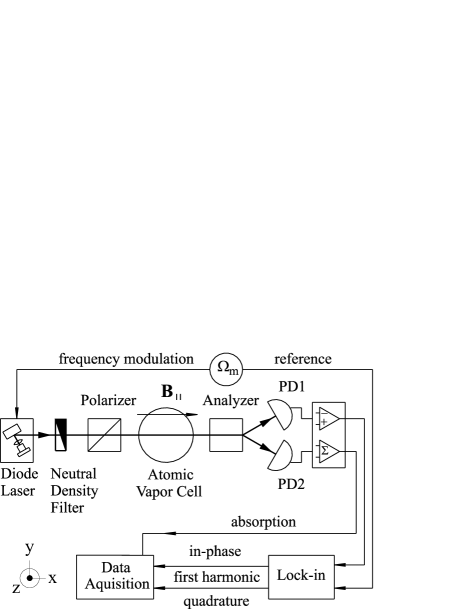
Figure 2 shows a schematic of the experimental apparatus. Linearly polarized light propagates along the direction of the magnetic field, through a spherical, paraffin-coated cell, with a diameter of 3 cm, containing an isotopically enriched sample of 87Rb ( by number, atomic density of at C). The polarization of the forward-scattered light is monitored using a Rochon polarizing beam splitter and two photodiodes. The cell is contained within a four-layer ferromagnetic shield system with shielding factor in all directions, described in detail in Ref. Yas99 . Inside the innermost shield layer is a set of seven coils that control the dc magnetic fields (, , ) and first-order gradients (, , ), as well as the second-order gradient along the direction of light propagation () in which the largest field is applied. The , , and coils are rectangular in shape, matching the shape of the innermost shielding layer so that image currents in the shields make the coils appear infinitely long, yielding a field uniform to about a part in over the region of the cell. The effect of magnetic-field gradients is reduced due to motional averaging because in the evacuated paraffin-coated cells the atoms bounce off the walls, traversing the cell many times between the pump and probe interactions. Nevertheless, we find that residual gradients contribute to broadening of the FM NMOR resonance at a level comparable to the effects of power broadening over the range of magnetic fields studied here.
The frequency of the light from a diode laser (New Focus, Vortex 6000) is modulated with an amplitude of (unless stated otherwise) by sinusoidally varying the diode current at frequencies of the order of kHz in this work. The optimum modulation amplitude should be on the order of the Doppler-broadened width Bud02 , but in general is a complicated function of other parameters such as light power and detuning Balabas05 . The central frequency of the laser is tuned to the low frequency side of the hyperfine component of the 87Rb D1 transition, and stabilized using a dichroic atomic vapor laser lock Yas00 . The typical light power used in these experiments ranged from to 1.0 mW.
IV Splitting of the FM NMOR Quadrupole ( coherence) resonance: Nonlinear Zeeman effect and ac Stark shifts

The upper traces in Fig. 3 show the dependence of the amplitude of the time-dependent optical rotation signal on modulation frequency in the vicinity of the resonance for . Solid symbols represent the component in-phase with the light modulation, hollow symbols represent the component out-of-phase (quadrature) with the light modulation. At the low magnetic fields investigated in previous FM NMOR studies Bud02 ; Mal04 ; Yas03 , a single, unsplit, dispersive (absorptive) feature was seen in the in-phase (quadrature) component. These data demonstrate that in the geophysical field range, the FM NMOR signals for take on a more complicated shape, the result of three separate resonances corresponding to the three Zeeman coherences created in the ground state (Fig. 1). The quantum beat frequency associated with each of these coherences has been shifted slightly due to the combined action of the nonlinear Zeeman effect (mixing of different ground hyperfine states by the magnetic field) and the differential ac Stark shift (mixing of the excited state with the ground state by the optical electric field). Overlaying the in-phase (quadrature) data in Fig. 3 is a fit to a sum of three dispersive (absorptive) Lorentzians. The lower traces in Fig. 3 show the in-phase component of each resonance separately.
We first consider the low light power limit where the shift in resonance frequencies of the three coherences is primarily due to the nonlinear Zeeman effect. Neglecting the contribution of the nuclear magnetic moment to the Zeeman effect, in sufficiently weak magnetic fields (where and is the energy separation between the hyperfine levels) the energy of a particular ground-state Zeeman sublevel of an alkali atom with nuclear spin is approximately given by a perturbative expansion of the Breit-Rabi formula (see, for example, Ref. Sobelman ):
| (1) |
where is the energy of the hyperfine level and for 87Rb and we have set . Hence, the quantum-beat frequency of the three different coherences is
| (2) | |||||
where . Note that the central resonance is unchanged by the nonlinear Zeeman effect because the states are shifted by the same amount. For later convenience, we denote the “lower”, “central” and “upper” satellite resonances as those occurring at , , and , respectively.
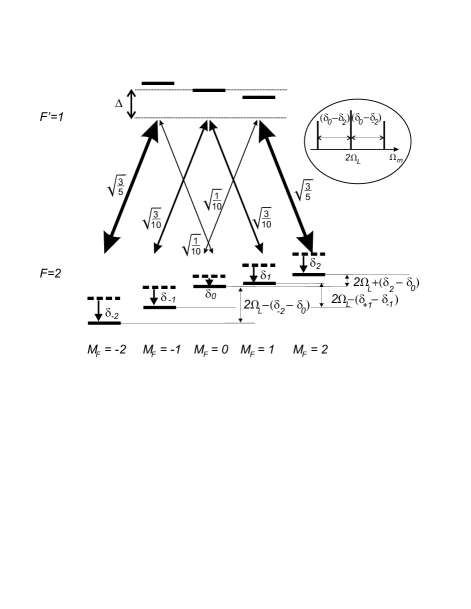
We now turn to the discussion of the differential ac Stark shift, shown schematically in Fig. 4. This effect arises because of 1) differing strengths of the transition dipole moments from various ground state sublevels to the excited state, and 2) differences in optical detuning for the different hyperfine ground states due to the magnetic field dependence of the ground state energy levels. A complete treatment of the ac Stark shifts necessitates a density matrix calculation to account for optical pumping and the subsequent magnetic field induced evolution into and out of bright and dark states, and is complicated by Doppler broadening, the modulation of the light frequency and the fact that the atoms bounce into and out of the light. However, some insight can be gained from a heuristic approach, ignoring these issues and the fact that all laser-induced transitions are coupled. In this case the ac Stark shift of a two level system is well approximated by
| (3) |
where is the relevant dipole matrix element, is the optical electric field, is the detuning from optical resonance and is the optical linewidth. Neglecting the magnetic-field induced dependence of the detuning on the magnetic quantum number , the shift of the ground state depends only on the strength of the relevant dipole matrix element so that . However, in the Earth field range, the difference in detuning of the ground state energy levels is significant compared to the natural linewidth, yielding an asymmetry in the shifts .
Including both the ac Stark shift and the nonlinear Zeeman effect, the resonance frequencies for the three different coherences are given by
| (4) | |||||
For detuning to the low frequency side of the optical transition, the ground state shifts are negative, as indicated in Fig. 4. Under the assumption that the detuning does not change too drastically over the manifold, and hence the shift due to the differential ac Stark effect is in the same direction as the shift due to the nonlinear Zeeman effect. For detuning to the high frequency side of the optical resonance, the sign of the differential ac Stark shift reverses, indicating that it is primarily off-resonant interaction with the excited state responsible for this effect. Since the optical detuning is greater for the state than by , , yielding an asymmetry in the shift of the upper and lower satellite resonances. Likewise, resulting in a small shift of the central resonance.

A density matrix calculation of FM NMOR on a transition for atoms in an uncoated cell (where evolution in the dark can be ignored), neglecting Doppler-broadening, reproduces the salient features of the experimental data. This numerical calculation extends our previous analytic calculation Mal04 to arbitrary light intensities and angular momenta using the method of Ref. Nayak85 . The Hamiltonian for the modulated light-field interaction and the linear and quadratic Zeeman shifts is written under the rotating-wave approximation, neglecting terms counter-rotating at the optical frequency. The density-matrix evolution equations are then formed, including terms describing spontaneous decay of the upper state at a rate , and atoms entering and leaving the interaction region (transit relaxation) at a rate . The equations are solved for the Fourier components of the density matrix using the matrix-continued-fraction method: a recursion relation for the Fourier components is inverted as a continued fraction that can be evaluated to any desired accuracy by truncation (to be described in detail in a future publication). The resulting optical rotation signal as a function of modulation frequency is shown in Fig. 5 for parameters similar to those in experimental conditions. The resonant features have the same shape as seen in Fig. 3, including the small asymmetry between the upper and lower resonances. In addition, the numerically calculated splittings have a linear dependence on light power, as in Fig. 6.

It is difficult to distinguish between shifts of the central resonance and actual drifts of the magnetic field, and hence we address experimentally only the difference in frequency between the central and satellite resonances, and . The top panel of Fig. 6 shows the average of the splitting between the central resonance and the upper and the lower satellite resonances for several magnetic fields. Overlaying each data set is a linear fit. We find that the average ac Stark shift is 108 Hz/mW. The offset from zero of each curve in the top panel of Fig. 6 is due to the nonlinear Zeeman effect. We plot this offset in the bottom panel of Fig. 6. The solid line is the prediction of Eq. (2), . A least squares fit to these data using a purely quadratic model function yields , in agreement with the theoretical value . We found that was approximately linear in both the magnetic field and light power, and the sign of the asymmetry was consistent with detuning to the low side of the optical resonance by more than one linewidth. At the highest light power and magnetic field investigated in this work, . We return to the consequences of this asymmetry for atomic magnetometry in Section VII.

V Light-Power Dependence of FM NMOR Resonance Amplitude
The top and bottom panels of Fig. 7 show the width and amplitude, respectively, of the in-phase component of the central FM NMOR resonance as a function of light power for several magnetic fields. In order to compare with earlier work Budker2005 , the width here is defined by the distance from the center of the dispersive resonance as a function of to the maximum of the rotation angle widthdefinition . The amplitude of the central resonance reaches a maximum of about 0.5 mrad at approximately , independent of magnetic field. In addition to power broadening, there appears to be an extra source of relaxation that increases with magnetic field. We attribute this effect to high order magnetic field gradients for which we cannot compensate with the current experimental setup. At lower magnetic fields , by careful zeroing of first order magnetic field gradients, it was possible to achieve widths extrapolated to zero power consistent with the best obtained with this cell at 0.15 mG corresponding to 3.5 Hz Budker2005 . Finally, we note that the satellite resonances experience slightly greater light broadening than the central resonance due to different strengths of the transition dipole moments. First order perturbation theory predicts a ratio of 3:4 between the width of the central resonance and width of the satellite resonances, in agreement with our measurements.
VI Alignment-to-orientation conversion (AOC)
In the presence of both the magnetic field and the ac Stark shift due to the optical electric field, the atomic alignment induced by optical pumping can be converted to an orientation (dipole moment) parallel to the magnetic field, a process known as alignment-to-orientation conversion (AOC) AOCRefs ; Balabas05 . A static orientation along the magnetic field leads to optical rotation via circular birefringence which is maximal when the light is tuned to resonance. Thus as the light frequency is periodically tuned closer and further from the resonance, the amplitude of rotation due to the static orientation increases and decreases in phase with the light frequency modulation. To illustrate the effect of AOC, we plot the ratio of the amplitude of the in-phase and quadrature components as a function of light power in Fig. 8 for modulation depths of 40 MHz and 120 MHz. For a modulation depth of 40 MHz (circles and triangles), we find that the amplitude of the quadrature component decreases relative to the in-phase component as the light power increases, independent of the magnetic field, indicating the presence of alignment-to-orientation conversion. This effect is reduced dramatically for data taken with a modulation depth of 120 MHz, consistent with results presented in Ref. Balabas05 . The simplest explanation for this behavior is that at higher modulation depths, the light field is, on average, further from resonance, leading to smaller ac Stark shifts. However, the observed ac Stark shifts were similar for data sets with both large and small modulation depths. Further work will be necessary to fully understand AOC with frequency modulated light.

VII Atomic magnetometry in the geophysical field range
The sensitivity to magnetic fields is given by
| (5) |
where is the amplitude of the synchronously detected optical rotation angle and is the angular sensitivity of the polarimeter. In the present work, we scan the modulation frequency rather than the magnetic field, so to interpret the results given here in the context of atomic magnetometry, we write
| (6) |
Here for , where is the amplitude and is the width of the resonance, so that
| (7) |
The shot noise limited angular sensitivity of a polarimeter for of radiation at 795 nm is about . At this light power and neglecting broadening due to magnetic field gradients, we assume a width of about . Inserting these numbers into Eq. (7) we get
| (8) |
This falls somewhat short of the sensitivity estimate of Bud02 derived from measurements performed at roughly 1 mG. The largest factor contributing to the reduced sensitivity is the use of a 3 cm diameter cell rather than a 10 cm cell which yielded a larger optical depth and FM NMOR resonance widths of about 1 Hz. Additional contributions to the higher sensitivity reported in Ref. Bud02 come from the fact that the splitting of the FM NMOR resonance was much less than its width. Hence three different coherences contributed to the slope of the optical rotation signal as a function of magnetic field. While there is little that can be done about the separation of the resonance frequencies for a given atom at high magnetic field, we anticipate considerable improvement with further optimization of parameters such as light power, modulation depth, detuning of the central optical frequency, cell size and temperature. Unfortunately, environmental magnetic noise (the current sources used to generate the magnetic field are only stable to about a part in ) prevents a demonstration of sensitivity in the Earth-field range beyond the level of about .
We now briefly address the issue of the shift of the central resonance due to the magnetic-field induced asymmetry in optical detuning. We first make the assumption that we are detuned to the low frequency side of the optical resonance by more than one linewidth, and that is much less than the optical linewidth. Under these conditions because the relevant transition dipole matrix elements differ by a factor of (see Fig. 4) and the difference in detuning between the sublevels is twice as great as for the sublevels. Making use of this fact we see that Hence the central resonance is shifted from by only 10 Hz out of 700 kHz at the highest magnetic field and light power in this work. In principle, it should be possible to account for this in a practical device.
VIII Conclusions
We have performed an experimental investigation of nonlinear magneto-optical rotation with frequency-modulated light (FM NMOR) resonances in the geophysical field range. We have observed a splitting of the usual quadrupole FM NMOR resonance into three distinct resonances by the nonlinear Zeeman effect as well as by the ac Stark shift. Our measurements of the nonlinear Zeeman effect are in good agreement with theoretical predictions. The combined effects of the ac Stark shift and the linear Zeeman effect lead to an asymmetry in the splitting of the FM NMOR resonance. Evidence for alignment-to-orientation conversion has been presented. Finally, based on the measurements described here, we estimate a sensitivity to magnetic fields based on FM NMOR resonances of and we anticipate significant improvement with further optimization.
Acknowledgements.
The authors would like to thank A.I. Okunovich and J. Higbie for useful discussions. This work is supported by DOD MURI grant # N-00014-05-1-0406, by NSF grant # INT-0338426, by DoD and NASA STTR programs by the European Social Fund and by the Polish Ministry of Education and Science.References
- (1) M. Hämäläinen et al., Rev. Mod. Phys. 65, 413-97 (1993).
- (2) G. Bison, R. Wynands, and A. Weis, Appl. Phys. B 76(3), 325-328 (2003).
- (3) G. Bison, R. Wynands, and A. Weis, J. Opt. Soc. B 22(1), 77-87 (2005).
- (4) M. J. S. Johnston, R. J. Mueller, and Y. Sasai, Bull. Seismological Soc. Am. 84(3), 792-8 (1994).
- (5) P. R. Renne and T. C. Onstott, Science 242, 1152-5 (1988).
- (6) S. A. Murthy, D. Krause, Z. L. Li, and L. R. Hunter, Phys. Rev. Lett. 63(9), 965-968 (1989).
- (7) C. J. Berglund et al., Phys. Rev. Lett. 75(10), 1879-1882 (1995).
- (8) D. Bear, R. E. Stoner, R. L. Walsworth, V. A. Kostelecky, and C.D. Lane, Phys. Rev. Lett. 85(24), 5038-5041 (2000).
- (9) M. V. Romalis, W. C. Griffith, J. P. Jacobs, and E. N. Fortson, Phys. Rev. Lett. 86(12), 2505-2508 (2001).
- (10) B. C. Regan, E. D. Commins, C. J. Schmidt, and D. DeMille, Phys. Rev. Lett. 88(7), 071805 (2002).
- (11) T. W. Kornack and M. V. Romalis, Phys. Rev. Lett. 89, 253002 (2002).
- (12) J. Clarke in The New Superconducting Electronics, edited by H. Weinstock and R.W. Ralston, pp. 123-180 (Kluwer Academic, The Netherlands, 1993).
- (13) E. B. Alexandrov, M. V. Balabas, A. K. Vershovski, and A. S. Pazgalev, Technical Physics 49(6), 779-783 (2004).
- (14) H. Gilles, J. Hamel, and B. Cheron, Rev. Sci. Instrum. 72(5), 2253 (2001).
- (15) A. Weis and R. Wynands, Optics and Lasers in Engineering 43(3-5), 387-401 (2005).
- (16) D. Budker, V. Yashchuk, and M. Zolotorev, Phys. Rev. Lett. 81, 5788 (1998).
- (17) D. Budker, D. F. Kimball, S. M. Rochester, V. V. Yashchuk, and M. Zolotorev, Phys. Rev. A 62, 043403 (2000).
- (18) D. Budker, D. F. Kimball, V. V. Yashchuk, and M. Zolotorev, Phys. Rev. A 65, 055403 (2002).
- (19) I. K. Kominis, T. W. Kornack, J. C. Allred, and M. V. Romalis, Nature 422, 596 (2003).
- (20) P. D. D. Schwindt et al., Appl. Phys. Lett. 85(26), 6409-6411 (2004).
- (21) M.V. Balabas et al., arXiv:physics/0511003.
- (22) S. J. Seltzer and M. V. Romalis, Appl. Phys. Lett. 85(20), 4804-4806 (2004).
- (23) Y. P. Malakyan, S. M. Rochester, D. Budker, D. F. Kimball, and V. V. Yashchuk, Phys. Rev. A 69(1), 013817 (2004).
- (24) D. Budker, W. Gawlik, D. F. Kimball, S. M. Rochester, V. V. Yashchuk, and A. Weiss, Rev. Mod. Phys. 74, 1153 (2002).
- (25) H. G. Robinson, E. S. Ensberg, and H. G. Dehmelt, Bull. Am. Phys. Soc. 3, 9 (1958).
- (26) M. A. Bouchiat and J. Brossel, Phys. Rev. 147, 41 (1966); M. A. Bouchiat, Ph. D. Thesis, University of Paris, 1964.
- (27) E. B. Alexandrov and V. A. Bonch-Bruevich, Opt. Engin. 31, 711 (1992).
- (28) E. B. Alexandrov, M. V. Balabas, D. Budker, D. English, D. F. Kimball, C.-H. Li, and V. V. Yashchuk, Phys. Rev. A 66, 042903 (2002).
- (29) E. B. Alexandrov, M. Auzinsh, D. Budker, D. F. Kimball, S. M. Rochester, and V. V. Yashchuk, J. Opt. Soc. Am. B 22(1), 7-20 (2005).
- (30) W. E. Bell and A. L. Bloom, Phys. Rev. Lett. 6, 280 (1961).
- (31) V. V. Yashchuk, D. Budker, W. Gawlik, D. F. Kimball, Yu. P. Malakyan, and S. M. Rochester, Phys. Rev. Lett. 90, 253001 (2003).
- (32) S. Rochester and D. Budker, American Journal of Physics, 69(4), 450-4 (2001).
- (33) S. Pustelny et al., arXiv:physics/0511123
- (34) V. Yashchuk, D. Budker and M. Zolotorev, in Trapped Charged Particles and Fundamental Physics AIP Conference Proceedings 457, edited by D.H.E. Dubin and D. Schneider (American Institute of Physics, New York, 1999), pp. 177-181.
- (35) V. V. Yashchuk, D. Budker and J. R. Davis, Rev. Sci. Inst. 71, 341 (2000).
- (36) I. I. Sobelman, Atomic spectra and radiative transitions. (Springer-Verlag, Berlin, 1992).
- (37) N. Nayak and G. S. Agarwal, Phys. Rev. A 31, 3175 (1985).
- (38) D. Budker, L. Hollberg, D. F. Kimball, J. Kitching, S. Pustelny, V. V. Yashchuk, Phys. Rev. A 71, 012903 (2005).
- (39) In work reported in Ref. Budker2005 , the magnetic field, rather than the modulation frequency, was scanned and the width was defined by where was the distance between the extrema of the dispersive resonance. In this work we scan the modulation frequency and the resonance occurs at, , and hence we quote the distance from the center to the maximum of the dispersive signal as a function of .
- (40) M. Lombardi, J. Physique 30, 631 (1969), C. Cohen-Tanoudji and J. Dupont-Roc, Opt. Commun. 1, 184 (1969), R.. HIlborn, Am. J. Phys. 63, 330 (1995), D. Budker, D.F. Kimball, S.M. Rochester, and V.V. Yashchuk, Phys. Rev. Lett 85, 2088 (2001).