Direct imaging of periodic sub-wavelength patterns of total atomic density
Abstract
Interference fringes of total atomic density with period and for optical wavelength , have been produced in de Broglie atom interferometer and directly imaged by means of an “optical mask” technique. The imaging technique allowed us to observe sub-wavelength periodic patterns with a resolution of . The quantum dynamics near the interference times as a function of the recoil phase and pulse areas has been investigated.
An interferometer based on the interaction of a pair of off-resonant standing wave pulses (made from laser fields with wavelength ) with a cold gas of Rb atoms Cahn97 has been shown to be capable of precision measurement of the atomic recoil frequency, and inertial forces such as gravity Snadden98 -Lenef97Gustavson97 .
If the standing-wave pulses in this interferometer are separated by time , theory predicts that at times for positive integer , fringe patterns of the total atomic density of period should appear Dubetsky94 . Such fringes are the manifestation of matter-wave diffraction Dubetsky84 ; Batelaan97 . Evidence of these period gratings has been observed indirectly in Ref. STKS02 by use a backscattering technique in a heterodyne arrangement, but no direct observation of small-period fringes has been made until now.
To observe such small period structures directly, we have developed a real-time imaging technique for 85Rb atoms Turlapov03 . This “optical mask” Abfalterer97Keller98 ; Johnson98 technique, was applied to atoms of 85Rb initially prepared in the ground hyperfine level . An “optical mask” is a standing wave (SW) resonant to the transition (5S5P3/2, nm). For a pulse of sufficient intensity and duration, atoms not located at the nodes of the SW are optically pumped into the F=2 level. For imaging the density at a particular time, a “detection sequence” is applied, consisting of an optical mask followed by a traveling wave pulse tuned to the closed transition =4. Atoms left unpumped at the nodes following the mask pulse are counted by observation of fluorescence in the traveling wave. The fluorescent signal is proportional to the density at the nodes just before the application of the imaging mask. To map out the density as a function of position, the initial density profile is reproduced and the measurement repeated with various locations of the detection mask node within the mask period of .
In this work we applied the “optical mask” technique to directly image the fringe structures in an atom interferometer consisting of two off-resonant SW pulses separated by a time , each consisting of two linearly polarized traveling waves blue detuned from the transition. Each SW pulse acts as a phase grating for the atoms. These phase gratings do not change the internal state of an atom, but only alter its center of mass. A given initial atomic momentum state is split into a superposition of momentum states differing by twice the photon momentum. This superposition results in a evolving fringe pattern that washes out due to a spread in the initial momentum distribution of the atoms. The second pulse results in removal of the initial momentum dependence of the gratings at various times (referred to as echo’s). The times of the echoes can be predicted by a classical analysis, but the size and shape of the fringes can only be understood in terms the quantum behavior.
At times close to the echo time , one expects to find a periodicity in the atomic density of because the minimum difference between the momenta of interfering states is , where is a grating vector for a SW consisting of two traveling waves ().
A simple interference signal calculation (assuming Raman-Nath regime), which only takes into the account the lowest spatial harmonic of the density grating is presented in Ref. STKS02 . We can extend this result to include all harmonics by writing the resulting density as a Fourier series:
| (1) |
where the th Fourier harmonic is built up by interfering matter waves whose momenta differ by recoils after the second SW. Because of Doppler dephasing, gratings occur only near echo times
| (2) |
where , is an integer, and . Near a given echo time , the amplitude of the th Fourier harmonic of the density for is given by
| (3) |
where the recoil phases: , . Here are pulse areas, , where is a two photon Rabi frequency and are the pulse durations. The recoil frequency , and is the spread in initial velocities.
A density pattern of period at an echo point can be obtained by letting , where positive integers and are expressed in lowest terms, and the sum in Eq. (1) only includes values of for which both and are integers. We get the corresponding echo time .
In our experiments we consider only the primary echoes for which . From Eqs. (1)-(Direct imaging of periodic sub-wavelength patterns of total atomic density), one can get the general expression for the spatial profile of the total atomic density grating of period formed at the echo time :
| (4) | |||
Because of the exponential term in the sum, for small periodicity ( with ) only the first harmonic contributes significantly to the signal. However for small (for example periodicity at time ) higher harmonics also contribute to the signal and define its spatial profile.
Further look at Eq. (Direct imaging of periodic sub-wavelength patterns of total atomic density) shows periodic behavior of the atomic density as a function of with the period s. This behavior was first observed in Cahn97 . It is interesting to look at the time dependence of the density at the echo time around for . From Eq. (Direct imaging of periodic sub-wavelength patterns of total atomic density) we get at all times except when (for integer ), in which case , which shows the significance of the recoil phase. Also there are no interference fringes at exactly the echo times, only an atomic phase modulation exists at these times. This is in a contrast to the situation for absorptive gratings Weitz04 ; Turlapov05 , in which the interference fringes have maximum amplitude exactly at the echo times. The above expressions can also be used to estimate the temperature of the trapped atoms (), since the duration of the signal is .
In the experiment 85Rb atoms are prepared from a vapor in a MOT. The experiment is done in the time domain with pulsed laser fields and repeated every 50 ms. The experimental setup and the time diagram of the experiment are shown in Fig. 1.
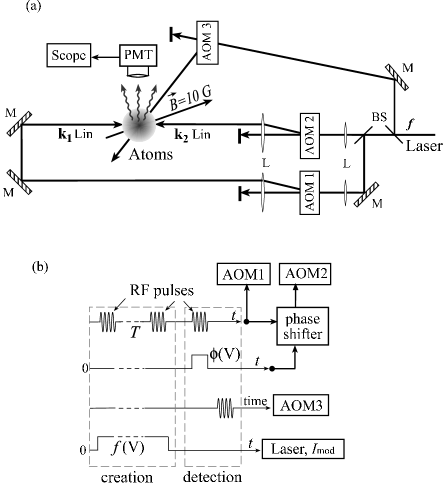
At times and two off-resonant standing-wave pulses (SW1, SW2) are applied with typical pulse durations of 200–480 ns. The pulses are blue-shifted from the closest transition of 85Rb by a detuning () that varied from 30 MHz to 105 MHz ( 5 to 18 excited state linewidths correspondingly). With this detuning, less than 5 % of the atoms spontaneously emit during each pulse. The SW pulses are composed of two counter-propagating traveling waves and with the intensity in each beam 200 mW/cm2, which are switched on and off independently by two acousto-optic modulators (AOMs), driven by a common 220 MHz rf oscillator.
The density grating of the atomic cloud is probed around specific echo times by a detection sequence consisting of an optical mask SW pulse followed by a weak traveling wave (aligned in the horizontal plane at an angle to the mask beams) for measuring the fluorescence. The optical mask standing wave is produced by the same optics that produce the off-resonant standing waves. To shift the frequency of the SWs between different phases of the experiment, we modulated the laser current. Each of the traveling waves making up the optical mask has horizontal linear polarization and an intensity of 40 to 120 mW/cm2. The nodes of the optical mask are shifted relative to the nodes of the off-resonant SWs by a phase change of the rf feeding one of the AOMs. The read-out field on the cycling transition is pulsed by a separate AOM. The use of the same optics for both sets of pulses allowed us to minimize the phase drift during a single repetition of the experiment. In our experiment, both off-resonant SWs used to create the pattern have the same pulse areas . However one can mimic by varying recoil phase (), since the density function [Eq. (Direct imaging of periodic sub-wavelength patterns of total atomic density)] is periodic in both the recoil phase and the pulse area.
In Fig. 2 we plot the spatial structures with the period , observed at the time .
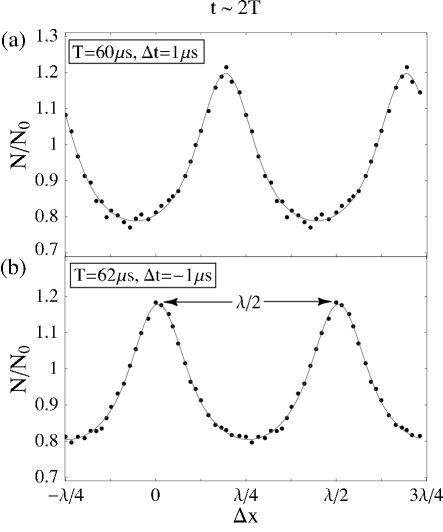
To maximize visibilities of the fringes the data were taken with slightly different values of the recoil phase () for the two graphs with pulse area fixed. There is a phase shift of between the two fringe patterns taken for opposite (up to a systematic shift in the phase calibration over the several day interval between two data sets). This phase shift is a characteristic feature of atomic density patterns created with optical phase gratings and it is predicted by the theory. The data on the graphs are normalized to the uniform atomic density distribution obtained when no off-resonant SWs are applied prior to the imaging sequence. The atomic loss is represented by the parameter obtained from the model fit to the data. In the ideal case of no atomic loss , in practice it is 6% – 13% less than that. The background due to stray photons (no atoms present in the MOT) is subtracted.
All the data are fitted by a model function (curve in Fig. 2), that is the convolution of Eq. (Direct imaging of periodic sub-wavelength patterns of total atomic density) with a Gaussian transmission function representing the effect of the optical mask Turlapov03 . The model function allows one to determine important parameters, such as the pulse area , the width of the optical mask , and an atomic loss . The temperature of the atoms can be deduced given that (from the fit) the Doppler broadening term is s, corresponding to a temperature of K.
The particular choice of the pulse area and the separation between the pulses was chosen to maximize the visibility of the fringes, which is defined by . For the data in Fig. 2 the signal visibility is (a) and (b). The atomic density visibility, however, is (determined by effectively deconvolving the optical mask transmission function from the signal).
By combining several cross-sections of spatial profiles with period , each taken at a different value of , one can directly view the dynamics of the interference fringes, reconstructing effectively a “two-dimensional” profile of the atomic density, where one coordinate is a time and the other is a spatial phase . In Fig. 3 we present such plots. Fig. 3(a) represents the interpolation of the data, taken for
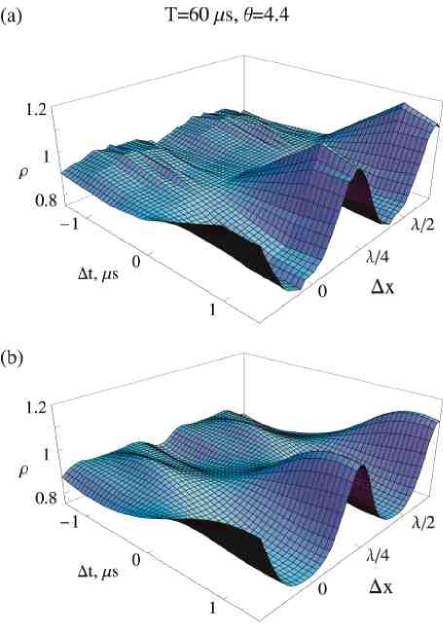
, and repeated with the period . Part (b) shows the corresponding theoretical function for the atomic density [Eq. (Direct imaging of periodic sub-wavelength patterns of total atomic density)] convolved with the optical mask transmission function. The data show asymmetric behavior of the fringe pattern around time because of particular choice of the recoil phase close to at a fixed pulse area.
We have also directly observed the spatial profile of an atomic fringe pattern with sub-wavelength period (here ). In this experiment the imaging sequence was applied at and the intensities of the pulses were the same as for the data in Fig. 2. The duration of the pulses were adjusted to maximize the contrast of the signal.
The resulting atomic density patterns are shown in Fig. 4.
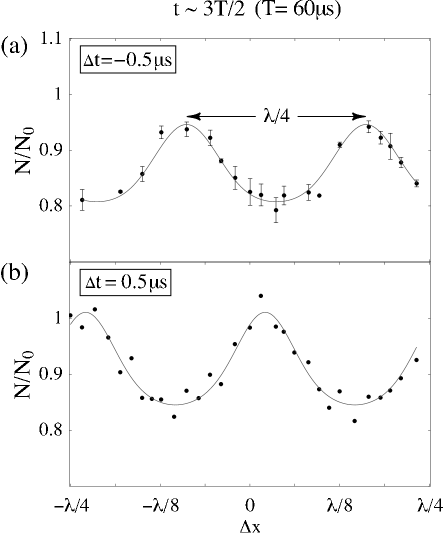
The observed sub-wavelength period structures have lower visibility than for the density of period , due to the fact that interfering trajectories with high number of the recoils have lower amplitudes. Also for the (here ) period patterns, maximum visibility occurs at smaller than for due to more quickly decaying term in the expression for the total atomic density Eq. (Direct imaging of periodic sub-wavelength patterns of total atomic density). The maximum visibility of the signal, , is obtained for s, T=60s [see Fig. 4(b)]. For Fig. 4(a) and (b) visibilities of the signals are . By taking into the account the instrumental resolution of the mask, we compute the visibilities in atomic density to be and correspondingly.
The fringe patterns at times and also have a relative phase shift of (between (a) and (b) parts of Figs. 4). The atomic density with sub-wavelength period ( and smaller) has slightly different dynamics around than the period fringes. For the recoil phase is equal to an integer multiple of , for the density function behaves as . This is a manifestation of quantum behavior of the atomic center of mass, and any spatial modulation of the signal is extremely difficult to observe for such conditions.
It is worth pointing out, in contrast to the experiments with the absorptive light masks Turlapov05 , the atom losses from the phase gratings used in this experiment are very small for the data presented. To date, we have produced patterns with period although smaller periodicities could be obtained in a similar fashion up to the ultimate resolution of the optical mask imaging technique of .
To conclude, we have directly observed and investigated atomic gratings of total atomic density with period for in an atom interferometer.
We are grateful to A. Turlapov for useful discussions.
References
- (1) S. B. Cahn, et al., Phys. Rev. Lett. 79, 784 (1997).
- (2) M. J. Snadden, et al., Phys. Rev. Lett. 81, 971 (1998).
- (3) D. S. Weiss, B. C. Young, and S. Chu, Phys. Rev. Lett. 70, 2706 (1993); D. S. Weiss, B. C. Young, and S. Chu, Appl. Phys. B 59, 217 (1994).
- (4) J. Schmiedmayer, et al., Phys. Rev. Lett. 74, 1043 (1995).
- (5) Alan Lenef, et al., Phys. Rev. Lett. 78, 760, 1997; T. L. Gustavson, P. Bouyer, and M. A. Kasevich, Phys. Rev. Lett. 78, 2046, 1997.
- (6) S. Fray, C. A. Diez, T. W. Hansch, and M. Weitz, Phys. Rev. Lett. 93, 240404 (2004).
- (7) A. Turlapov, A. Tonyushkin, and T. Sleator, Phys. Rev. A 71, 043612 (2005).
- (8) B. Dubetsky and P. R. Berman, Phys. Rev. A 50, 4057 (1994).
- (9) B. Dubetsky, et al., JETP Lett. 39, 649 (1984); V. P. Chebotaev, et al., J. Opt. Soc. Am. B 2, 1791 (1985).
- (10) H. Batelaan, et al., in Atom Interferometry, ed. P. R. Berman (Academic Press, Cambridge, 1997).
- (11) D. V. Strekalov, et al., Phys. Rev. A 66, 023601 (2002)
- (12) A. Turlapov, A. Tonyushkin, and T. Sleator, Phys. Rev. A 68, 023408 (2003).
- (13) R. Abfalterer, et al, Phys. Rev. A 56, R4365 (1997); C. Keller, et al, J. Vac. Sci. Tech. B 16, 3850 (1998).
- (14) K. S. Johnson, et al, Science 280, 1583 (1998).