Temperature dependent anti-Stokes/Stokes ratios under Surface Enhanced Raman Scattering (SERS) conditions
Abstract
We make systematic measurements of Raman anti-Stokes/Stokes (aS/S) ratios using two different laser excitations (514 and 633 nm) of rhodamine 6G (RH6G) on dried Ag colloids over a wide range of temperatures (100 to 350 K). We show that a temperature scan allows the separation of the contributions to the aS/S ratios from resonance effects and heating/pumping, thus decoupling the two main aspects of the problem. The temperature rise is found to be larger when employing the 633 nm laser. In addition, we find evidence for mode specific vibrational pumping at higher laser power densities. We analyze our results in the framework of ongoing discussion on laser heating/pumping under SERS conditions.
pacs:
78.67.-n, 78.20.Bh, 78.67.Bf, 73.20.MfI Introduction
Despite rapid progress on Surface Enhanced Raman Scattering (SERS)Moskovits ; Otto towards applications SmithScreen ; MinoScreen ; MirkinDiog ; KneippIntra , many fundamental questions remain open. An important issue –that has been the subject of controversy– relates to whether the local enhanced electromagnetic (EM) fields cause local heating and/or vibrational pumping. This is important for reasons that range from the purely practical (damage to analytes under study) to the more fundamental (vibrational pumping). In certain cases, plasmon-related heating effects may even be usefulHalasTreat for biomedical applications, but both the magnitude of the effect and how to control it need proper characterization. It is possible to use the aS/S ratio under SERS conditions to study heating/pumping effects with certain limitations, as we discuss in detail below.
The laser power dependence of the aS/S- ratio was thought to provide strong evidence for SERS pumping Kneipp1 , but this has been the source of controversy and alternative explanations have been offeredMCE1 ; Brolo ; Haslett ; HPdef . Contributions to the aS/S-ratio can be complex and include: heating, pumping, and resonance effects. There are various hints for heating in SERS and the anomalous ratio (commonly measured even at low powers) was predicted to relate to hidden resonances in the systemBrolo ; Haslett . We have recently demonstrated that it is indeed possible to use the aS/S ratio to map out roughly the underlying resonance in certain casesMaherResonance .
Here we develop the use of aS/S-ratios further; we expand and provide additional evidence to recent discussions in Refs. HPdef ; RobFaraday . We demonstrate how to separate heating from resonance effects through temperature dependent data. We find a temperature rise at low laser powers ( 0.5 mW on a 1.5 m (diameter) spot) that depends on laser energy. We find evidence also suggesting the existence of mode specific vibrational pumping at higher laser power densities and low temperature.
II General considerations
For the sake of clarity we shall repeat the essential details of the discussion presented in Refs.HPdef ; RobFaraday keeping details to a minimum. We call the temperature of the local environment (substrate + ambient surrounding the sample), while is room temperature, the temperature of the metal colloids, and the temperature of the molecule. The main possible scenarios are:
-
1.
No heating. The whole system is in thermal equilibrium; i.e. .
-
2.
Global heating: system in thermal equilibrium at a higher than ; i.e. .
-
3.
Local heating of substrate and analyte: when . The analyte is in thermal equilibrium with the metal, at a higher temperature than their environment. The source of heating here is mainly laser absorption in the metal substrate.
-
4.
Local heating of analyte . Here the molecule remains in internal thermal equilibrium at a temperature , higher than the rest of the system. Strong interactions among vibrational modes within the molecule allows vibrational energy to thermalize and reach an equilibrium through intramolecular vibrational relaxation or redistribution (IVR). The source of heating here can be direct laser absorption in the molecule (via electronic state transitions), or vibrational pumping (via SERS processes) followed by fast IVR. However, it is difficult to distinguish between these two possible causes.
-
5.
Mode specific vibrational pumping, when the analyte is not in internal thermal equilibrium. Each vibrational mode can be described by an effective mode temperature, , which reflects the population of its first vibrational excited state HPdef . In general, IVR ensures that is the same for all modes (internal thermal equilibrium at a temperature ). However, SERS processes affect the vibrational population and can pump vibrations from the ground to the first excited vibrational state (for Stokes processes). If for a given vibrational mode, the pumping rate becomes comparable or higher than the IVR rate, this mode can then have a higher effective temperature than the other modes: ; this is referred to as mode specific pumping.
The different scenarios deserve a brief comment. If vibrational pumping occurs in the presence of fast IVR, pumping will only be observed as an effective heating of the molecule (4th scenario). From the experimental point of view, under these circumstances, it would be impossible to distinguish this situation from the 3rd scenario. It is indeed very difficult to determine independently the temperature of the metal and the molecule, due to the lack of a spectroscopic feature coming explicitly from the metal. Even if one could prove that the 4th scenario was the correct one, it would then be extremely difficult to determine the real cause of heating: direct laser absorption or vibrational pumping, or a combination of both effects. Consequently, the only clear-cut demonstration of vibrational pumping is, in our view, the last scenario; i.e. mode specific pumping. Heating and pumping under SERS conditions have previously been investigated using peak parameter correlations, such as width or frequency vs. intensityHPdef ; MCE2 . Evidence was found for local heating (3rd or 4th scenario) but no evidence of mode specific pumping was uncovered HPdef . Although yielding evidence for the existence of local heating, it was impossible to distinguish its origin; i.e. either within the molecule itself or the colloid (and consequently the molecule through its close contact with the metal). These previous results do not exclude the presence of pumping (vide supra) but they do not demonstrate it either.
Most other studies of heating/pumping under SERS conditions Kneipp1 ; MCE1 ; Brolo ; Haslett have focused on the measurements of the aS/S ratio, . This ratio is in principle directly related to the vibrational populations, and therefore to the effective mode temperature. However, in the case of SERS, it can be modified by underlying resonances associated with the wavelength dependence of the SERS enhancement factor, making the interpretations more difficult. The most general expression for the ratio under SERS conditions at low powers (in the absence of pumping) and for molecules in thermal equilibrium at a temperature ) isKneipp_rev ; Xu2 :
| (1) |
with (accounting for the standard wavelength dependence of Raman processes). is the intensity of the anti-Stokes (Stokes) Raman mode, is the frequency of the laser (Raman mode), is the anti-Stokes (Stokes) scattering cross section of the molecule, is the number of active molecules, and is the SERS enhancement factor at the molecule position at the anti-Stokes(Stokes) frequency. The latter term includes both electromagnetic and chemical enhancement effects. In general the enhancement can be site dependent and therefore should be summed over all active sites. Because anti-Stokes signals are typically small, their measurement requires relatively long integration time and/or large analyte concentrations. The results are therefore an average over several active sites/molecules, each with different enhancement factors and resonances. To account for this averaging, for a given mode can be modelled in a first approximation as:
| (2) |
where is the average asymmetry factor from resonance effects (asymmetries in cross sections), which can change from mode to mode. was used in this expression to account for the possibility of different effective mode temperatures. When the vibrational pumping rate is small compared to IVR rate, we have for all modes and the molecule is in thermal equilibrium at . However, if vibrational pumping is not negligible, this expression needs to be modified to give (for weak pumping) Kneipp1 ; Haslett ; HPdef :
| (3) |
where is the vibrational relaxation time (including IVR and other relaxation processes), and is the laser intensity in photons per unit time and surface area. We see in this latest expression that vibrational pumping would tend to increase the value of . This could alternatively be described by Eq. (2), using an effective mode temperature , but determining would require the use of Eq. (3).
Eqs. (2) or (3) form the basis for the analysis of most SERS experiments about heating/pumping that use aS/S ratio measurements. From them, it is obvious that the measurement of only is not sufficient to extract or , as the ’s are unknown. One therefore needs an extra free parameter. In previous works, the power dependence of was for example studied Kneipp1 ; Haslett ; MCE2 . A linear dependence of with has been invoked as evidence of vibrational pumping which would appear to follow from Eq. (3). This is not true however and direct heating of the molecule has been proposed as an alternative explanation Brolo . To understand the effect of heating on , one can write , and expand Eq. (2) considering a small temperature increase, :
| (4) |
If heating effects are present, changes with power. Because heat diffusion and transfer models are linear, it is reasonable to assume that the temperature increase is proportional to laser power: . For a small temperature increase, the argument in the second exponential of Eq. (4) is small and expanding it leads to
| (5) |
The linear dependence of (or quadratic dependence of ) with incident power can therefore equally be the result of conventional heating effects or of pumping. It is also worth noting that the argument in the second exponential of Eq. (4) can be comparable to 1, even for a small . This can be the case for example for high energy modes, where can be 10. The power dependence of as a result of heating effects would then be exponential. Such power dependence, linear for low energy modes, and exponential for high energy modes, has already been observed MCE2 . This shows that heating effects can be important and that a linear power dependence of is not in itself a proof of vibrational pumping.
Instead of using the laser power as an additional parameter, we propose to study the aS/S ratios of each mode as a function of substrate temperature . As we shall show, by investigating how these ratios change as a function of over a wide range, we can separate the contributions due to heating and resonance effects. In addition, this approach enables us to detect a departure from internal thermal equilibrium of the molecule, i.e. vibrational pumping.
III Experimental details
Silver colloids were produced as described in Ref.Miesel . SERS samples were prepared by mixing equal amounts of colloidal and 25 mM KCl solutions together, to which 1 L of 10-6 M Rhodamine 6G (RH6G) solution was added, resulting in a 10-9 M RH6G concentration. The sample was then dried onto a Si substrate. The temperature calibration in terms of aS/S-data of non-SERS active signals (paracetamol) is described elsewhereRobFaraday . Measurements were carried out with a Renishaw 2000 CCD spectrometer and an Olympus BH-2 microscope with a Linkham temperature stage, using both 514 nm Ar+ ion and 633 nm HeNe lasers with a 50 long working distance objective (1.5 m beam diameter at the focal point). Measurements with the 514 nm laser were made at 0.5 mW whereas for the 633nm laser were performed at 0.5 and 5 mW, respectively, in the range between 100 and 350 K in steps of 10 K and integration times varying from 1 to 30 sec. Five or more measurements were made to gain an average over the sample. Peaks were then analyzed using standard Voigt functions with subtracted backgrounds.
| A + shared | (A + ) | A only | only | ||
| Mode (cm-1) | A | A | A | ||
| Low power 633 nm laser | |||||
| 610 | 1.30 0.05 ( = 25K) | 1.50 0.05 | 17 5 | 2.00 0.20 | 40 5 |
| 780 | 1.35 0.05 ( = 25K) | 1.65 0.10 | 16 5 | 2.35 0.20 | 35 5 |
| 1310 | 0.85 0.10 ( = 25K) | 0.50 0.10 | 55 10 | 1.60 0.30 | 20 5 |
| 1360 | 0.95 0.10 ( = 25K) | 0.80 0.10 | 35 5 | 1.90 0.30 | 25 5 |
| 1510 | 1.05 0.10 ( = 25K) | 0.70 0.10 | 40 6 | 2.20 0.40 | 30 10 |
| High power 633 nm laser | |||||
| 610 | 0.45 0.05 ( = 96K) | 1.05 0.10 | 40 5 | 3.1 0.5 | 40 5 |
| 780 | 0.40 0.04 ( = 96K) | 0.70 0.10 | 60 15 | 4.4 1 | 50 5 |
| 1310 | 0.50 0.10 ( = 96K) | 0.15 0.05 | 160 35 | 12 3 | 75 10 |
| 1360 | 0.40 0.10 ( = 96K) | 0.25 0.10 | 120 35 | 14 3 | 70 10 |
| 1510 | 0.50 0.10 ( = 96K) | 0.08 0.03 | 200 40 | 20 6 | 80 10 |
| Low power 514 nm laser | |||||
| 610 | 0.45 0.05 | 3 2 | 0.50 0.03 | -20 4 | |
The variation in the aS/S ratio for each mode was fitted to Eq. (2), with ., where is the increase in effective mode temperature with respect to the of the substrate which is measured by the aS/S-ratio of the Si substrateRobFaraday . The parameters in Eq. (2) will depend on the particular mode under consideration, accounting for the asymmetry in and produced by resonances. Four types of fits were performed:
-
•
-only, where is set to 1 (no resonance effect) and are fitting parameters;
-
•
-only, where (no local heating, no pumping) and are fitting parameters;
-
•
+-shared, where constant for all modes and are fitting parameters. This corresponds to the case of internal thermal equilibrium for the molecule;
-
•
+, where and are independent fitting parameters. This allows the modes to have different effective mode temperatures.
Figure 1 illustrates the predictions of the model and the influence of and on the value of the aS/S-ratio as a function of . Figure 1(a) shows the expected value of the ratio for different ’s, whilst keeping . When () the ratio is suppressed (increased). In Fig.1(b) is held constant whilst is varied: the influence of is strongest at low ’s where it is a greater fraction of the initial , resulting in a distinctive ‘flaring’ of the ratio at low ’s and a flattening of the overall curve shape.
The first two types of fits are only used to test whether a simple model with heating only and no resonances, or resonances only and no heating, is sufficient to explain the data. For all fits, we assume that and are constant with temperature. , which is the result of predominantly electromagnetic resonances, is not believed to vary with temperature. For molecules in thermal equilibrium is the same for all modes and represent the temperature increase (heating). Many factors contribute to this increase, for example the thermal properties of the SERS substrate and of the various interfaces. These factors could possibly vary with temperature, although large variations typically occur mainly at even lower temperatures ( K). The assumption constant is therefore reasonable in a first approximation. The (+-shared) fit then enables us to separate the resonance effects () from the heating effect (). If this fit fails, then either constant is wrong, or the molecule is not in internal thermal equilibrium (i.e. pumping occurs). In the latter case, the effective mode temperature is determined by the pumping rate, via Eq. (3). The fits with this model cannot therefore be valid, but the (+) fit can still be useful in identifying which modes present an anomalous effective mode temperature and are therefore most likely to be pumped.
If the (+-shared) fit fails, the model above cannot distinguish directly between pumping ( different for different modes) and temperature dependent heating (, but varies with ). In order to prove that different modes cannot be accounted for by a single , we propose to define the following function (for two modes and ):
| (6) |
Then, describing each mode by an effective mode temperature, we have from Eq. (2).
| (7) |
where is a constant accounting for the different A-factors. The advantage of this function is as follows: if both modes share the same temperature, this function is constant as a function of . The function can be used to monitor relative changes between the effective ’s of two modes as a function of external varying conditions (here , but it could also be used to prove non-equilibrium pumping in a power dependence experiment).
IV Results and discussion
IV.1 Low power
Figure 2 shows examples aS/S ratios as a function of for the 610 cm-1 mode of RH6G and 633 nm excitation (top curve). The theoretically predicted behavior (=1, ) and the fits to the experimental data using the (+), -only, and -only models, are shown. The experimental data are well approximated by the (+-shared) fit for all modes investigated. The fitting to all the modes, using the four fitting procedures presented above, is summarized in table 1. Figure 2 also shows the equivalent data for the 610 cm-1 mode under the 514 nm laser excitation (bottom curve). The aS-peaks associated with the higher modes were too small to analyze at these laser powers. The (A + ) fitting provides the best fit to the experimental data although is small and consequently the A only model also fits the data reasonably well. The fitting results for the 610 cm-1 mode taken using the 514 nm laser are also summarized in table 1.
The low power measurements tell us that the molecule is in thermal equilibrium with a heating of 25K when using 633nm laser and 3K when using the same low power 514nm laser. Useful insight into the colloidal heating problem can be gained from considering a simplified 1-D model. Consider a single colloid where the laser power is assumed to dissipate through the top surface with no lateral heat flow. The dependence of the thermal conductivity of Ag is small down to 40 K and we can use the room temperature value. The internal thermal time constant of the colloid (the time for the colloid to come to a uniform temperature), is given by , where is the thermal conductance of a single Ag particle (of size m)3) and is the phononic contribution to the specific heat with Debye temperature, given by: . In this latter expression is the atomic weight of Ag, its density, the length of the colloid and . We ignore the electronic contribution to as it is much smaller than the phonon contribution, except at liquid He temperatures.
Assuming an incident power 1 mW is focussed into a 1 m2 area with a reflectivity of 80%, the number of photons absorbed per second by the colloid is s-1. Note that when dealing with small objects, is comparable to the arrival rate of the photons. The dynamics of the system is therefore rather interesting. The absorption of a single photon increases the colloid’s upper surface temperature by K. By modelling the acoustic mismatch between Ag and Simodelone , we can estimate the expected increase in . Estimating values from experimental data for interfaces between Al-Al2O3 and Pb-diamond, we find temperature increases of 2 and 10 K, respectively, which are the of the right order of magnitude for our low power observations using the 633nm laser. This is remarkable when we consider that we have ignored any potential contribution originating from SERS hot-spots and that the thermal model is extremely simplified. This model supports the scenario that at low powers the molecules could be heating through direct interaction with the colloids.
IV.2 High power
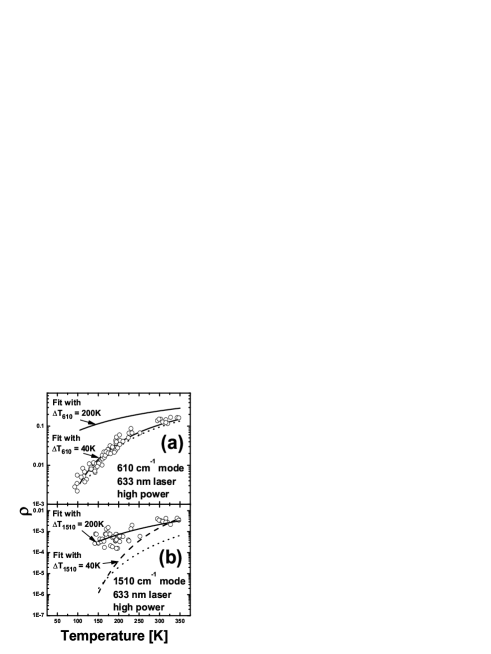
Figure 3 shows as a function of for the 610 and 1510 cm-1 modes for high power (5 mW) 633 nm excitation, while all other parameters were identical to the measurements at low power. We show the resulting fits of (+) for both modes, as well as secondary fits swapping the temperatures and the theoretically expected ’s. The high power ratios for all the modes were also fitted using the (+-shared) model as in the low power data. This resulted in a K whereas the low power results gave 25 K. Although this is clearly larger, as would be expected, the quality of the fits were badly compromised for the high power data, as measured by a -test (not shown in the table). This indicates that this model is no longer valid in this regime. The results of the fitting to the high power, 633 nm data for all the modes is also summarized in table 1. The 610 cm-1 ratio as a function of at high power is similar to that obtained at low powers; when plotted on the same graph it is almost impossible to separate them by eye suggesting that the mode temperature is not too dissimilar, despite an order of magnitude difference in the incident power. Indeed, the result of the (+) fitting of the 610 cm-1 mode in both cases gives = K for low power and = K for high power, which is difficult to visualize on a log-scale. For the 1510 cm-1 mode, although there is a great deal of scatter, there is a noticeable difference in the trend of the data when compared with the low power measurement. This behavior is very similar to the ‘flaring’ of the theoretically determined ’s for high as shown in figure 1. This is confirmed with the fitting of the data to the (A+) model which results in = K; i.e. much larger than the = K from the best fit to the 610 cm-1 mode at high power. Figure 3 also shows fits for the 610 and 1510 cm-1 modes with 200K and , both with the best fit value of A for that mode. It is obvious from these fits that the 610 cm-1 mode is much cooler than the 1510 cm-1. All these results suggest that vibrational pumping in the 1510 cm-1 mode could be the explanation for the failure of the (+-shared) fits.
In order to confirm this hypothesis, we plot in Fig. 4, the function , discussed in the previous section, which compares the effective ’s of (a) the 780 and 610 cm-1 modes and (b) the 1510 and 610 cm-1 modes in (b). The monotonic departure from a constant observed in (b) is an additional demonstration of non thermal equilibrium between these two modes and therefore in the molecule. This confirms that the failure of the (+-shared) fits is a consequence of vibrational pumping, and not of a temperature dependent heating (same for all modes, but varying with temperature). In fact, the data in Fig. 4 show not only evidence for mode specific pumping but also highlights the limitations of the + model. The kink in as a function of means that the 1510, 780, and 610 cm-1 modes share a single above 200 K, whilst below that the 1510 cm-1 shows some mode specific pumping. This is only taken into account approximately in the + model, and Eq. (3) needs to be used to account for pumping properly. Fits using Eqs. (3) and (6) are also shown in Fig. 4 and are in good agreement with the data. Moreover, we extract from the fit for the 1510 cm-1 mode a value of . We estimate photons/cm2 and typical values for are in the range 1–10 ps. This leads to in the range , compatible with previous estimate of the SERS cross section. The study of the -dependence of the function therefore provide additional evidence that the behavior of the 1510 cm-1 below 200 K is a manifestation of vibrational pumping in this mode. This effect is more prominent at low and for higher energy modes because the equilibrium population of the excited vibrational state is then very small and the relative change in intensity is larger. Following this argument, further evidence for pumping could be obtained from measurements at even lower temperatures (K) than the ones accessed in here. We note that the original paper on SERS pumping also presented some evidence for mode dependent effectsKneipp1 . Our results certainly contribute to this body of work and suggest that several mechanisms (vibrational pumping, underlying resonances, and colloid or SERS substrate heating) operate simultaneously and contribute together to the aS/S ratio anomalies.
In summary, we detail the key results presented in table 1 as follows: The (+-shared) model provides a satisfying agreement at low powers. The molecule is then in thermal equilibrium with a heating of K with respect to the substrate for the 633 nm laser, but only a 3 K rise for 514 nm excitation. Models with only A or alone as fitting parameters systematically produce worse overall agreement with the data or even unphysical values, like negative heating (see for example the 610 cm-1 mode at 514 nm excitation in table 1). For high powers using the 633 nm laser, an overall shared among the modes is not possible and one is forced to a better quality fit by allowing different effective temperatures for different modes. Using the function , one can then demonstrate that this is the result of vibrational pumping in the 1510 cm-1 mode.
V Conclusion
In closing, we have observed a laser frequency dependent heating of the order of 25 K at low laser power under SERS conditions with 633 nm excitation. We have shown that it is possible to decouple in dry samples the contributions of the thermal population and resonances in the aS/S ratios by performing a -scan, thus overcoming the basic uncertainty in the different relative contributions which exist in studies at a single . Most importantly we have used this technique to provide evidence for at least two possible scenarios: molecule in thermal equilibrium at low powers and mode specific pumping at high powers. Experiments at lower temperatures are in progress and will be reported elsewhere.
PGE and LFC acknowledge support by EPSRC (UK) under grant GR/T06124. RCM acknowledges partial support from the National Physical Laboratory (UK) and the hospitality of the MacDiarmid Institute at Victoria University (NZ).
References
- (1) M. Moskovits, Rev. Mod. Phys. 57, 783 (1985).
- (2) A. Otto, in Light Scattering in Solids, edited by M. Cardona and G. Güntherodt (Springer, Berlin, 1984), p. 289.
- (3) K. Faulds, R. P. Barbagallo, J. T. Keer, W. E. Smith, D. Graham, Analyst 129, 567 (2004).
- (4) M. Green, F. M. Lui, L. F. Cohen, P. Kollensperger, and A. Cass, In Press.
- (5) J. J. Storhofff, R. Elghanian, C. A. Mirkin, R. L. Letsinger, Langmuir 18, 6666 (2002).
- (6) J. Kneipp, H. Kneipp, W. L. Rice, and K. Kneipp, Anal. Chem. 77, 2381 (2005).
- (7) C. Loo, A. Lowery, N. Halas, J. West, R. Drezek, Nano Letters, 5, 709 (2005).
- (8) K. Kneipp, Y. Wang, H. Kneipp, et al., Phys. Rev. Lett. 76, 2444 (1996).
- (9) R. C. Maher, L. F. Cohen, P. Etchegoin, H. J. N. Hartigan, R. J. C. Brown, and M. J. T. Milton, J. Chem. Phys. 120, 11746 (2004).
- (10) T. L. Haslett, L. Tay, and M. Moskovits, J. Chem. Phys. 113, 1641 (2000).
- (11) A. G. Brolo, A. C. Sanderson, and A. P. Smith, Phys. Rev. B 69, 045424 (2004).
- (12) E. C. Le Ru and P. G. Etchegoin, Faraday Discussions 132 (in press).
- (13) R. C. Maher, J. Hou, L. F. Cohen, F. M. Liu, N. Green, R. J. C. Brown, M. J. T. Milton, E. C. Le Ru, J. M. Hadfield, J. E. Harvery, and P. G. Etchegoin, J. Chem. Phys. 123, 084702 (2005).
- (14) R. C. Maher, L. F. Cohen, E. C. Le Ru, and P. G. Etchegoin, Faraday Discussions 132 (in press).
- (15) R. C. Maher, M. Dalley, E. C. Le Ru, L. F. Cohen, P. G. Etchegoin, H. Hartigan, R. J. C. Brown, and M. J. T. Milton, J. Chem. Phys. 121, 8901 (2004).
- (16) K. Kneipp, H. Kneipp, I. Itzkan, R. R. Dasari, and M. S. Feld, J. Phys: Condens. Matter 14, R597 (2002).
- (17) H. Xu, J. Aizpurua, M. Käll, and P. Apell, Phys. Rev. E 62, 4318 (2000).
- (18) P.C. Lee, D. Meisel, J. Phys. Chem. 86, 3391 (1982).
- (19) D. G. Cahill, W. K. Ford, K. E. Goodson, G. D. Mahan, A. Majumdar, H. J. Maris, R. Merlin, S. R. Phillpot, J. Appl. Phys. 93, 793 (2003).