Conformational changes in glycine tri- and hexapeptide
Abstract
We have investigated the potential energy surfaces for glycine chains consisting of three and six amino acids. For these molecules we have calculated potential energy surfaces as a function of the Ramachandran angles and , which are widely used for the characterization of the polypeptide chains. These particular degrees of freedom are essential for the characterization of proteins folding process. Calculations have been carried out within ab initio theoretical framework based on the density functional theory and accounting for all the electrons in the system. We have determined stable conformations and calculated the energy barriers for transitions between them. Using a thermodynamic approach, we have estimated the times of the characteristic transitions between these conformations. The results of our calculations have been compared with those obtained by other theoretical methods and with the available experimental data extracted from the Protein Data Base. This comparison demonstrates a reasonable correspondence of the most prominent minima on the calculated potential energy surfaces to the experimentally measured angles and for the glycine chains appearing in native proteins. We have also investigated the influence of the secondary structure of polypeptide chains on the formation of the potential energy landscape. This analysis has been performed for the sheet and the helix conformations of chains of six amino acids.
I Introduction
It is well known that proteins consist of amino acids whose number may vary in the range from hundreds up to tens of thousands. Small fragments of proteins are usually called polypeptide chains or polypeptides. This work is devoted to a study of the conformational properties of glycine polypeptide chains.
Since recently, it became possible to study experimentally small fragments of proteins and polypeptides in the gas phase with the use of the MALDI mass spectroscopy Karas and Hillenkamp (1988); Hillenkamp and Karas (2000); Karas et al. (2003); Wind and Lehmann (2004) and the ESI mass spectroscopy Fenn et al. (1989); Bröndsted-Nielsen et al. (2004). From theoretical view point, investigation of small polypeptides is of significant interest because they can be treated by means of ab initio methods allowing accurate comparison of theoretical predictions with experiment. The results of ab initio calculations can be then utilized for the development of model approaches applicable for the description of larger and more complex protein structures.
Polypeptides are characterized by the primary and the secondary structure Finkelstein and Ptizin (2002); Mülberg (2004); Berman et al. (2000); Rubin (2004). Different geometrical configurations of a polypeptide are often called as the conformations. One can expect that chemical and physical properties of various conformations of complex molecules might differ significantly. The number of various conformations (isomeric states) grows rapidly with the growth of a system size. Thus, a search for the most stable conformations becomes an increasingly difficult problem for large molecules. With the help of the NMR spectroscopy and the X-rays diffraction analysis it has been shown Berman et al. (2000), that the sheet and the helix structures are the most prominent elements of the protein secondary structure.
The main difference between the sheet and the helix structures is due to the difference of the dihedral angles formed by the atoms of the polypeptide chains in the two cases. These degrees of freedom are responsible for the transition of the molecule from one conformation to another. By increasing the temperature of the system, the degrees of freedom responsible for twisting of the polypeptide chain can be activated. The study of this transition and evaluation of its characteristic duration are of significant interest, because this problem is closely related to one of the most intriguing problems of the protein physics - the protein folding. To study this transition it is necessary to investigate the potential energy surface of amino acid chains with respect to their twisting. Besides the protein folding, the potential energy landscapes of polypeptides carry a lot of detail and useful information about the structure of these molecules.
In the present paper we have studied the potential energy surface for small glycine chains. These molecules were chosen because they are often present in native proteins as fragments, and also because they allow ab initio theoretical treatment due to their relatively small size.
Previously, only glycine and alanine dipeptides were studied in detail. Sometimes their analogues were used to reduce the computational costs (for example (S)--(formylamino)propanamide). In refs. Head-Gordon et al. (1991); Gould et al. (1994); Wang and Duan (2004) alanine and glycine dipeptides were investigated within the Hartree-Fock theory. In these papers the potential energy surfaces were calculated versus the twisting angles of the molecules. Different stable conformations of the dipeptides, corresponding to different molecular conformations, were determined. Each stable conformation of the molecule was additionally studied on the basis of the perturbation theory, which takes into account many-electron correlations in the system. In refs. Percel et al. (2003); Húdaky et al. (2004); Improta and Barone (2004); Vargas et al. (2002); Kashner and Hohl (1998); Wei et al. (2001) different conformations and their energies were determined within the framework of the density functional theory. In ref. Wei et al. (2001) dynamics of the alanine dipeptide analog was discussed and time of the transition between the two conformations of the alanine dipeptide was found. In Bludsky̌ et al. (2000) the glycine molecule was studied with accounting for the many electron correlations within the many-body perturbation theory. In this work the most important glycine isomers and the frequencies of the normal vibration modes were determined.
A number of papers were devoted to the study of tripeptides. In refs. Woutersen et al. (2001, 2002); Mu and Stock (2002); Mu et al. (2003); Nguyen and Stock (2003) dynamics of the alanine and glycine tripeptides was studied by means of classical molecular dynamics and with the use of semi-empirical potentials (such as GROMOS, CHARMM and AMBER). In ref. Torii and Tasumi (1998) within the framework of the Hartree-Fock theory several stable conformations of alanine and glycine tripeptides were found. In ref. Schweitzer-Stenner et al. (2001) the Raman and IR spectra for alanine and glycine tripeptides were measured in neutral, acidy and alkali environments.
Polypeptides have been studied less. We are aware of only several related papers. In particular, stable conformations of neutral and charged alanine hexapeptides were obtained with the use of empirical potentials and discussed in ref. Levy and Becker (2001). Experimental NMR study of various conformations of alanine heptapeptides at different temperatures was carried out in ref. Shi et al. (2002). In ref. Garcia (2004) with the use of empirical molecular dynamics based on Monte-Carlo methods, a polypeptide consisting of 21 amino acids was described.
In the present paper we have performed an ab initio calculation of the multidimensional potential energy surface for the glycine polypeptide chains consisting of three and six amino acids. The potential energy surface versus twisting degrees of freedom of the polypeptide chain has been calculated. The calculations have been performed within ab initio theoretical framework based on the density functional theory (DFT) accounting for all the electrons in the system. Previously, this kind of calculations were performed only for dipeptides (see, e.g., Head-Gordon et al. (1991); Gould et al. (1994); Wei et al. (2001)). For larger molecules, only a few conformations were considered (see citations above). We have calculated the energy barriers for the transitions between different molecular conformations and determined the energetically most favorable ones. Using a thermodynamic approach, we have estimated times of the characteristic transitions between the most energetically favorable conformations. The results of our calculation have been compared with other theoretical simulations and with the available experimental data. We have also analysed how the secondary structure of polypeptide chains influences the potential energy landscapes. In particular, the role of the secondary structure in the formation of stable conformations of the chains of six amino acids being in the sheet and in the helix conformations has been elucidated. Some preliminary results of our work were published as electronic preprints Yakubovitch et al. (a, b).
Our paper is organized as follows. In section II we give a brief overview of theoretical methods used in our work. In section III we present and discuss the results of our computations. In section IV we draw a conclusion to this paper. The atomic system of units, , is used throughout the paper unless other units are indicated.
II Theoretical methods
In the present paper we study the multidimensional potential energy surfaces for glycine polypeptides within the framework of the density functional theory. The potential energy surfaces are multidimensional functions of atomic coordinates. In our work the potential energy surfaces were considered as a function of the dihedral angles formed by the atoms of the polypeptide chain. For this calculation the Born-Oppenheimer approximation allowing to separate the motion of the electronic and ionic subsystems is used.
The density functional theory (DFT) is a common tool for the calculation of properties of quantum many body systems in which many electron correlations play an important role. The DFT formalism is well known and can be found in many textbooks (see e.g. Guet et al. (2001); Solov’yov and Connerade (2004)). Therefore in our work we present only the basic equations and ideas of this method.
Electronic wave functions and energy levels within the framework of DFT are obtained from the Kohn-Sham equations, which read as (see e.g. Guet et al. (2001); Solov’yov and Connerade (2004)):
| (1) |
where the first term represents the kinetic energy of the -th electron with the wavefunction and the energy , describes the electron attraction to the ionic centers, is the Hartree part of the interelectronic interaction Lindgren and Morrison (1986), is the local exchange-correlation potential.
The exchange-correlation potential is defined as a functional derivative of the exchange-correlation energy functional:
| (2) |
Equation (2) is exact and follows from the Hohenberg theory Hohenberg and Kohn (1964). However, no unique potential , universally applicable for different systems and conditions, has been found so far.
Approximate functionals employed by the DFT usually partition the exchange-correlation energy into two parts, referred to as the exchange and the correlation terms:
| (3) |
Both terms are the functionals of the electron density, which can be of two distinctly different types: either a local functional depending only on the electron density or a gradient-corrected functionals depending on both and its gradient, . A variety of exchange correlation functionals can be found in literature. In our work we have used the hybrid Becke-type three-parameter exchange functional Becke (1988) paired with the gradient-corrected Lee, Yang and Parr correlation functional () Lee et al. (1988); Parr and Yang (1989).
III Results and Discussion
III.1 Determination of the polypeptide twisting degrees of freedom
In this section we present the potential energy surfaces for the glycine polypeptide chains calculated versus dihedral angles and defined in figure 1. In particular, we focus on the chains consisting of three and six amino acids.
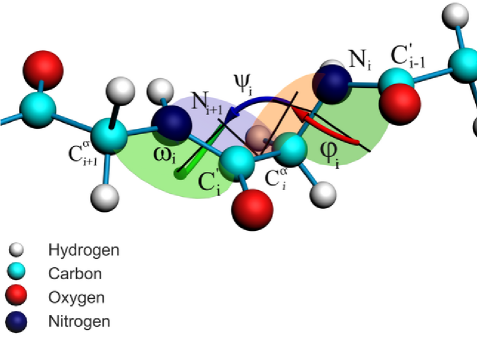
Both angles are defined by the four neighboring atoms in the polypeptide chain. The angle is defined as the dihedral angle between the planes formed by the atoms () and (). The angle is defined as the dihedral angle between () and () planes. Beside the angles and there is an angle , which is defined as the dihedral angle between the () and () planes. The atoms are numbered from the terminal of the polypeptide. The angles , and take all possible values within the interval [;]. For the unambiguous definition we count the angles , and clockwise, if one looks on the molecule from its terminal (see fig. 1). This way of angle counting is the most commonly used Rubin (2004).
The angles and can be defined for any amino acid in the chain except for the first and the last ones. Below we omit the subscripts and consider angles and for the middle amino acid of the polypeptide.
III.2 Optimized geometries of glycine polypeptides
In order to study the twisting of a polypeptide chain one needs first to define its initial structure. Although the number of its conformations increases with the growth of the molecule size, there are certain types of polypeptide structure, namely the sheet and the helix conformations, which are the most typical. In the present paper we have investigated twisting of the polypeptide chains of the sheet and the helix conformation. By varying the angles and in the central amino acid one can create the structure of the polypeptide differing significantly from the pure sheet or helix conformations. If the structure of a polypeptide can be transformed to a helix or a sheet one by a trivial variation of and , such polypeptides are referred below as belonging to the group of the helix or the sheet structure respectively.

In figure 2 we present the optimized geometries of glycine polypeptide chains that have been used for the exploration of the potential energy surfaces. All geometries have been optimized with the use of the B3LYP functional. Figure 2a shows the glycine tripeptide structure. In the present work we choose in the sheet conformation, because the tripeptide is too short to form the helix conformation. Figures 2b and 2c show glycine hexapeptide in the sheet and the helix conformations respectively. The total energies (in atomic units) of the molecules are given below the images.
III.3 Potential energy surface for glycine tripeptide
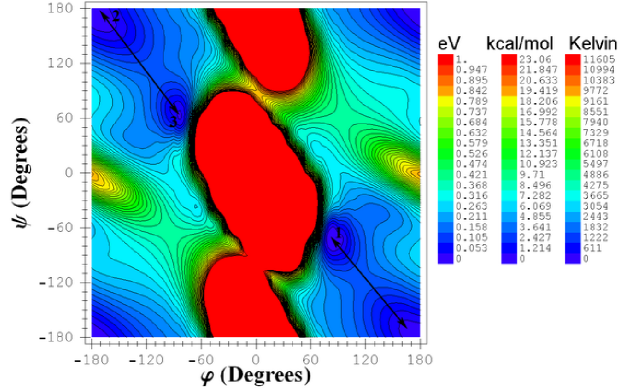
In figure 3 we present the potential energy surface for the glycine tripeptide calculated by the B3LYP/6-31G(2d,p) method. The energy scale is given in eV, kcal/mol and Kelvin. Energies on the plot are measured from the lowest energy minimum of the potential energy surface.
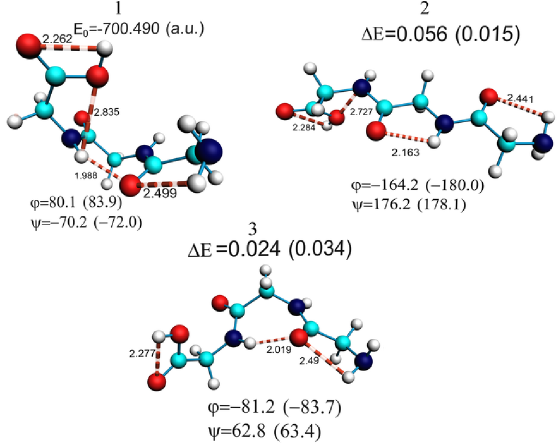
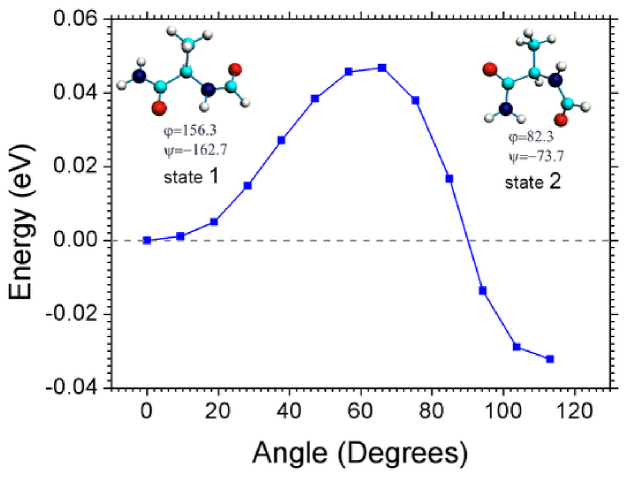
From the figure follows that there are several minima on the potential energy surface. They are numbered according to the value of the corresponding energy value. Each minimum corresponds to a certain conformation of the molecule. These conformations differ significantly from each other. In the case of glycine tripeptide there are only three conformations, shown in figure 4. Dashed lines show the strongest hydrogen bonds in the system, which arise when the distance between hydrogen and oxygen atoms becomes less then 2.9 angstroms.
To calculate the potential energy surface the following procedure was adopted. Once the stable structure of the molecule has been determined and optimized, all but two (these are the angles and in the central amino acid) degrees of freedom were frozen. Then the energy of the molecule was calculated by varying and . This procedure was used to calculate all potential energy surfaces presented below in this section. It allows one to find efficiently the minima on the potential energy surface and to determine the main stable conformations of the molecule. The absolute energy values of different conformations of the tripeptide found by this method are not too accurate, because the method does not account for the relaxation of other degrees of freedom in the system. To calculate the potential energy surface with accounting for the relaxation one needs 20-30 times more of the computer time. Therefore, a systematic calculations with accounting for the relaxation have not been performed in our work. Instead, we have performed a complete optimization of the molecular conformations, corresponding to all minima on the calculated potential energy surface.
In figure 4 we compare stable conformations of the glycine tripeptide calculated with and without accounting for the relaxation of all atoms in the system. As it is seen from this figure the angles and differ by about 10 percent in the two cases. This difference arises due to the coupling of and with other degrees of freedom. Note the change of the sign of the relative energies of some conformations. This effect is due to the rearrangement of side atoms (radicals) in the polypeptide chain which lowers the energies of different conformations differently.
In our work the potential energy surface has been calculated and interpolated on the grid with the step of . This step size is an optimal one, because the interpolation error is about , i.e. comparable with the angle deviations caused by the relaxation of all degrees of freedom in the system.
| conformation | , Head-Gordon et al. (1991) | Head-Gordon et al. (1991) | Gould et al. (1994) | Gould et al. (1994) | ||
|---|---|---|---|---|---|---|
| 1 | - | - | 76.0 | -55.4 | 80.1 | -70.2 |
| 2 | -180.0 | 180.0 | -157.2 | 159.8 | -164.2 | 176.2 |
| 3 | -85.2 | 67.4 | -85.8 | 79.0 | -81.2 | 62.8 |
In refs. Head-Gordon et al. (1991) and Gould et al. (1994) several stable conformations were found for alanine and glycine dipeptides. The values of angles and for the stable conformations of dipeptide and tripeptide are close indicating that the third amino acid in tripeptide makes relatively small influence on the values of dihedral angles of two other amino acids. In earlier papers Head-Gordon et al. (1991); Gould et al. (1994) dipeptides were studied within the framework of the Hartree-Fock theory. In ref. Head-Gordon et al. (1991), values of and were obtained by the HF/6-31+G* method, and in ref. Gould et al. (1994) by HF/6-31G**. In table 1 we compare the results of our calculation for tripeptide with the corresponding data obtained for dipeptides. Some discrepancy between the values presented is due to the difference between the dipeptide and tripeptide (i.e. the third glycine in tripeptide affects the values of angles and ). However, another source of discrepancy might arise due to accounting for the many-electron correlations in the DFT and neglecting this effect in the Hartree-Fock theory used in refs. Head-Gordon et al. (1991); Gould et al. (1994).
Figure 3 shows that some domains of the potential energy surface, where the potential energy of the molecule increases significantly, appear to be unfavorable for the formation of a stable molecular configuration. The growth of energy takes place when some atoms in the polypeptide chain approach each other of small distances. Accounting for the molecule relaxation results in the decrease of the system energy in such cases, but the resulting molecular configurations remain unstable. We call such domains on the potential energy surface as forbidden ones. In figure 3 one can identify two forbidden regions in the vicinity of the points (0, 0) and (0, 180). At (0, 0) a pair of hydrogen and oxygen atoms approach to the distances much smaller than the characteristic bond length. This leads to a strong interatomic repulsion caused by the exchange interaction of electrons. At (0, 180) the Coulomb repulsion of pair of oxygen atoms causes the similar effect.
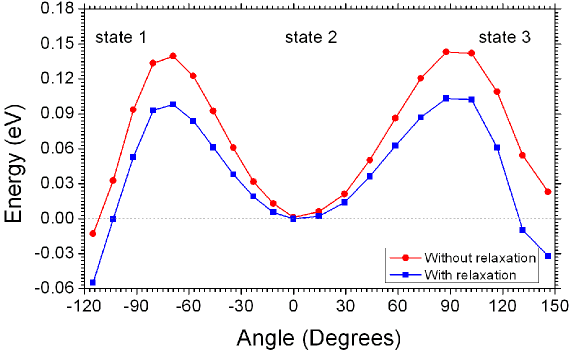
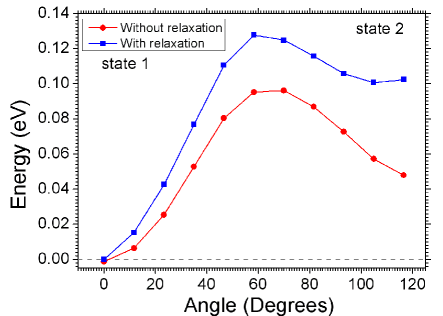
Figure 3 shows that there are three minima on the potential energy surface for glycine tripeptide. The transition barriers between the conformations and are shown in figure 5. They have been calculated with and without relaxation of the atoms in the system. The corresponding transition paths are marked in figure 3 by arrows. This comparison demonstrates that accounting for the relaxation significantly lowers the barrier height and influences the relative value of energy of the minima.
Let us now estimate the time needed for a system for the transition from one conformation to another. To do this we use the Arhenius equation, which reads as:
| (4) |
where is the transition time, is the factor, determining how frequently the system approaches the barrier, is the barrier height, is the temperature of the system, is the Bolzmann factor.
Figure 6 shows the barrier for the transition between the two main conformations of the alanine dipeptide analog ((S)--(formylamino)propanamide). It is seen that eV for the transition , while eV for the transition . The frequency for this molecule is equal to 42.87 cm-1. Thus, at K, we obtain ps and ps. This result is in excellent agreement with the molecular dynamics simulations results obtained in Wei et al. (2001) predicting ps for the transition and ps for the transition . This comparison demonstrates that our method is reliable enough and it can be used for the estimation of transition times between various conformations of the polypeptides.
Using the B3LYP/6-31G(2d,p) method we have calculated the frequencies of normal vibration modes for the glycine tripeptide. The characteristic frequency corresponding to twisting of the polypeptide chain is equal to 33.49 cm-1. From figure 5 follows that eV for the transition , and eV for the transition . Thus, we obtain ps and ps. Let us note that these transition times can be measured experimentally by means of NMR Rubin (2004); Bax (2003).
III.4 Potential energy surface for glycine hexapeptide with the sheet and the helix secondary structure

In figure 7 we present contour plots of the potential energy surfaces for the glycine hexapeptide with the sheet (part a) and the helix (part b) secondary structure, respectively, versus dihedral angles and . In both cases the forbidden regions arise because of the repulsion of oxygen and hydrogen atoms analogously to the glycine tripeptide case.
Minima 1-5 on the potential energy surface 7a correspond to different conformations of the glycine hexapeptide with the sheet secondary structure. Note that minima 1-3 are also present on the potential energy surface of the glycine tripeptide. Geometries of the conformations 1-5 are shown on the right-hand side of figure 7a.
For the glycine hexapeptide with the sheet secondary structure additional minima 4-5 arise. The appearance of these minima is the result of the interaction of the outermost amino acids, which are absent in the case of tripeptide.
Energy barrier as a function of a scan variable (see figure 7a) for the transition between conformations 1 and 2 is shown in figure 8. The energy dependence has been calculated with and without relaxation of all the atoms in the system. In the case of glycine hexapeptide with the sheet secondary structure the barrier height (0.128 eV) for the transition appears to be close to the corresponding barrier height of the glycine tripeptide (0.103 eV), while the barrier height for the transition is significantly lower (0.028 eV). The normal vibration mode frequency, corresponding to the twisting of the polypeptide chain is equal to 15.45 cm-1 and was calculated with the B3LYP/6-31G(2d,p) method. Using equation (4) one derives the transition times at room temperature: ps, ps.
Let us now consider glycine hexapeptide with the helix secondary structure. The potential energy surface for this polypeptide is shown in figure 7b. The positions of minima on this surface are shifted significantly compared to the cases discussed above. This change takes place because of the influence of the secondary structure of the polypeptide on the potential energy surface. The geometries of the most stable conformations are shown on the right hand-side of figure 7b.
It is worth noting that for some conformations of glycine hexapeptide the angles and change significantly when the relaxation of all degrees of freedom in the system is accounted for (see for example conformations 1, 4, 5 in fig. 7a and conformations 3, 4 in fig. 7b). This means that the potential energy surface of the glycine hexapeptide in the vicinity of mentioned minima is very sensitive to the relaxation of all degrees of freedom. However, calculation of the potential energy surface with accounting for the relaxation of all degrees of freedom is unfeasible task. Indeed, one needs about 1000 hours of computer time (Pentium Xeon 2.4 GHz) for the calculation of the potential energy surface for the glycine hexapeptide. To perform an analogues calculation with accounting for the relaxation about 3 years of computer time would be needed. Nevertheless, the potential energy surface calculated without accounting for the relaxation carries a lot of useful information. Thus, one can predetermine stable conformations of polypeptide, which then can be used as starting configurations for further energy minimization.
III.5 Comparison of calculation results with experimental data
Nowadays, the structure of many proteins has been determined experimentally Berman et al. (2000). Knowing the protein structure one can find the angles and for each amino acid in the protein.
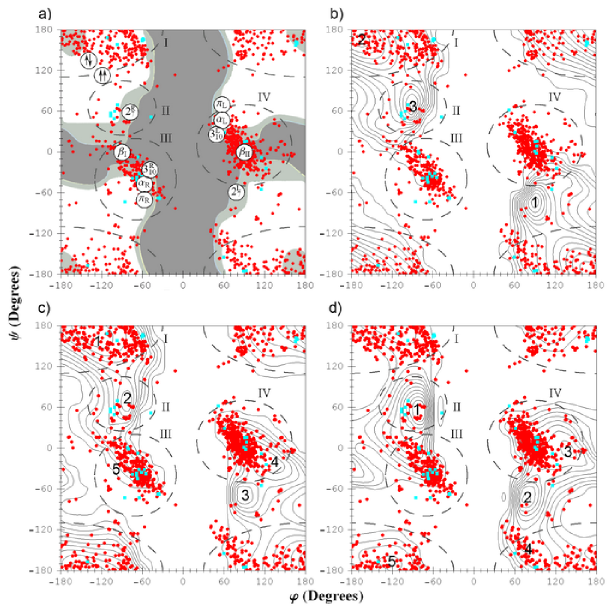
In figure 9a, we show a map of the allowed and forbidden conformations for glycine residues in poly-glycine chain taken from Voet and Voet (2004) (steric Ramachandran diagram). This map was obtained from pure geometrical considerations, in which the structure of the polypeptide was assumed to be fixed and defined by the interatomic van der Waals interaction radii. Depending on the distances between the atoms one could distinguish three regions: completely allowed, conventionally allowed and forbidden. The conformation is called completely allowed if all the distances between atoms of different amino acids are larger than some critical value . Conventionally allowed regions on the potential energy surface correspond to the conformations of the polypeptide, in which the distances between some atoms of different amino acids lie within the interval . All other conformations are referred to as forbidden. The values of and are defined by the types of interacting atoms and can be found in the textbooks (see, e.g., Voet and Voet (2004)). In figure 9a we mark the completely allowed regions with white, the conventionally allowed regions with light-gray and the forbidden regions with dark gray color. In this figure we mark the points, which correspond to the geometries of glycine, whose periodical iteration leads to the formation of chains with specific secondary structure. In table 2 we compile the values of angles and , which correspond to the most prominent poly-glycine secondary structures. For the illustrative purposes we mark these points by white circles with the corresponding type of the secondary structure typed in. Thus, , are the right-handed and the left-handed helix; , are the right-handed and the left-handed helix; , are the right-handed and the left-handed helix (); , are the right-handed and the left-handed helix (); , are the parallel and antiparallel sheets. , correspond to the turns of types I and II respectively.
| Structure type | (Deg.) | (Deg.) |
|---|---|---|
| right-handed (left-handed) helix | -78 (78) | 59 (-59) |
| right-handed (left-handed) helix | -49 (49) | -26 (26) |
| right-handed (left-handed) helix () | -57 (57) | -47 (47) |
| right-handed (left-handed) helix () | -57 (57) | -70 (70) |
| parallel sheet () | -119 | 113 |
| antiparallel sheet () | -139 | 135 |
| turn of type I | -90 | 0 |
| turn of type II | 90 | 0 |
Note that not all of the structures listed above are present equally in proteins. In figure 9a we show the distribution of the angles and of glycine residues in protein structures selected from the Brookhaven Protein Data Bank Berman et al. (2000); Sheik et al. (2002). It is possible to distinguish four main regions, in which most of the experimental points are located. In figure 9 these regions are schematically shown with dashed ellipses. Note that these ellipses are used for illustrative purposes only, and serve for a better understanding of the experimental data. The regions in which most of the observed angles and are located correspond to different secondary structure of the poly-glycine. Thus, region I corresponds to the parallel and antiparallel sheets. Region II corresponds to the right-handed helix. Region III corresponds to the right-handed helix, right-handed helix, right-handed helix and turn of type I. Region IV corresponds to the left-handed helix, left-handed helix and turn of type II. In some cases there are several types of secondary structure within one domain. In the present work we have not studied the secondary structure of proteins systematically enough to establish the univocal correspondence of the observed experimental points to different types of the secondary structure. Figure 9a demonstrates that and helixes are rarely observed in experiment.
Note that some experimental points lie in the forbidden region of the steric Ramachandran diagram (see region IV in fig. 9a). The quantum calculation shows that in fact this region is allowed and has several minima on the potential energy surface (see fig 9c and 9d). This comparison shows that for an accurate description of polypeptides it is important to take quantum properties of these systems into account.
Let us now compare the distribution of angles and experimentally observed for proteins with the potential energy landscape calculated for glycine polypeptides, and establish correspondence of the secondary structure of the calculated conformations with the predictions of the simple Ramachandran model.
Region I corresponds to the minima 2, 1 and 5 on the potential energy surfaces of the glycine tripeptide (fig. 9b), the glycine hexpeptide with the secondary structure of sheet (fig. 9c), and the glycine hexapeptide with the secondary structure of helix (fig. 9d) respectively. Conformations 2 and 1 in figures 9b and 9c correspond exactly to the glycine chains in the -sheet conformation (see fig. 4 and 7a). Conformation 5 in figure 9d is a mixed state. Here the central amino acid has the conformation of sheet, while the outermost amino acids have the conformation of helix.
Region II corresponds to the minima 3, 2 and 1 on the potential energy surfaces 9b, 9c, and 9d, respectively. On the steric diagram for poly-glycine (see fig. 9a) this region corresponds to the right-handed helix. The structure of conformations 3 and 2 on the surfaces 9b and 9c differs from the structure of this particular helix type. Only the central glycines, for which the angles and in figures 9b and 9c are defined, have the structure of helix. Thus, one can refer to conformations 3 and 2 as to the mixed states, where the central part of the polypeptide chain has the conformation of helix and the outermost parts have the conformation of sheet. Conformation 1 on the surface 9d is also a mixed state. Here one can distinguish one turn of helix and two turns of helix (see fig. 7b).
Region III corresponds to the structure of right-handed helix, right-handed helix, right-handed helix and turn I. It corresponds to minimum 5 on the potential energy surface of the glycine hexapeptide with the secondary structure of sheet 9c. Conformation 5 can be characterized as partially formed turn, because the glycine, for which the dihedral angles and in figure (fig. 9c) are defined, has the geometry of turn and its neighbor forms a sheet (see fig. 7a). There are no minima in region III on the potential energy surfaces presented in figures 9b and 9d. This happens because in this case most probable is the structure of right-handed helix. To form one turn of the helix of this type it is necessary to link at least four amino acids, so the glycine tripeptide is too short for that. As well, six amino acids chain is too short to form a stable fragment of an helix, because it does not have enough hydrogen bonds to stabilize the structure. For the hexapeptide more probable are the elements of and helixes, because in these cases 2 and 3 helical turns respectively can be formed.
Region IV is represented by the structure of left-handed helix, left-handed helix and turn of type II. To form these structures it is necessary to have at least four amino acids, therefore there is no minima in this region on the potential energy surface of glycine tripeptide (fig. 9b). Region IV corresponds to the conformations 4 and 3 on the surfaces 9c and 9d respectively. Conformation 4 on the surface 9c corresponds to partially formed turn, because the glycine, for which the dihedral angles and in figure 9c are plotted has the configuration of turn, but the neighboring aminoacid in the chain forms a sheet (see fig. 7a). Conformation 3 on the surface 9d can be characterized as deformed turn of left-handed helix, which turns out to be energetically the most favorable in this region of the potential energy surface (see fig. 7b).
Finally, we mention a few peculiarities of the calculated potential energy landscapes. At each of the potential energy surfaces discussed in this work one can see a minimum at and . On the steric diagram for poly-glycine this region corresponds to the left-handed helix. Conformations 1, 3 and 2 on the potential energy surfaces 9b, 9c, and 9d respectively partially represent this structure (see fig. 4, 7a and 7b). The structure of conformation 4 on the potential energy surface 9d is similar to left-handed helix, but differs from it due to the short length of the polypeptide chain, resulting in significant variation of angles and in all the residues along the chain.
IV Conclusion
In the present paper the multidimensional potential energy surfaces for amino acid chains consisting of three and six glycines has been investigated and the conformational properties of these systems with respect to the twisting of the polypeptide chain have been described. The calculations were carried out within ab initio theoretical framework based on the density functional theory accounting for all the electrons in the system. We have determined stable conformations and calculated the energy barriers for transitions between them. Using a thermodynamic approach, we have estimated times of the characteristic transitions between the conformations. It was demonstrated that the transition times lie within the picosecond region. Our estimates are compared with the available molecular-dynamics simulations results, and the correspondence between the results of the two different methods is reported. A strong barrier asymmetry between neighboring stable conformations on the potential energy surface was found.
We have compared for the first time values of angles and for glycine residues experimentally observed in real proteins with the coordinates of minima on the potential energy surfaces. This comparison has showed that all profound minima on the potential energy surfaces correspond to the regions in which experimentally measured values of and are located. We have also analysed how the secondary structure of polypeptide chains influences the formation of the potential energy landscapes. For the chains of six amino acids with the secondary structures of sheet and helix the influence of the secondary structure on the stable conformations of the molecule was demonstrated.
The results of this work can be utilized for modeling more complex molecular systems. For example, the suggested model for the estimation of the characteristic transition times can be used for longer polypeptide chains, also consisting of different amino acids and for estimates of time of proteins folding. It is also possible to use the results of the present work for testing the applicability and accuracy of different model approaches for the polypeptide description requiring much less computer time than ab initio calculations.
V Acknowledgements
This work is partially supported by the European Commission within the Network of Excellence project EXCELL, by INTAS under the grant 03-51-6170 and by the Russian Foundation for Basic Research under the grant 06-02-17227-a. We are grateful to Dr. A. Korol and Dr. O. Obolensky for their help in preparation of this manuscript. The possibility to perform complex computer simulations at the Frankfurt Center for Scientific Computing is also gratefully acknowledged.
References
- Karas and Hillenkamp (1988) M. Karas and F. Hillenkamp, Anal. Chem. 60, 2299 (1988).
- Hillenkamp and Karas (2000) F. Hillenkamp and M. Karas, Int. J. of Mass Spect. 200, 71 (2000).
- Karas et al. (2003) M. Karas, U. Bahr, I. Fournier, M. Gluckmann, and A. Pfenninger, J. of Mass Spect. 226, 239 (2003).
- Wind and Lehmann (2004) M. Wind and W. Lehmann, J. Anal. At. Spect. 19, 20 (2004).
- Fenn et al. (1989) J. Fenn, M. Mann, C. Meng, S. Wong, and C. Whitehouse, Science 246, 64 (1989).
- Bröndsted-Nielsen et al. (2004) S. Bröndsted-Nielsen, J. Andersen, P. Hvelplund, B. Liu, and S. Tomita, J. Phys. B: At. Mol. Opt. Phys. 37, R25 (2004).
- Finkelstein and Ptizin (2002) A. Finkelstein and O. Ptizin, Physics of Proteins (Moscow University Press ”Universitet”, 2002).
- Mülberg (2004) A. Mülberg, Protein Folding (St. Petersburg University Press, 2004).
- Berman et al. (2000) H. Berman, J. Westbrook, Z. Feng, G. Gilliland, T. Bhat, H. Weissig, I. Shindyalov, and P. Bourne, Nucleic Acids Research 28, 235 (2000).
- Rubin (2004) A. Rubin, Biophysics: Theoretical Biophysics (Moscow University Press ”Nauka”, 2004).
- Head-Gordon et al. (1991) T. Head-Gordon, M. Head-Gordon, M. Frisch, C. B. III, and J. Pople, J. Am. Chem. Soc. 113, 5989 (1991).
- Gould et al. (1994) I. Gould, W. Cornell, and I. Hillier, J. Am. Chem. Soc 116, 9250 (1994).
- Wang and Duan (2004) Z. Wang and Y. Duan, J. Comp. Chem. 25, 1699 (2004).
- Percel et al. (2003) A. Percel, O. Farkas, I. Jákli, I. Topol, and I. Csizmadia, J. Comp. Chem. 24, 1026 (2003).
- Húdaky et al. (2004) I. Húdaky, P. Húdaky, and A. Percel, J. Comp. Chem. 25, 1522 (2004).
- Improta and Barone (2004) R. Improta and V. Barone, J. Comp. Chem. 25, 1333 (2004).
- Vargas et al. (2002) R. Vargas, J. Garza, B. Hay, and D. Dixon, J. Phys. Chem. A 106, 3213 (2002).
- Kashner and Hohl (1998) R. Kashner and D. Hohl, J. Phys. Chem. A 102, 5111 (1998).
- Wei et al. (2001) D. Wei, H. Guo, and D. Salahub, Phys. Rev. E 64 (2001).
- Bludsky̌ et al. (2000) O. Bludsky̌, J. Chocholoušová, J. Vacek, F. Huisken, and P. Hobza, J. Chem. Phys. 113, 4629 (2000).
- Woutersen et al. (2001) S. Woutersen, Y. Mu, G. Stock, and P. Hamm, Chem. Phys. 266 (2001).
- Woutersen et al. (2002) S. Woutersen, R. Pfister, Y. Mu, D. Kosov, and G. Stock, J. Chem. Phys. 117, 6833 (2002).
- Mu and Stock (2002) Y. Mu and G. Stock, J. Phys. Chem. B. 106, 5294 (2002).
- Mu et al. (2003) Y. Mu, D. Kosov, and G. Stock, J. Phys. Chem. B. 107, 5064 (2003).
- Nguyen and Stock (2003) P. Nguyen and G. Stock, J. Chem. Phys. 119, 11350 (2003).
- Torii and Tasumi (1998) H. Torii and M. Tasumi, Journ. of Ram. Spect. 29, 81 (1998).
- Schweitzer-Stenner et al. (2001) R. Schweitzer-Stenner, F. Eker, Q. Huang, and K. Griebenow, J. Am. Chem. Soc. 123 (2001).
- Levy and Becker (2001) Y. Levy and O. Becker, J. Chem. Phys. 114, 993 (2001).
- Shi et al. (2002) Z. Shi, C. Olson, G. Rose, R. Baldwin, and N. Kallenbach, PNAS 99, 9190 (2002).
- Garcia (2004) A. Garcia, Polymer 45, 669 (2004).
- Yakubovitch et al. (a) A. Yakubovitch, I. Solov’yov, A. Solov’yov, and W. Greiner, eprint arXiv: physics/0406093.
- Yakubovitch et al. (b) A. Yakubovitch, I. Solov’yov, A. Solov’yov, and W. Greiner, eprint arXiv: physics/0406094.
- Guet et al. (2001) C. Guet, P. Hobza, F. Spiegelman, and F. David, eds., Atomic Clusters and Nanoparticles, NATO Advanced Study Institute, les Houches Session LXXIII, les Houches, 2000 (EDP Sciences and Springer Verlag, Berlin, 2001).
- Solov’yov and Connerade (2004) A. Solov’yov and J.-P. Connerade, eds., Latest Advances in Atomic Cluster Collisions Fission, Fusion, Electron, Ion and Photon Impact (World Scientific Press, 2004).
- Lindgren and Morrison (1986) L. Lindgren and J. Morrison, Atomic Many-Body Theory (Springer-Verlag, New York, Heidelberg, Berlin, 1986).
- Hohenberg and Kohn (1964) P. Hohenberg and W. Kohn, Phys. Rev. 136, B864 (1964).
- Becke (1988) A. Becke, Phys.Rev. A 38, 3098 (1988).
- Lee et al. (1988) C. Lee, W. Yang, and R. Parr, Phys. Rev. B 37, 785 (1988).
- Parr and Yang (1989) R. Parr and W. Yang, Density-Functional Theory of Atoms and Molecules (Oxford University Press, Oxford, New York, 1989).
- Bax (2003) A. Bax, Prot. Sci. 12, 1 (2003).
- Sheik et al. (2002) S. Sheik, P. Sundararajan, A. Hussain, and K. Sekar, Bioinformatics 18, 1548 (2002).
- Voet and Voet (2004) D. Voet and J. Voet, Biochemistry (John Willey and Sons, Inc., USA, 2004).