Toward synthesis of solar wind and geomagnetic scaling exponents: a fractional Lévy motion model
Abstract
Mandelbrot introduced the concept of fractals to describe the non-Euclidean shape of many aspects of the natural world. In the time series context he proposed the use of fractional Brownian motion (fBm) to model non-negligible temporal persistence, the “Joseph Effect”; and Lévy flights to quantify large discontinuities, the “Noah Effect”. In space physics, both effects are manifested in the intermittency and long-range correlation which are by now well-established features of geomagnetic indices and their solar wind drivers. In order to capture and quantify the Noah and Joseph effects in one compact model we propose the application of the “bridging” fractional Lévy motion (fLm) to space physics. We perform an initial evaluation of some previous scaling results in this paradigm, and show how fLm can model the previously observed exponents. We suggest some new directions for the future.
guessConjecture {article} {opening}
1 Introduction
Ever since it became clear that Earth’s magnetosphere is influenced by the sun, significant effort has been devoted to establishing the relationship between fluctuations in the energy delivered by the solar wind to the magnetosphere and variations in the magnetospheric response. A particularly important diagnostic for the response has been the family of geomagnetic indices, especially the Auroral Electrojet index [Davis and Sugiura (1966)]. A common proxy for the solar wind input is the function [Perreault and Akasofu (1978)] which estimates the fraction of the solar wind Poynting flux through the dayside magnetosphere.
One approach is to investigate causal relationships, and considerable sophistication has now been developed in this (e.g. Ukhorskiy et al.,2004;March et al,2005 and references therein). However, even without examining causality, significant information can be obtained by examining the scaling behaviour of fluctuations. A first analysis of this, in the Fourier domain, was done by Tsurutani et al.Tsurutani et al. (1990) using the power spectrum. Subsequent analyses have introduced other methods for detecting scale invariance (e.g. Takalo et al.,1993;Freeman et al.,2000a; 2000b;Uritsky et al.,2001). Most recently Hnat et al., Hnat et al. (2002a, b, 2003a, 2003b, 2005) and Chapman et al.,Chapman et al. (2005) have studied the scaling collapse of the increments of time series.
A fundamental problem has been raised by the evidence for multifractality in some solar wind quantities (e. g. Hnat et al.,Hnat et al. (2002a) and references therein) and the index Consolini et al. (1996). Multifractality is physically well motivated-at least for solar wind quantities-in that it arises naturally from the intermittency of multiplicative turbulent cascade models Frisch (1995). Multifractality would imply that the Hurst’s “roughness” exponent is not constant but varies from scale to scale. This evidence for multifractality in the indices thus means that any comparison of pairs of scaling exponents derived from solar wind and geomagnetic indices may be problematic Watkins (2002); Chang and Consolini (2001). Preliminary comparisons of solar wind and geomagnetic field measurements made using multiscaling measures Vörös et al. (1998) showed similarity at low orders after low pass filtering of the magnetospheric quantities. However, Hnat et al.(2002-2005), in examining a range of solar wind quantities, have recently found some apparent simplifications. They see the intriguing result that although some quantities (notably and ) do not show a simple scaling collapse, consistent with their well-known multifractality, others (such as ) do i.e. they are, in this sense, effectively monofractal. Recently Hnat et al.Hnat et al. (2003b) have extended the 1 year dataset studied by Hnat et al.Hnat et al. (2002b)to the 10 years used by Freeman et al.Freeman et al. (2000a). They find that when such long auroral index datasets are examined, and do indeed have discernably different PDFs.
Such analyses are not easy to compare. Some used overlapping index and solar wind time series Uritsky et al. (2001), other did not Freeman et al. (2000a). Techniques which impose finite limits on the integral used to evaluate structure functions have also been explored (Chapman et al. (2005) and references therein). The choice of solar wind measures and geomagnetic time series has also varied. It seems to us thus imperative to try to start to reconcile the various studies and understand why some show much greater similarity between the solar wind signal and indices than others. We also believe that the synthesis of observations will help towards a goal we have proposed elsewhere: The definition of models which are either I) simple, statistical, “strawman” models which may nonetheless capture some relevant fluctuation phenomenology e.g. the fractional lognormal model sketched by WatkinsWatkins (2002)) or II) more clearly statistical physics-based e.g. the generalised Fokker-Planck model of Hnat et al.Hnat et al. (2005) and Chapman et al.Chapman et al. (2005)).
By analogy with mathematical economics we may think of the Type I models as modelling the “stylized facts” of the coupled solar wind magnetospheric system Watkins (2002). In this paper we shall introduce one such model: fractional Lévy motion Mandelbrot (1995); Chechkin and Gonchar (2000b), in order to see how well it can describe the solar wind function and the family of indices ( itself, and ). Preliminary comparison is made with some of the measurements listed above, and it is shown that the model provides a good quantitative explanation for the difference between two scaling exponents first noted in this context by Hnat et al.Hnat et al. (2002a) as well as a possible qualitative explanation for the multifractal behaviour seen by Hnat et al.Hnat et al. (2003b). Where relevant, the effect of the truncation (finite variance) implicit in both a natural data series and a computer model are noted. Future directions are then sketched.
2 Datasets used
The and data are a 1 year subset of those studied by Hnat et al.Hnat et al. (2002b, 2003a). They correspond to the years 1978 and 1995 respectively. As with Hnat et al. (2002b) solar wind data is taken only for periods when WIND is definitely in the solar wind, see Freeman et al. (2000a) for details. We follow Hnat et al.Hnat et al. (2002b) by firstly differencing the time series of the indices and at intervals of times the fundamental sampling period (1 minute for the indices and and 46 seconds for ) to generate difference time series . For further details of the dataset and preprocessing techniques see Hnat et al. (2002b) and references therein.
3 Motivation for and testing of a fractional Lévy motion model
3.1 Fractional Lévy motion as a bridge between Lévy flights and fractional Brownian motion
As noted by MandelbrotMandelbrot (1995):
The “normal” model of natural fluctuations is the Wiener Brownian motion process (WBm). By this standard, however, many natural fluctuations exhibit clear-cut “anomalies” which may be due to large discontinuities (“Noah Effect”) and/or non-negligible global statistical dependence (“Joseph Effect”). [Mandelbrot’s book “The Fractal Geometry of Nature”] … shows that one can model various instances of the Noah effect by the classical process of [standard Lévy motion] (sLm), and various instances of the Joseph effect by the process of [fractional Brownian motion] (fBm).
Takalo et al.Takalo et al. (1993) were the first to use fBm as a model of the auroral indices, but it subsequently could not describe the highly non-Gaussian leptokurtic distributions seen in differenced solar wind and geomagnetic index quantities. This can for example be seen in Fig. 7 of Chapman et al. (2005) where the pdf of differences of is contrasted with the Gaussian pdf of an fBm with equal Hurst exponent . Similarly we are are aware of only a small number Kabin and Papitashvili (1998); Consolini et al. (1997); Hnat et al. (2002a); (2004) of discussions of the use of truncated sLm as a model for in-situ solar wind, magnetotail or ground-based magnetometer time series. One reason why sLm has not seen wider use here is because it cannot reproduce the correlated increments seen for both these types of data and also because it models superdiffusive () rather than the observed subdiffusive () behaviour. The term “truncated Lévy flight” usually indicates standard Lévy motion with a finite variance introduced deliberately by means of a finite range cutoff (c.f. the discussion in section 8.4 of (2000)); however any finite (and thus finite-variance) series of sLm must also be naturally truncated, but in an uncontrolled fashion Nakao (2000).
MandelbrotMandelbrot (1995) went on to note that:
sLm and fBm, however, are far from exhausting the anomalies found in nature … many phenomena exhibit both the Noah and Joseph effects and fail to be represented by either sLm or fBm … One obvious bridge, fractional Lévy motion, is interesting mathematically, but has found no concrete use”.
Since those words were written, fLm has found applications, notably in geophysics Painter and Patterson (1994) and telecommunications network modelling Laskin et al. (2002). We here apply it to essentially the same need; to compactly describe and unify the “stylized facts” of the well-demonstrated Noah and Joseph effects in space plasma physics time series Watkins (2002).
3.2 Mathematical definition of fractional Lévy motion
Fractional Lévy motion can be defined using a Riemann-Liouville fractional integral generalising the better-known expression for fractional Brownian motion Voss (1985). We here adapt the notation of equation 5 of Laskin et al.Laskin et al. (2002), which defines a process :
| (1) |
Equation (1) can be unpacked as a summation of Lévy stable increments each weighted by a response function . The parameter describes the power law tail of the pdf of which falls off as . is the special, Gaussian, case corresponding to fBm. is the parameter which controls long-range dependence. It is well known to be related to the power spectral density for fractal processes with finite variance Voss (1985), but can also be rigorously defined through fractional differentiation in other cases Chechkin and Gonchar (2000b).
With and taking in addition the response function becomes unity, giving an uncorrelated random Gaussian walk (WBm). Keeping but allowing to vary in the range to describes sLm. fLm is thus in general a process with allowed to vary in the range and so forms a bridge between the sLm and fBm “axes”. fLm thus by construction exhibits both the sources of anomalous diffusion identified by Mandelbrot above.
These limits have corresponding simplified Fractional Kinetic Equations (FKE) for the pdf , see section 5.2 of Zaslavsky (2002). Putting with , WBm is given by the diffusion equation ; fBm by ; and sLm by . fLm should thus correspond to equation (132) of Zaslavsky (2002):
| (2) |
All cases have a fixed diffusion constant . Future work is required to establish if this simplified form of equation (127) of Zaslavsky (2002), the full FKE, can map on to the Fokker-Planck equation of Hnat et al. (2005) or whether the full equation, including fractional drift and diffusion terms, is needed. After initial submission of this paper we also became aware of the relevance of the work of Milovanov and ZelenyiMilovanov and Zelenyi (2001) to the interpretation of fLm as an FKE; see in particular their equation (3).
3.3 Self-similarity, the Hurst exponent and peak scaling
We now follow Laskin et al.Laskin et al. (2002) to show that is indeed an H-selfsimilar process. To see this we first put in (1). We then use the fact that the increments are defined to be self-similar i.e. are equal in distribution () to . Then
| (3) |
with a self-similarity parameter given by
| (4) |
more usually known as the Hurst exponent. Note that we would not necessarily expect this equation to hold for more general fractal processes. In the fBm case and for that case only we recover the well known expression that . In the sLm case and we find . Recently MandelbrotMandelbrot (2002) has proposed writing
| (5) |
where he defines a Joseph (long range dependence) exponent () and a Noah (heavy tail) exponent (=).
The first property that needs to be shown in a time series for fLm to be a candidate model is thus -selfsimilarity. This can be tested by a number of methods. The first is scaling collapse, which was shown for the datasets in our paper by Hnat et al.Hnat et al. (2002b, 2003a).
An fLm model also implies that the pdf of returns i.e will scale with with exponent also equal to . This was shown in Fig. 2 of Hnat et al. (2002b). For convenience in figure 1 we show a comparison of the scaling regions of the 1 year signals taken from the natural time series and . All are seen to scale up to approximately minutes ( hour). Caution is however necessary because in a natural dataset the moments would be expected to be dominated in the small limit by the scaling of the measurement noise on the differences rather than that of the physical variables themselves Hnat et al. (2005).
Interestingly, although the exponent needed to rescale the pdfs of differences taken from fLm is the “full” extended defined in equation (4), the difference pdfs have the same shape they would have for an sLm with the same value. This is analogous to the way in which fBm retains the same Gaussian distribution as the steps from which it is composed, despite their statistical dependence, and is why fLm is also known as “linear fractional stable motion”.

3.4 Structure functions and their scaling exponents : as , while the pdf of returns gives
One may extend the idea of self-similarity expressed by to the generalised q-th order structure functions Frisch (1995):
| (6) |
where need not be integer. If a given is empirically found to be a power law we can then define an exponent from .
For a stable self-similar process where all moments are finite , i.e. WBm () or fBm (), the exponents of the structure functions follow , as we have checked by simulating an fBm using the same fLm algorithm as used for the figures, in the limit. By definition we then have . Additionally in these Gaussian () cases , which from Equation (4) then implies .
The exponent derived from the pdf of returns can be shown to be equivalent to [Miriam Forman, private communication, 2002] so for self-similar processes (see also our figure 5) the plot of versus is antisymmetric about at least insofar as .
3.5 Second order moment and : Pseudo-Gaussian behaviour of truncated Lévy time series
Because of the relation for WBm and fBm, a complementary estimate of the self-similarity parameter can, for these cases, be obtained from from the well-known growth of the standard deviation of the difference time series with differencing interval . Indeed the growth of a measured as in the case of WBm defines diffusive behaviour. is the square root of variance and thus scales like , i.e. as , i.e. it follows Mandelbrot’s Mandelbrot (2002) Joseph exponent (which from (4) will be identical to in the Gaussian WBm or fBm cases).
In the case of Lévy motion, however, whether ordinary or fractional, the order moments (where ) taken from a set of data points are theoretically infinite as in contrast to the convergence seen for Gaussians. It is thus not a priori obvious how the variance of a truncated, finite-, time series would be expected to scale. This is significant because any simulation that we perform of fractional Lévy motion is effectively one of truncated Lévy motion; while a natural time series will also have a finite variance in practice. The possible relevance of this question to data is clearly illustrated by our Figure (2), (see also table 1 of Hnat et al. (2002b)) in which for the solar wind variable is seen to scale with an exponent of 0.29 as opposed to the values around seen for the 3 geomagnetic index quantities. Rather than scaling with , still appears to be showing pseudo-Gaussian behaviour i.e. following , in that for this time series (estimated by wavelet methods) giving .

The apparent disadvantage of the loss of a second, independent, estimate of seems to be compensated for by the possibility that we can use the growth of to measure i.e. we can effectively use it as a measurement of . On the assumption that a naturally truncated fLm describes our data we can build a table (Table 1) of the measured and values and then predict using equation (4).
| Variable | Measured | Measured | Inferred | Inferred | Predicted |
|---|---|---|---|---|---|
| 0.47 | 0.45 | 1.90 | 0.52 | 1.92 | |
| 0.43 | 0.43 | 1.86 | 0.5 | 2 | |
| 0.46 | 0.43 | 1.86 | 0.53 | 1.88 | |
| 0.45 | 0.29 | 1.58 | 0.66 | 1.51 |
On inspecting Table I the first point is that the values of and are so close in the case of that if we assume they are exact the predicted becomes 2, eliminating fLm as a model for . The is sub-diffusive, so fBm would remain a possible candidate model; however the observed Hnat et al. (2003a) difference pdfs for are non-Gaussian, eliminating fBm. The error bars quoted in Table I suggest these conclusions may be too harsh. fLm would, however, seem more suitable as a model for and .
As a test we may also consider the values of and for solar wind obtained by Hnat et al.Hnat et al. (2002a). Their figure 3 gives in our parlance, while they report a scaling exponent for of 0.28 (i.e. ). Inserting this into equation (4) predicts , which is equivalent to the of their equation (3) (see also their Figure 4) which they find to be , encouragingly good agreement.
3.6 Fractional Lévy simulation: Comparison with first and second order measures
We can then now simulate fLm using parameters drawn from natural data to see if the inferences we have drawn above are indeed consistent, and to qualify fLm as at least a possible proxy for these time series. We use the published algorithm of Wu et al. (2004). This has the advantage of being linked more closely to the definition of fLm from equation (1) than the (faster) approach of replacing Chechkin and Gonchar (2000b)a Gaussian random number generator by a Lévy generator in otherwise standard Fourier filter methods Voss (1985). A comparison of these two approaches will be reported in a future paper.
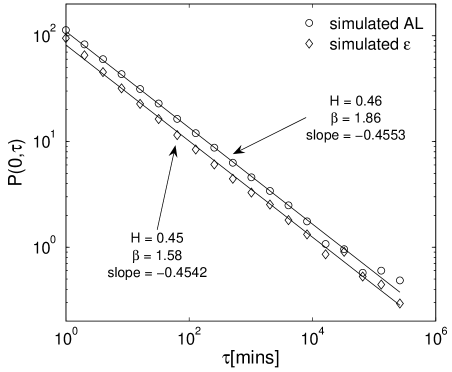
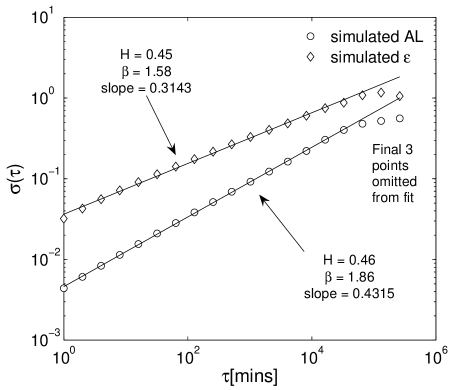
We show simulation results for synthetic and time series. These were specified by the ordered pairs of (1.86,1.88) and (1.58,1.51) respectively. The scaling for both series (Figure 3) is seen to follow as we expect, so both model series have very similar measured values, as we also saw in their natural counterparts (Figure (1)). Conversely, for finite samples of fLm, however, modelling and we see from Figure (4) that rather than following , the measured on the difference time series still grows as i.e. it does, as postulated in subsection 3.5, measure rather than .
This effect requires some discussion. It seems to be a further manifestation of the “pseudo-Gaussian” behaviour of truncated standard Lévy motion Chechkin and Gonchar (2000a), and known Nakao (2000) to be responsible for the result in that case (see also Figure 5). Our simulations have clearly demonstrated that it generalises to the long-range dependent fLm case i.e. that in general for fLm . This conclusion is most clearly supported by Figure 5 where the value can be read off as following this relation over the range to . The agreement is poorer at smaller values tested. We currently think this reflects known difficulties with accurately simulating strongly anticorrelated fLm Chechkin and Gonchar (2000b). The effect has previously been remarked on in the truncated standard Lévy paradigm; for example the S&P 500 financial time series, depicted by (2000) where (their Fig. 11.4.a) so grows as (their Fig. 11.3a), in contrast to an value from peak scaling of (their Fig. 9.3).
In the multifractal modelling community the power spectrum has long been seen as only just one of several ways of measuring . For this reason a difference in the value of has sometimes been claimed as direct evidence of the inapplicability of any additive model and thus the immediate need for a multiplicative model Schertzer and Lovejoy (1987).
Conversely our result would seem to suggest that any truncated stable additive model other than the fBm/WBm limiting cases is likely to show , and without the need for a multiplicative model. This may be understood as being because truncated Lévy motion, whether standard or fractional, behaves as a bifractal Nakao (2000). There may be natural time series where additive fLm is actually the most natural model, or at least an economical and easily specified one.
3.7 plots and the multifractality of truncated Lévy motions
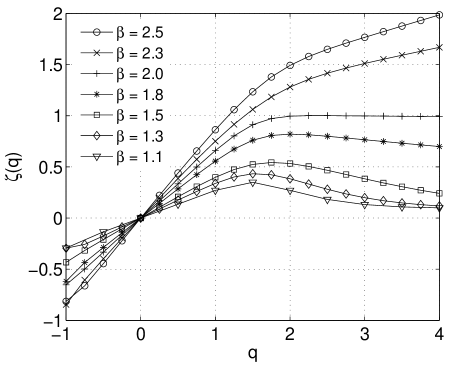
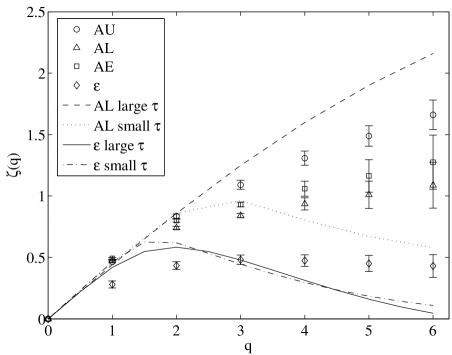
At this point it may be objected that we have not tested any predictions of the fLm model against the behaviour of natural time series other than those properties used to specify it. Our first additional check is thus to examine the multi-affine behaviour seen in the data and the model using the “ plots” defined in section 3.4. Such a plot, showing scaling exponent versus moment is shown for the data in figure (6). Interestingly most resembles a “classic” multifractal, in that the points lie on a curve rather than a straight or broken line Frisch (1995). However , or at least , have which arguably flattens out near 1 for higher moments. intriguingly even seems to fall as increases. This behavior is qualitatively similar to that seen for our simulated and time series, whose plots are superposed on the figure. In particular a change in the range of over which the simulated structure functions are taken to be power laws is enough to encompass the observed range of plots for . More detailed comparison is at present prevented by the difficulty of obtaining accurate values of for high moments-an issue also afflicting analysis of real data.
4 Conclusions
A significant body of data and models now exists for the problem of solar wind and magnetic index scaling. We have here suggested a complementary approach, motivated in particular by the need to i) reconcile differing estimates of scaling exponents (in hindsight the Joseph and Hurst exponents and ); ii) model subdiffusive behaviour (); and iii) model long-ranged correlation (). We proposed the use of a simple and economical model: fractional Lévy motion, to describe the scaling of the above quantities. Initial consistency checks with respect to the distribution of returns and the scaling of standard deviation support the use of fLm, and the multi-affine “zeta plots” are more qualitatively similar. Importantly we find that the degree of similarity between model solar wind and the model index does indeed depend on the moment order at which comparison is made, but that this does not, however, require a multiplicative process to explain it. The difference can, rather, be understood as coming from the bifractality of a truncated fractional Lévy motion. This explains why some measures such as from the distribution of returns or pdf rescaling are much closer to each other than, for example, the -based exponent (which we found to measure , not ).
The present paper has been mainly concerned with the modelling of measured quantities rather than the extent to which they are artificial. For geomagnetic indices and other constructed quantitities like , however, the extent to which scaling behaviour could be an artefact of the construction method is an important issue. We are aware of some progress in studying this problem (e.g. Edwards Edwards (2001), Weigel and Baker Weigel and Baker (2003)), more will be needed. Further work is also underway to test the predictions of the fLm model against other scaling studies such as the cited burst lifetime and spreading exponent investigations.
Acknowledgements.
We acknowledge the provision of data by WIND SWE and MFI teams, and the World Data Centre at RAL. We are grateful to Gary Abel, Miriam Forman, Sean Lovejoy, Murray Parkinson, George Rowlands, Misha Sitnov, Zoltan Vörös and James Wanliss for many helpful interactions.References
- (1) Bruno, R., L. Sorriso-Valvo, V. Carbone, and B. Bavassano. A Possible Truncated-Lévy-flight Statistics Recovered From Interplanetary Solar-wind Velocity and Magnetic-field Fluctuations. Europhysics Letters, 66(1):146–152, 2004.
- Chang and Consolini (2001) Chang, T. S., and G. Consolini. Magnetic Field Topology and Criticality in Geotail Dynamics: Relevance to Substorm Phenomena. Space Science Reviews, 95(1–2):309-321, 2001.
- Chapman et al. (2005) Chapman, S. C., B. Hnat, G. Rowlands, and N. W. Watkins. Scaling Collapse and Structure Functions: Identifying Self-Affinity in Finite Length Time Series. Nonlinear Processes in Geophysics, 12:767-774, 2005.
- Chechkin and Gonchar (2000a) Chechkin, A. V., and V. Yu. Gonchar. Self and Spurious Multi-affinity of Ordinary Lévy Motion, and Pseudo-Gaussian Relations. Chaos, Solitons and Fractals, 11(14):2379-2390, 2000a.
- Chechkin and Gonchar (2000b) Chechkin, A. V., and V. Yu. Gonchar. A Model for Persistent Lévy Motion. Physica A, 277:312–326, 2000b.
- Consolini et al. (1996) Consolini, G., M. F. Marcucci, and M. Candidi. Multifractal Structure of Auroral Electrojet Index Data. Physical Review Letters, 76:4082–4085, 1996.
- Consolini et al. (1997) Consolini, G., L. Cafarela, P. De Michelis, M. Candidi, and A. Meloni Non-Gaussian Probability Distribution of Short Time Scale Magnetic Field Fluctuations at Terra Nova Bay (Antarctica). In S. Aiello, N. Iucci, G. Sironi, A. Treves and U. Villante, editors, Cosmic Physics in the Year 2000, SIF Conference Proceedings Volume 58. SIF, Bologna, Italy, 1997.
- Davis and Sugiura (1966) Davis, T. N., and M. Sugiura. Auroral Electrojet Activity Index AE and its Universal Time Variations. Journal of Geophysical Research, 71:785–801, 1966.
- Edwards (2001) Edwards, J. W., A. S. Sharma, and M. I. Sitnov. Spatio-temporal Structure of Geomagnetic Activity Triggered by Dynamic Pressure Pulses: Mutual Information Functional Analysis. Bulletin of the American Physical Society, 27:156, 2001.
- Freeman et al. (2000a) Freeman, M. P., N.W. Watkins, and D.J. Riley. Evidence for a Solar Wind Origin of the Power law Burst Lifetime Distribution of the AE Indices. Geophysical Research Letters, 27:1087–1090, 2000a.
- Freeman et al. (2000b) Freeman, M. P., N.W. Watkins, and D.J. Riley. Power law Distributions of Burst Duration and Interburst Interval in the Solar Wind: Turbulence or Dissipative Self-organized Criticality?. Physical Review E, 62(6):8794-8797, 2000b.
- Frisch (1995) Frisch, U. Turbulence: the Legacy of A. N. Kolmogorov. Cambridge University Press, 1995.
- Hnat et al. (2002a) Hnat, B., S. C. Chapman, G. Rowlands, N. W. Watkins, and W. M. Farrell. Finite Size Scaling in the Solar Wind Magnetic Field Energy Density as Seen by WIND. Geophysical Research Letters, 29(10), doi:10.1029/2001GL014587, 2002a.
- Hnat et al. (2002b) Hnat, B., S. C. Chapman, G. Rowlands, N. W. Watkins, and M. P. Freeman. Scaling of Solar Wind and the and Indices as Seen by WIND. Geophysical Research Letters, 29(22), 2078, doi:10.1029/2002GL016054, 2002b.
- Hnat et al. (2003a) Hnat, B., S. C. Chapman, G. Rowlands, N. W. Watkins, M. P. Freeman. Correction to “Scaling of Solar Wind and the and Indices as Seen by WIND”. Geophysical Research Letters, 30:(8), 1426, doi:10.1029/2003GL017194, 2003a.
- Hnat et al. (2003b) Hnat, B., S. C. Chapman, G. Rowlands, N. W. Watkins, and M. P. Freeman. Scaling in Long Term Data Sets of Geomagnetic Indices and Solar Wind Epsilon as Seen by WIND Spacecraft. Geophysical Research Letters, 30(22), 2174, doi:10.1029/2003GL018209, 2003b.
- Hnat et al. (2005) Hnat, B., S. C. Chapman, and G. Rowlands, Scaling and a Fokker-Planck model for Fluctuations in Geomagnetic Indices and Comparison with Solar Wind as Seen by WIND and ACE. Journal of Geophysical Research, 110, A08206, doi:10.1029/2004JA010824, 2005.
- Kabin and Papitashvili (1998) Kabin, K., and V. O. Papitashvili. Fractal Properties of the IMF and the Earth’s Magnetotail Field. Earth Planets Space, 50:87-90 (1998).
- Laskin et al. (2002) Laskin, N., I. Lambadaris, F. Harmantzis, and M. Devetsikiotis. Fractional Lévy motion and its application to network traffic modelling. Computer Networks, 363-375 (2002).
- Mandelbrot (1995) Mandelbrot, B. B. Introduction to Fractal Sums of Pulses. In M. F. Shlesinger, G. M. Zaslavsky, and U. Frisch, editors, Lévy flights and Related Topics in Physics: Proceedings of the International Workshop, Nice, France, June, 1994. Lecture Notes in Physics: 450. Springer-Verlag, Berlin, 1995.
- Mandelbrot (2002) Mandelbrot, B. B. Gaussian Self-Affinity and Fractals: Globality, the Earth, 1/f Noise and R/S . Springer Verlag, 2002.
- (22) Mantegna, R. N., and H. E. Stanley. An Introduction to Econophysics: Correlations and Complexity in Finance. Cambridge University Press, 2000.
- March et al (2005) March, T. K., S. C. Chapman, and R. O. Dendy. Mutual Information Between Geomagnetic Indices and the Solar Wind as Seen by WIND: Implications for Propagation Time Estimates. Geophysical Research Letters, 32, L04101,doi:10.1029/2004GL021677, 2005
- Milovanov and Zelenyi (2001) Milovanov, A. V., and L. M. Zelenyi. “Strange” Fermi Processes and Power-law Nonthermal Tails From a Self-consistent Fractional Kinetic Equations. Physical Review E, 64:052101, 2001.
- Nakao (2000) Nakao, H. Multi-scaling Properties of Truncated Lévy Flights. Physics Letters A, 266(4–6), 282-289, 2000.
- Painter and Patterson (1994) Painter, S., and L. Patterson. Fractional Lévy Motion as a Model for Spatial Variability in Sedimentary rock. Geophysical Research Letters, 21(25): 2857-2860, 1994.
- Perreault and Akasofu (1978) Perreault, P., and S.-I. Akasofu. A Study of Geomagnetic Storms. Geophysical Journal of the Royal Astronomical Society, 54: 547–573, 1978.
- Schertzer and Lovejoy (1987) Schertzer, D., and S. Lovejoy. Physical Modeling and Analysis of Rain and Clouds by Anisotropic Scaling Multiplicative Processes. Journal of Geophysical Research, 92(D8):9693–9714, 1987.
- Takalo et al. (1993) Takalo, J., Timonen, J., and H. Koskinen. Correlation Dimension and Affinity of AE Data and Bicolored Noise. Geophysical Research Letters, 20(15): 1527-1530, 1993.
- Tsurutani et al. (1990) Tsurutani, B. T., M. Sugiura, T. Iyemori, B. E. Goldstein, W. D. Gonzalez, S.-I. Akasofu, E. J. Smith. The Nonlinear Response of AE to the IMF Driver: A Spectral Break at Hours. Geophysical Research Letters, 17:279–282, 1990.
- Ukhorskiy et al. (2004) Ukhorskiy, A. Y., Sitnov, M. I., Sharma A. S., Papadopoulos K. Global and Multi-scale Features of Solar Wind-magnetosphere Coupling: From Modeling to Forecasting, Geophysical Research Letters, 31(8):L08802, 2004.
- Uritsky et al. (2001) Uritsky, V. M., A. J. Klimas and D. Vassiliadis. Comparative Study of Dynamical Critical Scaling in the Auroral Electrojet Index Versus Solar Wind Fluctuations. Geophysical Research Letters, 28:3809–3812, 2001.
- Vörös et al. (1998) Vörös, Z., P. Kovacs, A. Juhasz, A. Kormendi and A. W. Green. Scaling Laws from Geomagnetic Time Series. Geophysical Research Letters 25:2621–2624, 1998.
- Voss (1985) Voss, R. F. Fractals in Nature: From Characterization to Simulation. In Heinz-Otto Peitgen and Dietmar Saupe, editors, The Science of Fractal Images. Springer-Verlag, Berlin Heidelberg New York Tokyo, 1985
- Watkins (2002) Watkins, N. W. Scaling in the Space Climatology of the Auroral Indices: is SOC the Only Possible Description?. Nonlinear Processes in Geophysics, 9(5-6):389–397, 2002.
- Weigel and Baker (2003) Weigel, R. S. and D. N. Baker. Probability distribution invariance of 1-minute auroral zone geomagnetic field fluctuations. Geophysical Research Letters, 30(23), 2193, doi:10.1029/2003GL018470, 2003.
- Wu et al. (2004) Wu, W. B., G. Michailidis, and D. Zhang. Simulating Sample Paths of Linear Fractional Stable Motion. IEEE Transactions On Information Theory, 50(6):1086–1096, 2004.
- Zaslavsky (2002) Zaslavsky, G. M., Chaos, Fractional Kinetics and Anomalous Transport. Physics Reports, 371:461-580, 2002.