AS-TEXONO/05-06
WCU/UI’05 Conference, Beijing, August 2005
Session : Cavitation Field and Sonoluminescence (3)
Paper No. : ThBam2-06
Date :
Observation of Fluorescence Emissions from
Single-Bubble Sonoluminescence
in Water doped with Quinine
J.Q. Lu α,β,
H.T. Wong α,111Corresponding Author
Email: htwong@phys.sinica.edu.tw;
Tel.: 886-2-2789-6789;
FAX: 886-2-2788-9828.
F.K. Lin α,
Y.H. Liu α,γ
α Institute of Physics, Academia Sinica, Taipei 11529, Taiwan
β Department of Physics, Nanjing University, Nanjing 210093, China
γ Department of Nuclear Physics, China Institute of Atomic Energy, Beijing 102413, China
Abstract
Sonoluminescence is a phenomenon involving the transduction of sound into light. The detailed mechanism as well as the energy-focusing potentials are not yet fully explored and understood. So far only optical photons are observed, while emissions in the ultra-violet range are only inferred. By doping the fluorescent dye quinine into water with dilute sulphuric acid, the high energy photons can be converted into the optical photons with slower decay constants. These sonoluminescence and fluorescent emissions were observed in coincidence, and the emitted signals of the two modes can be differentiated by their respective timing profiles. Plans for using this technique as a diagnostic tool to quantitatively study ultra-violet and other high energy emissions in sonoluminescence are discussed.
Keywords : Sonoluminescence, Ultrasonics, Fluorescence.
1 Introduction
Sonoluminescence (SL) are flashes of light emissions due to collapsing ultrasound-driven bubbles. Stable Single-Bubble Sonoluminescence (SBSL)[1, 2] was discovered in 1989 and have been under active studies. The detailed physics responsible for SL emissions as well the potentials and limitations for achieving very high temperatures are not fully explored and understood.
The detectable emissions from SBSL are so far restricted to the optical range (200 nm to 700 nm), the only window in the electromagnetic spectrum where water becomes transparent. In addition, the typical sensitive range for photo-multipliers (PMTs) commonly used in SL detection is 300 nm and peaks at 400 nm. Spectral analysis[3] suggested a temperature of 25000 K at the light-emitting surface if the spectrum would follow that for black-body radiations. However, since only the tail of the black-body spectrum is measure-able, there are substantial uncertainties in the temperature derivation. The same data in Ref. [3] was interpreted by other author to indicate a temperature of 40000 K[2]. In this case, the dominant energy fraction of the SBSL emissions should be in the ultra-violet (UV) range (300 nm), such that most energy from SBSL would be absorbed in the water and remains undetected. Still, the black-body model does not give the complete description since it fails to explain the lack of dependence of the pulse width to wavelength[2, 4]. In addition, there are recent controversial claims of tritium and neutron emissions from SL on deuterated-acetone[5] which, if confirmed, would indicate that the nuclear reaction temperatures of the order of 107 K can be achieved. In addition, existence of plasma at the inner core of the collapsing bubbles in SBSL with sulphuric acid was recently demonstrated[6], from which the derived temperature was 800015000 K. Another recent work[7] reported on SBSL emissions at the 1 MHz range, where the observed optical spectrum implies internal bremsstrahlung from a transparent plasma core at K.
It is therefore important to devise methods to experimentally probe the UV and other high energy emissions and to quantitatively measure the photon energy emitted. Measurements of the ratio between UV to optical photon energy can provide a probe to the temperature of the light emitting region.
This article describes the first step in our research efforts to address this question. The key ingredient is to dope the water with a fluorescent materials such that the energy of the UV emissions is converted (or “wavelength-shifted”) to fluorescent light (FL) in the optical range which can then traverse the water to be detected by PMTs. Observations of such FL emissions in SBSL were implicit in a previous study[8] where the emphasis were on the effect of active solutes to bubble dynamics and, in particular, the emission spectra. It was shown, averaging over a larger number of events, that the spectra emitted by SBSL in water doped with pyranine is shifted to peak at green (520 nm). The focus on this work is to study the timing profiles of SBSL emissions in water doped with a fluorescent dye, and to de-convolute the corresponding SL and FL components.
2 Experimental Set-Up
Most commonly used fluorescent dye with large light yields are not readily soluble in water or inorganic solvent. They are typically dissolved in organic solvent like xylene or pseudo-cumene to function as liquid scintillators for the detection of high energy radiations. The fluorescent dye quinine (chemical formula: ) was selected for our investigations since it readily dissolves in water mixed with dilute acid. The absorption and emission spectra of quinine[9] are depicted in Figure 1. There is little attenuation () to the emission spectra through 5 cm of water[10]. In our measurements, 1 g of quinine was dissolved in water mixed with 0.5 M(mole per liter) of dilute (that is, about 0.9%) sulphuric acid. It has been checked that this small admixture of sulphuric acid to water does not change observably the light yields and pulse shapes in SBSL, relative to those from pure water. Accordingly, we use “water” to denote 0.5 M dilute sulphuric acid for simplicity reasons in this article.
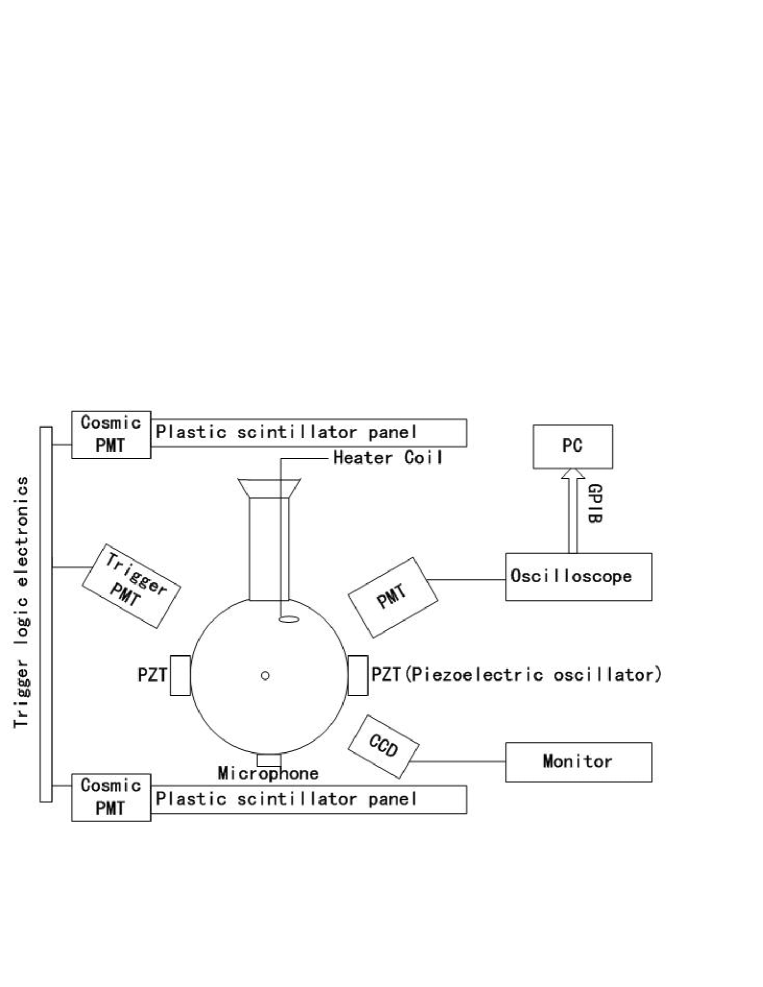
The schematic diagram of the experimental set-up is displayed in Figure 2. The standard SL configurations, gas manifold and water processing procedures[1] were adopted. The resonator was a spherical flask 6.4 cm in diameter, driven by two piezoelectric (PZT) oscillators at the resonance frequency of about 25.5 kHz through a function generator and power amplifier. A third PZT attached to the flask functioned as microphone monitoring the shock waves generated during bubble collapse.
Pure water was first degassed in a beaker inside a vacuum chamber, and a controlled gas composition was introduced while the beaker was stirred so that the water was in equilibrium with the gas content, where 10% air was used in this measurement. Sulphuric acid was added to the prepared water and quinine was subsequently dissolved into it. The liquid was placed in the resonator flask in a light-tight refrigerator box with temperature control between 0oC and 20oC. The seed of the bubble was generated by a NiCr heating wire.
The light emission were detected by two PMTs located directly outside the flask. One PMT was used to provide the trigger, while the signals from the other were sampled. The rise time of the PMT is about 2 ns, while the bialkaline photo-cathode has a maximal quantum efficiency at blue (420 nm). Images from a CCD camera provided independent visual checks. Output from the function generator, amplifier, microphone and the PMT were all monitored with oscilloscope to ensure stability and that the proper phase relations were maintained. Besides these standard set-up, a cosmic-ray telescope (CRT) consisting of two 7X6X3 cm3 plastic scintillator panels read out by PMTs were installed on top and bottom of the resonator flask. Events triggered by the CRT were used to study the characteristics of FL emissions.
The PMT pulse signal were recorded via a digital oscilloscope at 2.5 GHz sampling rate. An event-by-event data acquisition was performed, at a rate of about 5 Hz. The data were transferred from the oscilloscope via a GPIB-USB interface to a PC using the commercial LabView data acquisition software package. The total light yield is proportional to the integrated PMT signals.
3 Observations of Fluorescence Emissions
Light emissions from SBSL in water and in quinine-doped water were measured. The PMT signal profiles of individual events were measured. The pulse shapes reported in this Section are from the averaging over 1000 events.
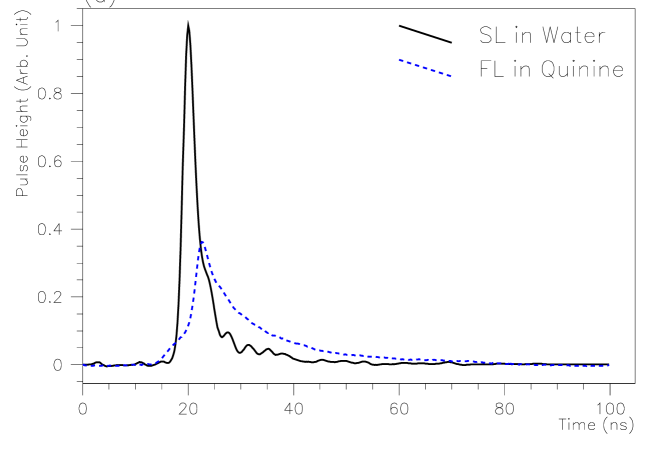
The measured pulse shape for prompt SL emissions in water () is shown in Figure 3a. The SL emissions are expected to be extremely fast at the 100 ps range[4, 11], such that the measured shape of in the ns scale reflects the response time of the PMT.
The pulse shape that corresponds to pure FL emissions () is also displayed in Figure 3a. It was obtained when the oscilloscope was triggered by the CRT while quinine-doped water was placed in the flask. Cosmic-ray events give rise to FL emissions in quinine-doped water, due to (a) ionization and excitation of the water molecules which transfer the energy to the quinine molecules leading to decays by fluorescence, and (b) absorption of the Cherenkov light by the quinine. The measured pulse shape is therefore dominated by the FL process. The decay time for is slower than that for , which is determined by the energy transfer and fluorescent processes in the quinine-doped water. Accordingly, the observed profile of in Figure 3b is the actual time-evolution of the FL emissions. Both the SL- and CRT- trigger PMTs provided timing to the oscilloscope through the same electronic circuitry with cables of the same length, to synchronize the SL and FL reference pulses.
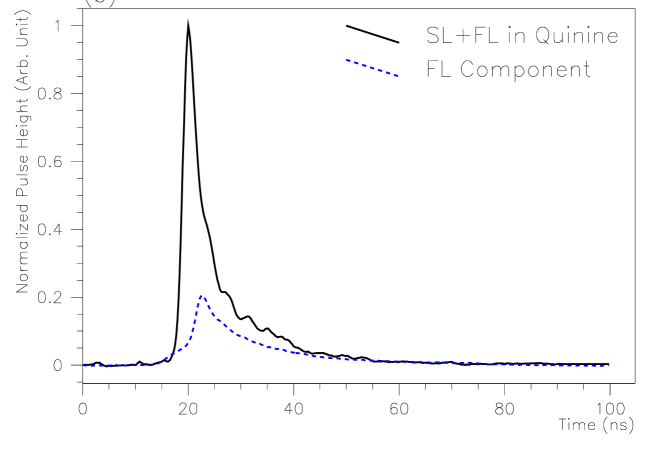
The observed pulse shape for SBSL emissions in quinine-doped water (), at the operating conditions of 10% air in water and a temperature of 3oC is shown in Figure 3b. Identical PMT and electronics triggering schemes were adopted as the measurement with pure water, so as to ensure good synchronization. The pulse consists of a fast component due to SL emissions, together with a slow component from the secondary FL due to absorption of the UV and high energy primary emissions. Using an area normalization scheme: , the various pulse profiles are related by:
The parameter represents the relative strength of FL emissions to the total signal output, while and denote possible residual time-shifts between the two reference pulses with respect to the .
Fitting the measured SBSL pulse shape in quinine-doped water with a minimum- algorithm in the ROOT software framework[12], the best-fit values of =, = ns and = ns at a per degree-of-freedom (/dof) of 468/497 were derived. Therefore, the FL component in SBSL under such conditions, as de-convoluted and depicted in Figure 3b, contributes to about 38% of the photo-electron yield in the PMT, and can be measured to accuracy. The values of and are close to zero, or alternatively, setting leads only to a 1.3% change in . Both observations indicate that the devised experimental procedures did allow good time-synchronizations among , and .
4 Research Plans
We have devised and demonstrated a method to convert the UV photons to observable optical signals which can be deconvoluted from the primary SL emissions. This technique allows quantitative studies on the emissions of high-energy radiations in Single-Bubble as well as Multi-Bubble Sonoluminescence which may shed lights on its underlying physics mechanism.
After proper calibrations, the measured -parameter can be translated to a ratio of energy output between UV and optical photons. This can be used to test and differentiate black-body and other theoretical models in SBSL[2, 13]. In the case of black-body spectra, the temperature at the light-emitting surface can be obtained, and this can be compared to that derived from the measurement of the optical spectra[3].
Systematic studies can be done with varying ambient conditions like temperature, gas and liquid compositions, acoustic pressure and driving frequency, to investigate the relative changes in . An increase in would imply enhanced high energy emissions relative to the optical light output. In particular, in the quest of identifying appropriate operating parameters which may favor higher temperature emissions in SL, a direct probe of the high energy radiations will be extremely essential.
Towards these ends, research efforts are pursued to devise the calibration schemes and to improve on the experimental hardware. In particular, a 2 GHz 4-channel Sampling Analog Digital Convertor running on VME-bus and Linux Operating System will be installed to replace the oscilloscope readout. This will make efficient event-by-event data taking with massive data flow possible. Large data samples will allow the studies of the -distribution, from which one can investigate if anomalous events may occur with small but finite probabilities.
We are grateful to the referee for critical reading and comments. This work was supported by contracts 92-2112-M-001-057 and 93-2112-M-001-030 from the National Science Council, Taiwan,
References
-
[1]
B.R. Barber et al., Phys. Report 281, 65 (1977);
S.J. Putterman and K.R. Weninger, Annu. Rev. Fluid Mech., 32, 445 (2000). - [2] M.P. Brenner, S. Hilgenfeldt and D. Lohse, Rev. Mod. Phys. 7, 425 (2002).
- [3] R. Hiller, S.J. Putterman, and B.P. Barber, Phys. Rev. Lett. 69, 1182 (1992).
- [4] B. Gompf et al., Phys. Rev. Lett. 79, 1405 (1997).
-
[5]
R.P. Taleyarkhan et al., Science 295, 1868 (2002);
R.P. Taleyarkhan et al., Phys. Rev. E 69, 036109 (2004). - [6] D.J. Flannigan and K.S. Suslick, Nature 434, 52 (2005).
- [7] C. Camara, S. Putherman and E. Kirilov, Phys. Rev. Lett. 92, 124301 (2004).
- [8] F. Grieser and M. Ashokkumar, Adv. Colloid Interface Sci., 89-90, 423 (2001).
- [9] H. Du et al., Photochemistry and Photobiology 68, 141 (1998); also at http://omlc.ogi.edu/spectra/PhotochemCAD/html/quinine(0.5M_H2SO4).html .
-
[10]
T.I. Quickenden and J.A. Irvin, J. Chem. Phys. 72, 4416 (1980);
R.M. Pope and E.S. Fry, Appl. Optics 36, 8710 (1997). -
[11]
M.J. Morgan et al., Nucl. Instrum. Methods B 96, 651 (1995);
R. Pecha et al., Phys. Rev. Lett. 81, 717 (1998). - [12] R. Brun and F. Rademakers, Nucl. Instrum. Methods A 389, 81 (1997).
- [13] Y. An, these Proceedings.