Immunization of Real Complex Communication Networks
Abstract
Most communication networks are complex. In this paper, we address one of the fundamental problems we are facing nowadays, namely, how we can efficiently protect these networks. To this end, we study an immunization strategy and found that it works almost as good as targeted immunization, but using only local information about the network topology. Our findings are supported with numerical simulations of the Susceptible-Infected-Removed (SIR) model on top of real communication networks, where immune nodes are previously identified by a covering algorithm. The results provide useful hints in the way to design and deploying a digital immune system.
pacs:
89.75.FbStructures and Organization in Complex Systems and 89.20.HhWorld Wide Web, Internet and 89.20.-aInterdisciplinary applications of physics1 Introduction
Communications networks have been intensively studied during the last several years as it turned out that their topology is far from being random fff99 ; pvv01 ; vazquez-2002 ; pv04 . In particular, it has been found that physical networks the Internet as well as logical the World Wide Web and peer-to-peer networks Gnutella are characterized by a power law degree distribution pv04 (thus, they are referred to as scale-free networks ba99 ; barabasi-1999 ), , where the degree or connectivity of a node is the number of nodes it is attached to. These findings, together with similar network structures found in fields as diverse as biological, social and natural systems dorogovtsev-2003-book ; newman03a ; book2 , have led to a burst of activity aimed at characterizing the structure and dynamics of complex networks.
The spreading of an epidemic disease in complex networks was among the relevant problems that were first addressed in the literature ceah00 ; pv00 ; pastor-satorras-2001 . Surprisingly, it was found that for infinite scale-free networks with , the epidemic always pervades the system no matter what the spreading rate is pv00 ; pastor-satorras-2001 ; mpv02 ; lm01a , even when correlations are taken into account boguna-2003a ; moreno-2003 ; vm02 . In other words, the usual threshold picture does not apply anymore. This fact would be a mere anecdote if not because most vaccination and public health campaigns are based on the existence of such a threshold am92 . In practice, it would be desirable to have a threshold as large as possible for a given epidemic disease.
Soon after the first studies on epidemic spreading, it was realized that traditional vaccination strategies based on random immunization, while worth taking for random network topologies, were useless in scale-free networkspv01c . Specifically, it was shown that a minimum fraction as large as of the nodes has to be immunized in order to recover the epidemic threshold. New vaccination strategies are thus needed in order to efficiently deal with the actual topology of real-world networks. A very efficient approach consists of vaccinating the highly connected nodes in order to cut the path through which most of the susceptible nodes catch the epidemics pv01c ; db01a . However, in order to do that, one has to identify the core groups or hubs of the system. In general, this is extremely unrealistic, particularly for large networks and systems lacking central organizational rules such as social networks.
In this paper, we consider the immunization problem from a different perspective. We show that it can be treated as a covering problem, in which a set of immune agents has to be placed somewhere in the network. The main advantage of this approach is that only local topological knowledge is needed up to a given distance , so that it can be straightforwardly applied to a real situation. To verify the results of the immunization strategy, we implement the Susceptible-Infected-Removed epidemiological model mpv02 ; lm01a on top of the Internet maps at the Autonomous Systems (AS) and router levels pvv01 ; vazquez-2002 ; pv04 and compare with the results obtained by using targeted and random immunization as well as a local immunization strategy. Our results indicate that the algorithm performs quite well and is near the optimal one. On the other hand, we show that the efficiency of the vaccination strongly depends on the degree-degree correlations as the covering outcome is directly related to the structure of the underlying network.
2 Susceptible-Infected-Removed model on Real Nets
In order to be able to compare the efficiency of the different immunization strategies, we first perform extensive numerical simulations of an epidemic spreading process on top of real architectures (here, epidemics refers to any undesired spreading process, i.e, virus, spam, etc). We consider the SIR model as a plausible model for epidemic spreading am92 ; mpv02 . In this model, nodes can be in three different states. Susceptible nodes, , have not been infected and are healthy. They catch the disease via direct contact with infected nodes, , at a rate . Finally, recovered nodes, , are those nodes that have caught the disease and have stopped spreading it with probability (without loss of generality, has been set to 1 henceforth). The relevant order parameter of the disease dynamics is the total number of nodes (or the fraction of them, ) that got infected once the epidemic process dies out, i.e., when no infected nodes are left in the system.

On the other hand, the simulations performed throughout this work have been carried out on real communication networks. The fact that any study thought to have practical applications should be tested in real systems led us to such an election. These networks have unique topological properties difficult to gather with existing generic network models namely, degree-degree correlations and clustering properties. The networks on top of which numerical simulations of the immunization strategies and the SIR dynamics have been performed are the following. AS: Autonomous system level graph representation of the Internet as of April 16th, 2001 asref . Gnutella: Snapshot of the Gnutella peer to peer network, provided by Clip2 Distributed Search Solutions. Router: Router level graph representation of the Internet routerref . The three networks are sparse and show an average degree around 3. Additionally, they are small-worlds ws98 with an average distance between vertices less than 10, and they are characterized by a power law degree distribution , with . A detailed characterization of these graphs is presented in Refs. vazquez03 (Gnutella) and pvv01 ; pv04 ; vpv02b (AS and Router graphs).
These networks share a number of topological features but are radically different in their degree-degree correlations. Correlations are usually defined taking into account the degrees of nearest-neighbors. We have recently shown pablo1 , however, that whether a network can be regarded as assortative (when correlations are positive, i.e., there is a tendency to establish connections between vertices with similar degrees) or disassortative (negative correlations, the tendency is the opposite) depends on the distance used to average the degrees of the neighboring vertices. The AS and the Gnutella graphs show dissortative correlations for any value of , though the correlations are smoothed as grows. On the other hand, in the Router network, the degree correlations are assortative up to . However, for the correlations become dissortative and beyond start to approach the uncorrelated limit as shown in Fig. 1 pablo1 . These peculiar properties directly affect the outcome of algorithms run on top of these networks.
In the following, we focus on the results obtained for the AS and router maps of the Internet. The behavior of both the epidemic spreading process and the immunization strategies for the Gnutella graph are qualitatively the same as for the AS map, with the only difference of more pronounced finite-size effects.
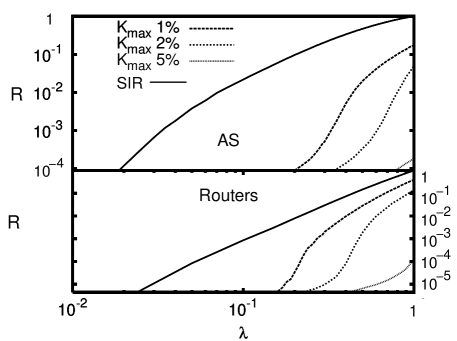
We have performed Monte Carlo simulations of the SIR model on top of the Internet maps. Starting from an initial state in which a randomly chosen node is infected, susceptible nodes catch the disease (or virus) with probability if they contact a spreader. In its turn, infected vertices become removed and do not take part anymore in the spreading process at a rate . The fraction of removed nodes, , when no spreaders are left in the system gives the epidemic incidence. All results have been averaged over at least 1000 realizations corresponding to different initially infected nodes. Figure 2 shows the epidemic incidence in the AS and router maps of the Internet as a function of the spreading rate .
As can be seen from the figure, the epidemic threshold is slightly larger in the router graph than in the network made up of AS’s. This difference in the behavior of the SIR model on different representations of the Internet may be understood from the distinct degree-degree correlations shown by both graphs. Though we think that the main differences in the algorithm’s performance are due to correlations, it should be noticed that a number of other topological features such as clustering and hierarchy properties may also be at the root of the different behaviors. Our guess is mainly based on the performance of local algorithms such as the covering recipe that we will use in the next section. As for correlations, in the AS map representation, highly connected nodes are likely connected to nodes with smaller degrees. Therefore, the spreading process generally passes alternatively from highly to poorly connected nodes. In this way, the epidemics has more chances to reach a number of nodes other than the hubs. This is not the case of the Router map, where it is more likely that hubs are grouped together and that once one of them get infected, its neighbors (also highly connected nodes) do so. However, when the epidemics leaves the hubs, the remaining (uninfected) nodes are, likely, poorly connected and with high probability the process will die out, specially for small values of . That is, in the router map, the epidemic reaches the hubs, but then goes down to nodes of decreasing degree and stops soon afterwards, resulting in a smaller fraction of infected nodes (the hubs and a few more, i.e, a tiny fraction of the network) and thus to an effective threshold that is larger than that for the AS.
In order to illustrate the importance of the local properties of the network on the performance of the immunization, we analyze the results when targeted immunization is implemented on each representation of the Internet. In targeted immunization, a fraction of highly connected nodes are immunized (i.e., do not get infected) in decreasing order of their degrees. In the event that there are left immune nodes to be distributed within a connectivity class containing nodes, the immune nodes are randomly distributed within the nodes and the results are averaged over at least 100 additional realizations of this procedure. The results depicted in the figure suggest that the degree-degree correlations is one of the main factors influencing the performance of the immunization policy. We see that even for small percentages of immune nodes, immunization performs better in the AS graph. This may be due to the compact distribution of hubs (which play a key role in targeted immunization) in the router map whereas for the AS representation they are distributed throughout the whole network. Therefore, in the AS representation, targeted immunization works better because immune nodes are more efficient in cutting the paths leading to poorly connected nodes, the more abundant. These differences will become more apparent later on when local immunization strategies come into play.
3 Immunization Strategies
Let us now summarize the local immunization strategy introduced in this work. The allocation of network resources to satisfy a given service with the least use of resources, is a frequent problem in communication networks. In our case, we would like to have a robust system in front of a disease or virus spreading process but saving resources, that is, using the minimum number of immune nodes. This is a highly topical problem in communication networks as it might lead to the developing and deploying of a digital immune system to prevent technological networks from virus spreading. Recently pablo1 , we have studied a general covering problem in which every vertex is either covered or has at least one covered node at a distance at most . In what follows, we show that the set of covered vertices can be taken as the set of nodes to be immunized.
The heuristic algorithm proceeds as follows pablo1 : For every vertex in the network, look for the vertex with the highest degree within a distance of and immunize it. In case there is more than one vertex with the highest degree, one of them is selected at random and immunized. Moreover, if there is already an immune vertex within the neighborhood of , that immunization is kept. We have shown before pablo1 that this local algorithm gives near-optimal solutions for a general distance- covering problem, though the result of the covering depends on topological features such as the degree-degree correlations.
The immunization strategy here considered assumes that covered vertices are immune nodes to the spreading of a disease or virus. For instance, in a technological network, they could be thought of as being special devices devoted to filtering out any virus or attack. This would imply that the spreading process stops when it arrives to such nodes. This is of course the ideal situation. However, it happens more often that immune nodes can not catch the epidemic, but they are not able to stop spreading it through other nodes as when you have an up-to-date anti-virus. Therefore, we study the worse scenario and consider that immunized nodes just repel the virus cutting the path to infection spreading.
The approach presented here is in the spirit of the immunization strategy proposed by Cohen et al.cha04 . Since the immunization algorithm is local, one only needs information about the neighbors of a given node up to a distance . This information is usually available for small values of and easy to gather, in sharp contrast to targeted immunization that requires complete knowledge of the degree distribution pv01c ; db01a . The difference between our approach and that in cha04 is that we look for the highly connected nodes in small parts of the network, while the strategy developed in cha04 is based on the fact that randomly selected acquaintances likely have larger connectivities than randomly chosen nodes. Thus, in general, we expect our strategy to perform better than that proposed in cha04 , while keeping the local character of the algorithm note1 . On the other hand, either the number of immune nodes or the distance , which is a measure of the degree of local knowledge of the network topology, should be fixed. This makes the algorithm more parameter-constrained, but allows a more efficient distribution of resources.
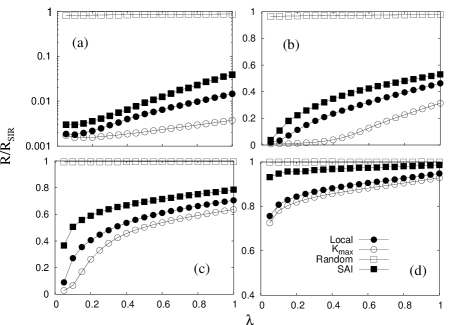
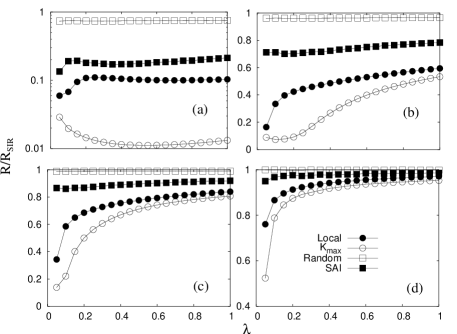
We have performed extensive numerical simulations of four different immunization schemes. The immunization obtained following the covering algorithm fixes the fraction, , of immune nodes in the whole network for each value of . Random immunization means that a fraction of immune nodes is randomly placed on the networks. Targeted immunization looks for the highly connected nodes and immunizes them. Finally, the Single Acquaintance Immunization (SAI) algorithm proposed in cha04 is run taking and ensuring that the total number of immune nodes is the same in both schemes. In all cases, the results are averaged over many realizations for each value of and . The results are displayed in Fig. 3 and Fig. 4.
As expected, targeted immunization produces the best results for both topologies. Note that, as discussed in the previous section, the performance of the algorithm depends on the specific topology and produces different results for AS and router maps. On the other extreme we find random immunization, whose performance is not affected by the structure of the underlying networks. Turning our attention to local algorithms, it is found that the immunization scheme based on the covering algorithm performs better than the SAI, even for small values of , where it is truly local. In fact, it is outperformed only by the targeted procedure and for all values of the parameters and it lies between the most efficient and the SAI scheme. Additionally, from a practical point of view, the covering strategy could be a good policy since it balances the degree of local knowledge and the efficiency of the vaccination. Moreover, as all network topologies are not neither completely known nor completely unknown, the covering allows to fine-tune the value of on a case-by-case base (that is, according to the degree of local knowledge of the network) and thus it is more flexible than other immunization strategies (recall that it is the result of an optimization).
We have further explored the differences between the global and covering-based immunization schemes. In principle, one may think that as we are immunizing highly connected nodes, both strategies produce the same set of immune nodes. Obviously, this is not the case since the covering operates at shorter distances than targeted immunization (which operates at , the diameter of network). In fact, a direct comparison of who the immune nodes are in both algorithms shows that no more than of them are the same and both sets equal only when reaches the diameter of the network. Moreover, as a further evidence of the influence of the graph representation in the performance of immunization schemes, it is found that for the router level the percentage above can increase up to .
Let us now restrict our discussion to the local (covering) immunization scheme and focus on the influence of degree-degree correlations on the final size of the outbreak. Figures 5 and 6 reflect the differences in the algorithm’s performance for the AS and the Router maps of Internet. Figure 5 illustrates the relative difference of the epidemic incidence as a function of , taking as a reference the size of the outbreak at . The behavior depicted in the figure is quite similar to the dependency of the number of nodes covered by each immune node, , when is increased pablo1 . For the AS network, the fraction of infected nodes at the end of the epidemic spreading process rapidly increases. In contrast, the increase in the epidemic incidence for the router network takes place at larger values of . This indicates that for the same , the immunization strategy works better at the router level as confirmed in Fig. 6, top panel. The reason of this behavior becomes apparent by noticing that for the router level is bigger than for the AS, but the number of nodes “covered” on average by each immune node is smaller. The combination of the two factors leads to a more efficient immunization at the router level, however, at the cost of more resources. Both strategies tend to be closer as is increased because at the router level the correlations change beyond .

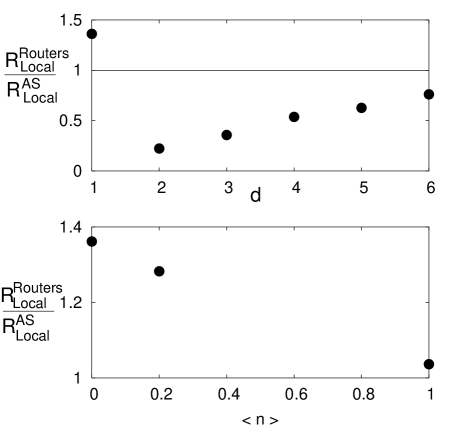
The previous result has to be carefully interpreted and should not be misunderstood. A closer look at the influence of the correlations reveals that, although in general they determine and for each map, these two quantities alone do not suffice to explain all the differences observed. Indeed, the local structure of the network turns out to be at the root of the immunization efficiency and the optimal trade-off between the size of the outbreak and the least use of resources. To see this, we have analyzed the situation in which both (though the ’s are different) and are almost the same in the two representations. This case is represented in the bottom panel of Fig. 6. As can be seen from the figure, in the latter case, the immunization scheme for the AS outperforms that for the router level. This behavior is due to the fact that in the AS network, the immune nodes are more distributed throughout the network because highly connected vertices alternate with poorly connected ones. On the contrary, at the router level, the hubs are topologically closer to each other (the correlations are positive) and thus some of the immune nodes are not highly connected resulting in a less efficient protection in front of an epidemic.
4 Discussion and Conclusions
In this paper, we have analyzed the spreading of an epidemic disease on top of real communication networks both with and without immunization. First, we have shown that targeted immunization produces different results depending on the local properties of the underlying graph by using different representations of the same technological network, the Internet. Later, we turned our attention to several immunization strategies and proposed a scheme that is neither completely local nor global, but can be tuned between the two extremes. The strategy introduced has been shown to perform better than all previous methods irrespective of the degree of local knowledge, except for the case of targeted immunization.
An important part of the work has dealt with the influence of degree-degree correlations on the performance of all vaccination algorithms. To this respect, it has been shown that local properties are extremely important for the outcome of a given strategy. Moreover, the work presented here has been performed on top of real networks, an thus the results are of high practical interest. An added value of the method developed here is that the covering-based strategy does not only deal with the degree of the immune nodes, as targeted immunization does, but naturally introduces the practical constraint of having limited resources to be distributed in the system on top of which the epidemics is spreading. Therefore, our method and the results found can shed light and provide useful hints in the search of optimal immunization strategies as the development and deploying of a digital immune system, a highly topical issue nowadays.
Finally, it is worth mentioning that although we have not analyzed the case here, it would also be possible to develop an even more flexible strategy in which the immunization through the covering algorithm is done with a variable for the same network, that is, one can implement an algorithm that optimize locally for different neighborhoods (i.e., different values of for each neighborhood) of a given (large) network.
In summary, our work points to a new direction in designing immunization strategies, namely, the finding of a better trade-off between resources and algorithm’s performance.
5 Acknowledgments
We thank A. Vázquez for discussions and for providing the data used in this work. P. E. and J. G-G acknowledge financial support of the MEC through FPU grants. Y. M. is supported by MEC through the Ramón y Cajal Program. This work has been partially supported by the Spanish DGICYT Projects FIS2004-05073-C04-01, BFM2002-00113 and BFM2003-08532; and a DGA (Aragón, Spain) project.
References
- (1) P. F. M. Faloutsos and C. Faloutsos, Comput. Commun. Rev. 29, 251 (1999).
- (2) R. Pastor-Satorras, A. Vázquez, and A. Vespignani, Phys. Rev. Lett. 87, 258701 (2001).
- (3) A. Vázquez, R. Pastor-Satorras, and A. Vespignani, Phys. Rev. E65, 66130 (2002).
- (4) R. Pastor-Satorras, A. Vespignani, Evolution and Structure of the Internet: A Statistical Physics Approach, (Cambridge University Press, 2004).
- (5) A.-L. Barabási and R. Albert, Science 286, 509 (1999).
- (6) A.-L. Barabási, R. Albert and H. Jeong, Physica A272, 173 (1999).
- (7) S. N. Dorogovtsev and J. F. F. Mendes, Evolution of Networks. From Biological Nets to the Internet and the WWW, Oxford University Press, Oxford, U.K., (2003).
- (8) M.E.J. Newman, SIAM Review 45, 167 (2003).
- (9) Handbook of Graphs and Networks, Edited by S. Bornholdt and H. G. Schuster, Wiley-VCH, Germany, 2003.
- (10) R. Cohen, K. Erez, D. ben Avraham, and S. Havlin, Phys. Rev. Lett. 85, 4626 (2000).
- (11) R. Pastor-Satorras and A. Vespignani. Phys. Rev. Lett. 86, 3200 (2001).
- (12) R. Pastor-Satorras and A. Vespignani. Phys. Rev. E63, 066117 (2001).
- (13) Y. Moreno, R. Pastor-Satorras, and A. Vespignani, Eur. Phys. J. B26 521 (2002).
- (14) A. L. Lloyd and R. M. May, Science 292, 1316 (2001).
- (15) M. Boguñá, R. Pastor-Satorras, and A. Vespignani, Phys. Rev. Lett. 90 28701 (2003).
- (16) Y. Moreno, J. B. Gómez, and A. F. Pacheco. Phys. Rev. E68 035103R (2003).
- (17) A. Vázquez, and Y.Moreno, Phys. Rev. E 67, 015101R (2003).
- (18) R. M. Anderson and R. M. May, Infectious diseases in humans (Oxford University Press, Oxford, 1992).
- (19) R. Pastor-Satorras and A. Vespignani, Phys. Rev. E65, 036104 (2002).
- (20) Z. Dezso and A.-L. Barabási, Phys. Rev. E65, 055103R (2002).
- (21) P. Echenique, J. Gómez-Gardeñes, Y. Moreno, and A. Vázquez, Phys. Rev. E. 71, 035102R (2005).
- (22) R. Cohen, S. Havlin, and D. ben-Avraham, Phys. Rev. Lett. 91, 247901 (2003).
- (23) The National Laboratory for Applied Network Research (NLANR), National Science Foundation, http://moat.nlanr.net/.
- (24) Mapping the Internet within the SCAN project, Information Sciences Institute, http://www.isi.edu/div7/scan/.
- (25) D.J. Watts and S.H. Strogatz, Nature 393, 440 (1998).
- (26) A. Vázquez, Phys. Rev. E67 056104, (2003).
- (27) R. Pastor-Satorras, A. Vázquez, and A. Vespignani, in Complex Networks, edited by E. Ben-Naim, H. Frauenfelder, and Z. Toroczkai, Lecture Notes in Physics, Vol. 650 sSpringer, Berlin, (2004), p. 425.
- (28) Strictly speaking, our algorithm is neither completely local nor global. In fact, by tuning the distance of the immunization (covering) strategy one can move from a truly local algorithm to an algorithm close to the targeted immunization approach for , being the diameter of the network. In this sense, our method is half-a-way between strictly local and global strategies. This difference diffuses when one consider ultra-small world networks, which is not our case.