An index to quantify an individual’s scientific research output
Abstract
I propose the index , defined as the number of papers with citation number higher or equal to , as a useful index to characterize the scientific output of a researcher.
For the few scientists that earn a Nobel prize, the impact and relevance of their research work is unquestionable. Among the rest of us, how does one quantify the cumulative impact and relevance of an individual’s scientific research output? In a world of not unlimited resources such quantification (even if potentially distasteful) is often needed for evaluation and comparison purposes, eg for university faculty recruitment and advancement, award of grants, etc.
The publication record of an individual and the citation record are clearly data that contain useful information. That information includes the number () of papers published over years, the number of citations () for each paper (), the journals where the papers were published and their impact parameter, etc. This is a large amount of information that will be evaluated with different criteria by different people. Here I would like to propose a single number, the ”-index”, as a particularly simple and useful way to characterize the scientific output of a researcher.
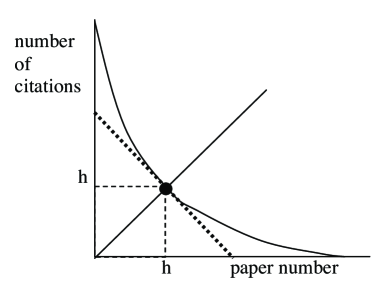
A scientist has index h if h of his/her papers have at least h citations each, and the other papers have no more than h citations each.
The research reported here concentrated on physicists, however I suggest that the index should be useful for other scientific disciplines as well. (At the end of the paper I discuss some observations for the index in biological sciences.) The highest among physicists appears to be E. Witten’s, . That is, Witten has written papers with at least citations each. That gives a lower bound on the total number of citations to Witten’s papers at . Of course the total number of citations () will usually be much larger than , since both underestimates the total number of citations of the most cited papers and ignores the papers with fewer than citations. The relation between and will depend on the detailed form of the particular distributionpaper1 ; paper2 , and it is useful to define the proportionality constant as
| (1) |
I find empirically that ranges between and .
Other prominent physicists with high ’s are A.J. Heeger (), M.L. Cohen (), A.C. Gossard (), P.W. Anderson (), S. Weinberg (), M.E. Fisher (), M. Cardona (), P.G. deGennes (), J.N. Bahcall (), Z. Fisk (), D.J. Scalapino (), G. Parisi (), S.G. Louie (), R. Jackiw (), F. Wilczek (), C. Vafa (), M.B. Maple (), D.J. Gross (), M.S. Dresselhaus (), S.W. Hawking ().
I argue that is preferable to other single-number criteria commonly used to evaluate scientific output of a researcher, as follows:
(0) Total number of papers (): Advantage: measures productivity. Disadvantage: does not measure importance nor impact of papers.
(1) Total number of citations (): Advantage: measures total impact. Disadvantage: hard to find; may be inflated by a small number of ’big hits’, which may not be representative of the individual if he/she is coauthor with many others on those papers. In such cases the relation Eq. (1) will imply a very atypical value of , larger than . Another disadvantage is that gives undue weight to highly cited review articles versus original research contributions.
(2) Citations per paper, i.e. ratio of to : Advantage: allows comparison of scientists of different ages. Disadvantage: hard to find; rewards low productivity, penalizes high productivity.
(3) Number of ’significant papers’, defined as the number of papers with more than citations, for example . Advantage: eliminates the disadvantages of criteria (0), (1), (2), gives an idea of broad and sustained impact. Disadvantage: is arbitrary and will randomly favor or disfavor individuals; needs to be adjusted for different levels of seniority.
(4) Number of citations to each of the most cited papers, for example . Advantage: overcomes many of the disadvantages of the criteria above. Disadvantage: it is not a single number, making it more difficult to obtain and compare. Also, is arbitrary and will randomly favor and disfavor individuals.
Instead, the proposed -index measures the broad impact of an individual’s work; it avoids all the disadvantages of the criteria listed above; it usually can be found very easily, by ordering papers by ’times cited’ in the Thomson ISI Web of Science databaseclarify ; it gives a ballpark estimate of the total number of citations, Eq. (1).
Thus I argue that two individuals with similar are comparable in terms of their overall scientific impact, even if their total number of papers or their total number of citations is very different. Conversely, that between two individuals (of the same scientific age) with similar number of total papers or of total citation count and very different -values, the one with the higher is likely to be the more accomplished scientist.
For a given individual one expects that should increase approximately linearly with time. In the simplest possible model, assume the researcher publishes papers per year and each published paper earns new citations per year every subsequent year. The total number of citations after years is then
| (2) |
Assuming all papers up to year contribute to the index we have
| (3a) | |||
| (3b) |
The left side of Eq. (3a) is the number of citations to the most recent of the papers contributing to ; the left side of Eq. (3b) is the total number of papers contributing to . Hence from Eq. (3),
| (4) |
The total number of citations (for not too small ) is then approximately
| (5) |
of the form Eq. (1). The coefficient depends on the number of papers and the number of citations per paper earned per year as given by eq. (5). As stated earlier we find empirically that to are typical values. The linear relation
| (6) |
should hold quite generally for scientists that produce papers of similar quality at a steady rate over the course of their careers, of course will vary widely among different researchers. In the simple linear model, is related to and as given by eq. (4). Quite generally, the slope of versus , the parameter , should provide a useful yardstick to compare scientists of different seniority.
In the linear model, the minimum value of in Eq. (1) is , for the case , where the papers with more than citations and those with less than citations contribute equally to the total . The value of will be larger for both and . For , most contributions to the total number of citations arise from the ’highly cited papers’ (the papers that have ), while for it is the sparsely cited papers (the papers that have fewer than citations each) that give the largest contribution to . We find that the first situation holds in the vast majority, if not all, cases. For the linear model defined in this example, corresponds to (the other value that yields , , is unrealistic).
The linear model defined above corresponds to the distribution
| (7) |
where is the number of citations to the -th paper (ordered from most to least cited), and is the number of citations of the most highly cited paper ( in the example above). The total number of papers is given by , hence
| (8) |
We can write and in terms of defined in Eq. (1) as :
| (9a) | |||
| (9b) |
For , . For larger , the upper sign in Eq. (9) corresponds to the case where the highly cited papers dominate (more realistic case) and the lower sign where the low-cited papers dominate the total citation count.
In a more realistic model, will not be a linear function of . Note that can safely be assumed to be a lower bound quite generally, since a smaller value of would require the second derivative to be negative over large regions of which is not realistic. The total number of citations is given by the area under the curve, that passes through the point . In the linear model the lowest corresponds to the line of slope , as shown in Figure 1.
A more realistic model would be a stretched exponential of the form
| (10) |
Note that for , for all , hence is true. We can write the distribution in terms of and as
| (11) |
with the integral
| (12) |
and determined by the equation
| (13) |
The maximally cited paper has citations
| (14) |
and the total number of papers (with at least one citation) is determined by as
| (15) |
A given researcher’s distribution can be modeled by choosing the most appropriate and for that case. For example, for , if , and , . With , , and . For , the lowest possible value of is ; for that case, , . Larger values will increase and reduce . For , the smallest possible is , for which case and .
The linear relation between and Eq. (6) will of course break down when the researcher slows down in paper production or stops publishing altogether. There is a time lag between the two events. In the linear model assuming the researcher stops publishing after years, continues to increase at the same rate for a time
| (16) |
and then stays constant, since now all published papers contribute to . In a more realistic model will smoothly level off as increases rather than with a discontinuous change in slope. Still quite generally the time lag will be larger for scientists who have published for many years as Eq. (16) indicates.
Furthermore in reality of course not all papers will eventually contribute to . Some papers with low citations will never contribute to a researcher’s , especially if written late in the career when is already appreciable. As discussed by Rednerpaper3 , most papers earn their citations over a limited period of popularity and then they are no longer cited. Hence it will be the case that papers that contributed to a researcher’s early in his/her career will no longer contribute to later in the individual’s career. Nevertheless it is of course always true that cannot decrease with time. The paper or papers that at any given time have exactly citations are at risk of being eliminated from the individual’s -count as they are superseded by other papers that are being cited at a higher rate. It is also possible that papers ’drop out’ and then later come back into the -count, as would occur for the kind of papers termed ’sleeping beauties’paper4 .
For the individual researchers mentioned earlier I find n from the time elapsed since their first published paper till the present, and find the following values for the slope defined in Eq. (6): Witten, ; Heeger, ; Cohen, ; Gossard, ; Anderson, ; Weinberg, ; Fisher, ; Cardona, ; deGennes, ; Bahcall, ; Fisk, ; Scalapino, ; Parisi, ; Louie, ; Jackiw, ; Wilczek, ; Vafa, ; Maple, ; Gross, ; Dresselhaus, ; Hawking, . From inspection of the citation records of many physicists I conclude:
(1) A value , i.e. an index of after years of scientific activity, characterizes a successful scientist.
(2) A value , i.e. an -index of after years of scientific activity, characterizes outstanding scientists, likely to be found only at the top universities or major research laboratories.
(3) A value or higher, i.e. an -index of after years, or after years, characterizes truly unique individuals.
The -parameter ceases to be useful if a scientist does not maintain his/her level of productivity, while the -parameter remains useful as a measure of cumulative achievement that may continue to increase over time even long after the scientist has stopped publishing altogether.
Based on typical and values found, I suggest that (with large error bars) for faculty at major research universities to might be a typical value for advancement to tenure (associate professor), and for advancement to full professor. Fellowship in the American Physical Society might occur typically for to . Membership in the US National Academy of Sciences may typically be associated with and higher except in exceptional circumstances. Note that these estimates correspond roughly to typical number of years of sustained research production assuming an value, the time scales of course will be shorter for scientists with higher values. Note that the time estimates are taken from the publication of the first paper which typically occurs some years before the Ph.D. is earned.
There are however a number of caveats that should be kept in mind. Obviously a single number can never give more than a rough approximation to an individual’s multifaceted profile, and many other factors should be considered in combination in evaluating an individual. This and the fact that there can always be exceptions to rules should be kept in mind especially in life-changing decisions such as the granting or denying of tenure. There will be differences in typical -values in different fields, determined in part by the average number of references in a paper in the field, the average number of papers produced by each scientist in the field, and also by the size (number of scientists) in the field (although to a first approximation in a larger field there are more scientists to share a larger number of citations, so typical -values should not necessarily be larger). Scientists working in non-mainstream areas will not achieve the same very high values as the top echelon of those working in highly topical areas. While I argue that a high is a reliable indicator of high accomplishment, the converse is not necessarily always true. There is considerable variation in the skewness of citation distributions even within a given subfield, and for an author with relatively low that has a few seminal papers with extraordinarily high citation counts, the -index will not fully reflect that scientist’s accomplishments. Conversely, a scientist with a high achieved mostly through papers with many coauthors would be treated overly kindly by his/her . Subfields with typically large collaborations (eg high energy experiment) will typically exhibit larger -values, and I suggest that in cases of large differences in the number of coauthors it may be useful in comparing different individuals to normalize by a factor that reflects the average number of coauthors. For determining the scientific ’age’ in the computation of , the very first paper may sometimes not be the appropriate starting point if it represents a relatively minor early contribution well before sustained productivity ensued.
Finally, in any measure of citations ideally one would like to eliminate the self-citations. While self-citations can obviously increase a scientist’s , their effect on is much smaller than on the total citation count. First, all self-citations to papers with less than citations are irrelevant, as are the self-citations to papers with many more than citations. To correct for self-citations one would consider the papers with number of citations just above , and count the number of self-citations in each. If a paper with citations has more than self-citations, it would be dropped from the -count, and would drop by . Usually this procedure would involve only very few if any papers. As the other face of this coin, scientists intent in increasing their -index by self-citations would naturally target those papers with citations just below .
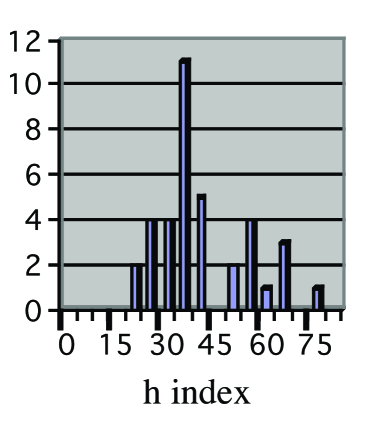
As an interesting sample population I computed and for the physicists that obtained Nobel prizes in the last 20 years (for calculating I used the latter of the first published paper year or 1955, the first year in the ISI database). However the set was further restricted by including only the names that uniquely identified the scientist in the ISI citation index. This restricted our set to of the total, it is however still an unbiased estimator since the commonality of the name should be uncorrelated with and . -indices range from to , -indices from to . Averages and standard deviations are , , and , . The distribution of -indices is shown in Figure 2, the median is at , lower than the mean due to the tail for high values. It is interesting that Nobel prize winners have substantial indices ( had of at least ), indicating that Nobel prizes do not originate in one stroke of luck but in a body of scientific work. Notably the values of found are often not high compared to other successful scientists ( of our sample had ). This is clearly because Nobel prizes are often awarded long after the period of maximum productivity of the researchers.
As another example, among newly elected members in the National Academy of Sciences in Physics and Astronomy in 2005 I find , , highest , lowest , median . Among the total membership in NAS in Physics the subgroup of last names starting with A and B has , , . These examples further indicate that the index is a stable and consistent estimator of scientific achievement.
An intriguing idea is the extension of the -index concept to groups of individualsspires0 . The SPIRES high energy physics literature databasespires recently implemented the -index in their citation summaries, and it also allows the computation of for groups of scientists. The overall -index of a group will generally be larger than that of each of the members of the group but smaller than the sum of the individual -indices, since some of the papers that contribute to each individual’s will no longer contribute to the group’s . For example, the overall -index of the condensed matter group at the UCSD physics department is , of which the largest individual contribution is ; the highest individual is , and the sum of individual ’s is above . The contribution of each individual to the group’s is not necessarily proportional to the individual’s , and the highest contributor to the group’s will not necessarily be the individual with highest . In fact, in principle (although rarely in practice) the lowest- individual in a group could be the largest contributor to the group’s . For a prospective graduate student considering different graduate programs, a ranking of groups or departments in his/her chosen area according to their overall -index would likely be of interest, and for administrators concerned with these issues the ranking of their departments or entire institution according to the overall could also be of interest.
To conclude, I discuss some observations in the fields of biological and biomedical sciences. From the list compiled by Christopher King of Thomson ISI of the most highly cited scientists in the period 1983-2002king , I found the indices for the top 10 on that list, all in the life sciences, which are, in order of decreasing : S.H. Snyder, ; D. Baltimore, ; R.C. Gallo, ; P. Chambon, ; B. Vogelstein, ; S. Moncada, ; C.A. Dinarello, ; T. Kishimoto, ; R. Evans, ; A. Ullrich, . It can be seen that not surprisingly all these highly cited researchers also have high indices, and that high indices in the life sciences are much higher than in physics. Among 36 new inductees in the National Academy of Sciences in biological and biomedical sciences in 2005 I find , , highest , lowest , median . These latter results confirm that indices in biological sciences tend to be higher than in physics, however they also indicate that the difference appears to be much higher at the high end than on average. Clearly more research in understanding similarities and differences of index distributions in different fields of science would be of interest.
In summary, I have proposed an easily computable index, , which gives an estimate of the importance, significance and broad impact of a scientist’s cumulative research contributions. I suggest that this index may provide a useful yardstick to compare different individuals competing for the same resource when an important evaluation criterion is scientific achievement, in an unbiased way.
Acknowledgements.
I am grateful to many colleagues in the UCSD Condensed Matter group and especially Ivan Schuller for stimulating discussions on these topics and encouragement to publish these ideas; to the many readers that wrote with interesting comments since this paper was first posted at the LANL ArXiv (http://arxiv.org/abs/physics/0508025), and to the referees who made constructive suggestions, all of which led to improvements in the paper; and to Travis Brooks and the SPIRES database administration for rapidly implementing the -index in their database.References
- (1) J. Laherrere and D. Sornette, Eur .Phys. J. B 2, 525 (1998).
- (2) S. Redner, Eur .Phys. J. B 4, 131 (1998).
- (3) http://isiknowledge.com. Of course the database used must be complete enough to cover the full period spanned by the individual’s publications.
- (4) S. Redner, Physics Today Vol. 58, No. 6, p. 49 (2005).
- (5) A.F.J. van Raan, Scientometrics 59, 467 (2004).
- (6) This was first introduced in the SPIRES database, Ref. 7.
- (7) http://www.slac.stanford.edu/spires/hep/
- (8) As reported in the newspaper ”The Guardian”, Thursday, September 25, 2003.