Performance of three-photon PET imaging: Monte Carlo simulations.
Abstract
We have recently introduced the idea of making use of three-photon positron annihilations in positron emission tomography. In this paper the basic characteristics of the three-gamma imaging in PET are studied by means of Monte Carlo simulations and analytical computations. Two typical configurations of human and small animal scanners are considered. Three-photon imaging requires high energy resolution detectors. Parameters currently attainable by CdZnTe semiconductor detectors, the technology of choice for the future development of radiation imaging, are assumed. Spatial resolution is calculated as a function of detector energy resolution and size, position in the field of view, scanner size, and the energies of the three gamma annihilation photons. Possible ways to improve the spatial resolution obtained for nominal parameters: 1.5 cm and 3.2 mm FWHM for human and small animal scanners, respectively, are indicated. Counting rates of true and random three-photon events for typical human and small animal scanning configurations are assessed. A simple formula for minimum size of lesions detectable in the three-gamma based images is derived. Depending on the contrast and total number of registered counts, lesions of a few mm size for human and sub mm for small animal scanners can be detected.
1 Introduction
Positron Emission Tomography (PET) is the method of choice in functional medical imaging, both in clinical practice and research involving small animals. It uses short-lived positron emitting radionuclides to mark biologically active substances which can be traced while being metabolised in the body by detecting co-linear annihilation photon pairs and reconstructing the image.
Medical imaging is not the only application of positrons. Apart from basic nuclear and elementary particle research, the physics of positron annihilation investigates the interactions of positrons with matter (Charlton and Humberston 2001). They are a sensitive probe allowing to acquire information about subtle structural and chemical properties of materials by precise measurements of annihilation radiation. Three main experimental methods are employed: positron lifetime spectroscopy, angular correlation of annihilation radiation and Doppler broadening of annihilation radiation. Combinations of the above are also in use. None of these concepts is currently used in PET, apart from accounting for the non-colinearity of the annihilation photons and finite positron range contributing to deterioration of spatial resolution. Annihilation pairs are used merely to determine the activity distribution changing in time.
We introduced recently the idea of three-photon PET imaging (Kacperski et al2004, Kacperski and Spyrou 2004a). It was shown that the relatively rare (about 0.5 % in water) 3-photon positron annihilations (Ore and Powell 1949, De Benedetti and Siegel 1954) can also be used for imaging. By detecting the positions and energies of the three photons, one can easily locate the point where the annihilation occurred. Thus the amount of information obtained from a single event is higher than for a 2 pair, where localisation is along a line. The rate of 3 decay is not only proportional to concentration of activity but is also sensitive to the local physical and chemical environments, notably the presence of oxygen (Cooper et al1967, Klobuchar and Karol 1980, Hopkins and Zerda 1990, Kakimoto et al1990). This is due to formation of positronium: a positron - electron bound state, which behaves as an active chemical particle. 75 % of the positronium is formed as an ortho-positronium, triplet state which in vacuum annihilates only into 3 with a relatively long lifetime of 142 ns. In matter interaction processes, in general called quenching, that lead to 2 annihilations are usually much faster, reducing the fraction of three-photon annihilations.
Measuring and imaging oxygenation of tissues is important in various clinical contexts (Machulla 1999), e.g. in oncology (tumour hypoxia, radiosensitivity), cardio- and cerebrovascular disease and infections by anaerobic microorganisms. Intensive research is ongoing to develop radiotracers for imaging hypoxia. When the 3 annihilations, which are simply ignored in the current PET scanners, are recorded, the positron itself, or more precisely the positronium, could serve as an oxygen-sensitive tracer. Oxygen is known to be a strong positronium quencher, therefore hypoxic regions should be characterised by higher 3 rates than those well oxygenated. The oxygenation image would be obtained alongside e.g. a routine FDG PET, saving cost, patient radiation dose and inconvenience incurred by extra specific scan.
In this paper we explore further the idea of 3 imaging by assessing the dependence of spatial resolution on various system parameters like the size of the detectors, their energy resolution, size of the scanner, position within the field of view as well as the particular combination of three photon energies. We focus on two scanner configurations commonly used in practice: a small animal and a full body human scanner. The expected 3 counting rates are estimated and examples of images obtained from 3 annihilations are produced. A formula for the minimum size of detectable lesions with respect to contrast and number of counts recorded is derived.
2 Theory
Let us recall the basic principles of 3 PET imaging (Kacperski et al2004). Consider a -decay event that occurs at a point (see figure 1).
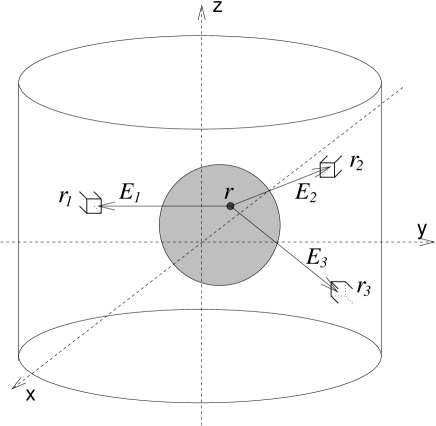
If the three annihilation photons have energies , , and are detected in coincidence by detectors at points , respectively, then, from the law of momentum conservation, we get
In addition, the law of energy conservation has also to be satisfied:
| (2) |
The energies have a continuous spectrum from 0 to 511 keV with the probability distribution approximately uniform in the space (Ore and Powell 1949, Chang and Tang 1985). With known detector positions , , and , the measurement of photon energies , , and , enables the solution of the nonlinear set of equations (LABEL:momcons) to determine the point at which annihilation took place. Since the energy resolution and size of the detectors are finite, the location of annihilation is broadened into a region surrounding the point . Note, however, that in contrast to the decay, we obtain (neglecting the finite measurement accuracy) full information on the position of annihilation from a single event, rather than just a line of response. Unlike the rather intricate image reconstruction methods required for events, one only needs to solve the nonlinear equations (LABEL:momcons) to retrieve from a event. The image is thus formed as a set of dots, each corresponding to a single 3 positron decay. It can be processed further by performing appropriate attenuation correction and e.g. window averaging to obtain the usual grayscale or colour-coded pixels display. Let us stress that the recording of three-photon events is done simultaneously with the prevailing 511 keV photon pairs. 3 imaging is by no means an alternative to conventional PET, but rather an add-on, making use of the annihilation radiation which is currently wasted, it provides extra information. Dividing the 3 image by the 2 one we obtain a map of decay probability ratio. This is actually a new imaging modality.
3 CdZnTe detectors for PET
It is clear from the equation (LABEL:momcons) that uncertainty in the energies , , and will result in a spread of the reconstructed annihilation site . As it is indicated in (Kacperski et al2004) and section 4.1.1 of this paper, the energy resolution is actually the crucial factor determining the spatial resolution of imaging. With currently dominating PET scanners which are based on scintillator detectors (energy resolution typically worse than 15%) it is not possible to obtain an accteptable image. However, new detector materials are gradually making their way into PET imaging technology, notably the room temperature operating semiconductors CdZnTe (Moses et al1994, Scheiber and Gaikos 2001, Verger et al2004). The main reason for considering the new material is the improvement in intrinsic spatial resolution due to precise depth-of-interaction information, which results in better image resolution and is of primary importance, specially in small animal imaging (Stickel and Cherry 2005). Compact scanner design and much better energy resolution allowing efficient rejection of scattered events are further advantages. The latter factor also allows implementation of the 3-photon modality. CdZnTe cameras are already becoming increasingly popular in SPECT. The price of the material, processing electronics and implementation of a new technology are still inhibiting factors, nevertheless, projects to built prototype small animal CdZnTe PET scanners are already under way. Many of the material related problems, like slow charge collection, can be greatly reduced by the use of stacked thin position sensitive detector arrays (Nemirovsky et al2001, Moss et al2001, Redus et al2004) with appropriate pulse processing electronics. Currently energy resolutions of 1% at 662 keV can be achieved. Best timing resolutions range between 5 and 8 ns, and recently even 2.8 ns has been reported (Drezet et al2004).
4 Monte Carlo simulations: small animal and human scanner models
Performance of PET imaging based on 3-photon annihilations has been investigated for two kinds of model scanners: small animal and whole body human. We assumed the usual cylindrical scanner geometry with square faced detector elements (no dead layers). The parameters of the scanners are given in Table 1.
-
Parameter Small Animal Human Diameter 12 cm 80 cm FOV 15 cm 24 cm Diameter/FOV ratio 0.8 3.33 Detector size 2 mm 4 mm Number of detectors in ring 188 628 Number of rings 75 60 Detector energy resolution at 662 keV 1% Minimum detected energy () 150 keV Maximum detected energy () 480 keV
In order to investigate their influence on the spatial resolution chosen parameters have been modified during the simulations, with all others remaining fixed as in table 1.
4.1 Spatial resolution
For each particular set of parameters at least detected three-photon events emitted from a point source placed in the centre of the scanner were simulated. This was assumed to obtain the point spreads with high statistical accuracy, and does not reflect the actually achievable counting rates of photons; this issue is addressed separately in section 4.2. Finite size and energy resolution of detectors were the only sources of blurring in the reconstructed image. We neglected the range of positrons in matter and residual momentum of the electron-positron pair. These factors are briefly discussed in section 5. Any photon hitting the surface of a detector element in the scanner was assumed to be detected at the centre of that element. The maximum photon position error is therefore times the detector size. We assumed that the energy resolution of the detectors depends on photon energy according to , where the constant was chosen so that the relative energy resolution at 662 keV is (except section 4.1.1). After the reconstruction procedure, as described in section 2, standard deviation and FWHM of the reconstructed point were calculated.
4.1.1 Energy resolution of detectors
Let us begin with the dependence of a point source blur on the energy resolution of the detectors which is shown in figure 2.

Clearly, good energy resolution of detectors is crucial for 3-photon imaging. With the scintillators currently used for which the energy resolution is usually worse than at 662 keV one cannot obtain an acceptable image from the events. However, with CdZnTe detectors of energy resolution , or better, at 662 keV, the spatial resolutions that can be obtained become acceptable, although worse than typical values for conventional PET. At very high energy resolutions the influence of detector size can be noticed (saturation at a non-zero value for ), whereas above 1%, energy resolution is the dominating source of blurring.
4.1.2 Position in the FOV
In the following simulations the variation of the spatial resolution within the field of view has been investigated as the point source was moved along the radial and axial directions. The results for the radial direction are shown in figure 3.


The point spread is a combination of errors in photon energy and position detection. In order to see the influence of both factors we ran separate series of simulations assuming perfect energy detection (error in photon position only), point-like detectors (error in energy only), and the realistic case when both errors are present. As one can see in figure 3, the energy error contribution increases, while the photon position error decreases with the transaxial distance from the central axis. In effect, the resolution is quite uniform across the FOV, deteriorating sharply only close to the scanner walls. For the human scanner the optimal resolution is actually achieved at about 25 cm off-centre.
The variability along the axis (figure 4) is even smaller, remaining below and for human and small animal scanner, respectively. The results of other simulations obtained for the point at the centres of scanners are therefore representative for the entire useful FOV.

It should also be noted that the shape of the point spread function is spatially nonuniform. For the point at the centre the spread in the transaxial direction equals 1.06 cm and 0.2 cm FWHM, respectively, for human and small animal scanner, whilst in the direction it is 0.26 cm and 0.136 cm, respectively. As we move off from the central axis the PSF becomes elongated in the radial direction.
4.1.3 Size of detectors
Keeping the geometric proportions of the scanners fixed as in table 1 the size of (square) detectors was changed, and their number adjusted accordingly to keep the sizes of scanners constant. Figure 5 shows the results of the simulations with detector energy resolution at 662 keV (solid lines) and perfect energy detection (dashed lines).

The overall dependence, similar to figure 2, is close to linear. Comparison of both curves for each scanner reveals the contributions of the two sources of error and indicates the direction of potential improvements. For our model human scanner with detector size 4 mm the reconstructed point spread results mainly from the energy detection error (cf. also figure LABEL:drodxx), therefore decreasing the size of detectors, without improving their energy resolution, would hardly improve the spatial resolution. For the small animal scanner with 2 mm detector elements the contribution from photon position detection error is higher, so reducing effective detector size would bring some performance improvement, although energy resolution is still more critical. The influence of detector size becomes more important for points far from the centres of scanners (see figure LABEL:drodxx).
4.1.4 Size of scanner
The influence of the scanner size on the spatial resolution was studied by changing the diameter of the scanners and their axial length (number of rings) to preserve the geometric proportions as in table 1. The size of detectors was kept constant and their number adjusted to cover the whole cylinder. Again, three separate simulations were run for each scanner: assuming perfect detection of photon energy, or position, and modelling errors in both. The results can be seen in figure 6.


One can clearly see that the near-linear dependence is due to the energy resolution error which depends linearly on scanner size. The detector size component remains constant. For both human and small animal scanners reducing scanner size as much as possible is desirable from the point of view of imaging. This dependence is the main reason why the spatial resolution of the small animal scanner is significantly better than that of human the scanner.
4.1.5 Energies of photons and cut-off energies
As it was mentioned in section 2, the three photons can have any combination of energies satisfying (2) and (LABEL:momcons). The error of the annihilation site recovered from (LABEL:momcons) is a rather complex function of , and . We have calculated the FWHM spreads of a point source at the centre of the human scanner emitting photons with a particular energy combination satisfying (2) and (LABEL:momcons) (figure 7). The spreads were averaged over the remaining free parameters (directions of emission).

The resolution is optimal for the symmetric three-photon decay with all energies equal 340.7 keV and deteriorates as we move towards extreme values. In practice we never detect energies from the entire spectrum 0-511 keV. At the upper end the 511 keV photopeak resulting from the dominating decays has to be cut-off. On the other hand, there is a detector and noise related low energy detection limit. Figure 7 indicates yet another reason to avoid registering decays with extreme energies: they introduce large errors in position reconstruction. In figure 8 the point spread of a point source as a function of upper and lower energy thresholds was plotted.

The smaller window around the optimal 340.7 keV we set, the better spatial resolution we achieve. There is, however, the common sensitivity-resolution trade-off: as the window narrows, the number of counts detected drops, so a compromise choice has to be made.
Figure 7 also suggests a relatively easy way of improving spatial resolution without losing counts. In all our simulations we treat all the reconstructed annihilation points equally. We could, however, using the relation shown in figure 7, assign a weight to each point according to the particular energy combination, so that counts with energies close to optimal ( keV) would contribute more than those with energies close to extreme. Such approach would probably improve spatial resolution by about 30 - 40 %.
4.2 Counting rates and random scattered events
Poissonian noise is one of the key limiting factors in nuclear medicine imaging. With the probability of three-photon annihilations being two to three orders of magnitude lower than that of two-photon, the question of sufficient number of counts obviously needs to be addressed. Will it be enough to obtain meaningful images?
We will assess the rates of counts for our two model scanners with phantoms in the form of spheres filled with water and uniform positron activity distribution. The diameters of the spheres are 20 cm and 4 cm for the human and small animal scanners, respectively; they are placed at the centres of the scanners. The counting rate of true decays is in general determined by probabilities of emission, detection and attenuation. It can be expressed by the formula
| (3) |
where is the total activity in the phantom. The meaning of the factors and their values for the two model systems is summarized in table 2. The expression in brackets approximates the probability that a true three-photon decay will not be obscured by (one or more) coincident events. The three terms correspond to zero, one and two pairs respectively. Higher order coincidences are negligible at the activities relevant for PET. The factors and are the probabilities of unique identification of the true event despite the coincident photons. This is possible because the coincident photons may just miss the scanner, or, if they are detected, their energies are quite different from those of annihilation.
-
Symbol Parameter Small Animal Human attenuation factor 0.65 0.11 geometry factor 0.51 0.052 probability that one pair 0.94 0.98 will not interfere with detection probability that two pairs 0.5 0.8 will not interfere with detection emission probability ratio 0.004 fraction of photons in the 0.655 (, ) window detection efficiency = 0.614
Numerical values of the parameters were obtained from simulations and analytical calculations. We assumed the scanners to be made of 3 cm thick CdZnTe detectors, which yields average full energy photopeak efficiency for the photons of about . The ratio was derived from positron lifetime experimental data for water and organic liquids. In fact, it depends sensitively on the chemical composition of the solution. Usually dissolved ions as well as gases (in particular oxygen) lead to a decrease of rate. On the other hand, the ratio increases in liquids of smaller surface tension. The ratio for pure, degassed water is about 0.5%; in alcohols it reaches about 0.7%. The minimum value occurring in substances (e.g. metals) where no positronium is formed is 0.27%. Our choice of seems therefore reasonable and not too optimistic.
The counting rates for both scanners are plotted in figures 9 and 10. They can amount up to about 1000 cps for human scanner and 80,000 cps for small animal scanner. The difference is mainly due to the larger solid angle covered and much smaller attenuation for the small object.
In conventional PET, apart from the true coincidence counts forming the image, there are scattered and randomly coincident photons contributing to image noise. In the case of imaging those two kinds of events have to be considered simultaneously. Because of the resolution requirement we need to use high energy resolution detectors (see section 4.1.1). The unique properties of decay, in particular the energy condition (2) enables then to efficiently distinguish the true events from accidental coincidences. Nevertheless, it can happen that all the conditions are fulfilled by chance leading to spurious counts. Let us estimate the rates of such counts for our model scanners. Because of the small decay rate the probability of two or more events occurring and being detected within the resolving time is very small. The main source of spurious counts are the randomly coincident annihilation photons that are scattered or partially detected, so that they fall within the energy range of the spectrum. Let us denote by the probability of a 511 keV photon emitted from the phantom to deposit the energy in a detector. It is actually a convolution of the spectrum of photons leaving the phantom (primary and scattered) and the detector response function. The probability of three coincident photons randomly fulfilling condition (2) within the resolution determined window can be approximately written as
| (4) |
where the integration is over the region between the planes keV in the space, further limited by and , the upper and lower limits of detected spectrum. Note that does not include any geometry dependence. In our estimation in the interval (, ) can be approximated by a linear function with parameters obtained from Monte Carlo simulations. The rate of false counts can be in general expressed as
| (5) |
The fraction is the Poissonian probability of decays occurring within the resolving time , and is the probability that at least one triplet of photons will be detected and falsely accepted as true event. Practically, it is sufficient to consider just the first two terms in (5), and then the false counting rate becomes
| (6) |
The two terms in the curly brackets correspond to two and three two-photon annihilations occurring within the resolving time. is the probability to hit the scanner by a single photon (geometric factor). We assumed that the directions of photons are uncorrelated, which is not quite true, but works well as an approximation. Even when three detected accidental photons fulfil condition (2) , when inserted into (LABEL:momcons) most of them would either give no real solution, or generate a point outside the object. is the fraction of events yielding a point within the object, contributing to image noise. For our scanners and phantoms , the single photon geometric factors =0.287 for the human and =0.781 for the small animal scanner.


The rates of random events (figures 9 and 10) remain very low compared to true even at high activities, so they do not contribute significantly to image noise. This signal-to-noise ratio is, however, sensitive to the detection efficiency of the detectors and may worsen significantly for photopeak efficiencies lower than those assumed.
4.3 Examples of images and detectability of lesions
In order to generate examples of images we used the human scanner with the phantom described in the previous section and added lesions in the form of spheres of variable size, lined up across the centre of the phantom as shown in figure 11 (a). We define the lesion contrast as , where is the density of registered counts in the lesion, and that in the background. In figure 11 a few examples of images are shown.
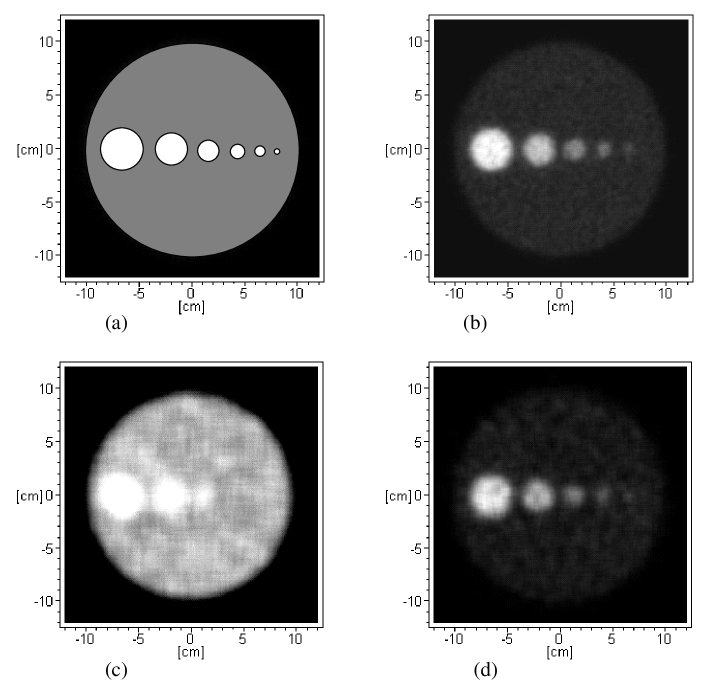
Image (b) corresponds to the maximum counting rate for the human scanner of about 1000 cps (cf. figure 9) scanned for about 20 min. At contrast the 1 cm lesion is clearly visible, however the one of 0.5 cm diameter is not. When contrast drops to (c), the detectability of lesions deteriorates significantly. On the other hand the 1 cm lesion is still visible even if the count statistics is reduced by almost order of magnitude (d).
Detectability of lesions clearly depends on their size and contrast. Let us examine this dependence to assess the limits of three-photon imaging. In order for a lesion to be distinguishable against the background its total number of points (counts) above the background level, reduced by its possible statistical fluctuations, should be significantly higher than the average statistical fluctuation of the number of points in a background region of the same size as the lesion. This can be expressed as
| (7) |
is the original volume of the lesion without the partial volume effect. In the image, however, the blurring due to finite resolution of the scanner has to be taken into account; the blurred lesion volume is denoted by . The parameters and specify what “significantly higher” actually mean, in other words they control the confidence level of our assessment. Here we assume = = 2, which corresponds roughly to 95% confidence level. For a spherical lesion equation (7) takes the form
| (8) |
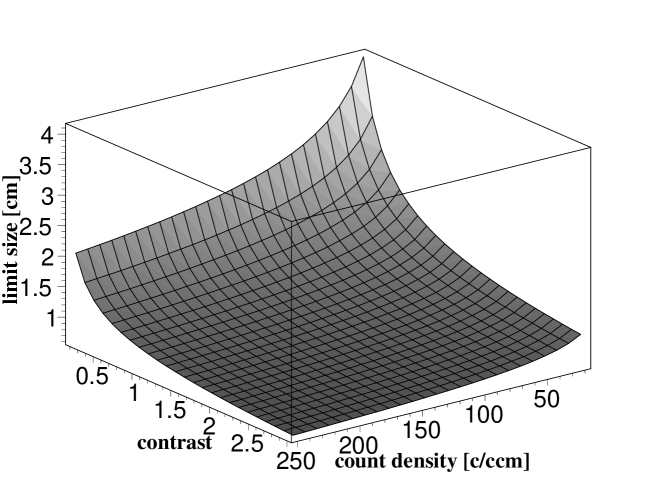
where is the original diameter of the lesion and is the FWHM spatial resolution of the scanner. Equation (8) is polynomial and can be solved numerically for . In the absence of scanner blurring () it can be reduced to the formula
| (9) |
The numerical solution of (8) for our model human scanner ( cm) is plotted in figure 12.
The formula (8) works quite well for the simulated images. The calculated minimal detectable sizes of lesions for the images in figure 11 are: (b) 6.2 mm, (c) 20.8 mm, (d) 10 mm. For the model small animal scanner (spatial resolution 0.32 cm FWHM) with 2 cm water phantom (section 4.2) of activity 50 MBq the counting rate can reach over 50 kcps (see figure 10). With the much smaller phantom the count density is about c/cm3 in a 20 min. scan. Then sub-millimeter detectability is achieved at contrasts 0.7. At lesions as small as 0.6 mm should be visible.
The formula (8) allows to fine tune the trade-off between the resolution and number of counts represented by the relation shown in figure 8. Depending on the contrast of lesions, it may be of advantage to narrow the window, losing some of the counts (decrease ), but improving the spatial resolution (decrease ) to achieve the best detectability.
4.4 Attenuation
In imaging we unfortunately do not have the advantage of relatively easy attenuation correction as in conventional PET, where the attenuation along any line of response is constant, independent of the site of annihilation and can be measured directly by a transmission scan. For each point in an object and each particular combination of energies and emission directions of the three photons the attenuation factor will be different. The problem of attenuation correction is therefore rather complex, similar to for example scatter correction in conventional PET or SPECT. Using Monte Carlo simulations and having the map of attenuation coefficients for the object one can compute a map of attenuation factors for each point of the object averaged over the free parameters of emission. The results for our water phantoms are shown in figure 13.

In general attenuation for photons is higher than for because of lower energies and longer effective paths. It is also strongly nonuniform, being significantly higher for points deep inside the body.
5 Outstanding questions and directions of future studies
In this paper we concentrated on the image quality and performance of the new PET modality, leaving for future studies the question of biological and clinical significance of the information extracted from the three-photon annihilations. Precise measurements of yields in biological samples are necessary to determine its variability in a living organism, as well as sensitivity to parameters like the level of oxygen. Our results will allow to assess whether the new information can be extracted by PET systems based for example on CdZnTe detectors.
In our simulations we neglected the effect of finite positron range and non-zero residual momentum of the annihilating positron-electron pair. Both effects add extra blurring of magnitude similar to that for the two-photon case. That is in most cases negligible in comparison to the effects of detector size and energy resolution.
In our estimation of counting rates we did not consider the contribution of activity outside the field of view, which is important in conventional clinical PET. It would add extra random counts. However, our calculations show (section 4.2) that for the assumed scanner parameters the rate of random events is at least 3 orders of magnitude lower than that of true . Extra activity contributing to randoms would mean a shift on the randoms curves in figures 9 and 10 along the activity axis typically by a factor of 2-4. It means that the random rate would still remain very small compared to the true and would not pose a real problem. The above is true for pure positron emitters, which are most commonly used in PET. If there are nuclear gamma photons accompanying positron emissions, the rate of triple coincidences and false events may increase significantly, although still most of them could be rejected due to the energy conservation condition (LABEL:momcons).
The limitations of imaging seem to be in the first place the low number of counts, especially with high attenuation (large patients, areas located deep in the body), and the spatial resolution limited mainly by the energy resolution of detectors. While one can not realistically do much to increase the counting rates achieved in our model scanners (section 4.2), the spatial resolution leaves plenty of room for improvement. One way would be to rectify the energy resolution of the detectors (see section 4.1.1). Although the technology of room temperature semiconductor detectors is making constant progress, we probably can not expect a significant further improvement in energy resolution compared to that assumed in our simulations. An alternative is to use e.g. HP-Ge detectors offering resolutions of the order of 0.3 %. However, the other properties, and in particular the need for cryogenic cooling and cost make the choice rather impractical at least for clinical PET. Their use for a dedicated small animal PET system is, however, not excluded (Philips et al2002). A much more feasible way to improve the resolution of imaging is through the reconstruction process. In this paper we used the simplest possible procedure by solving equations (LABEL:momcons) for each registered event and producing a “set of points” image. The easiest way to improve resolution is by making use of the energy dependence of the positioning error (figure 7) as indicated in section 4.1.5. Another possibility is to account for the unique non-symmetric shape of the point spread function which can be calculated for each combination of detected photons. It could be incorporated in the framework of a statistical iterative reconstruction method like ML-EM (Shepp and Vardi 1982), known to produce superior quality images, however, for the price of significant complexity and computation time.
6 Conclusions
We have studied thoroughly the main characteristics of three-photon imaging in positron emission tomography. Clearly, it is one of the directions for future development of this rapidly expanding imaging technique. The main prerequisite for the new modality to be implemented is a scanner based on high energy resolution detectors, like CdZnTe. This is no longer a futuristic dream. Several groups and manufacturers’ laboratories are working on such devices, and probably within the next few years we will see first prototypes in practical use.
Our simulations show that for typical scanner configurations, with currently available CdZnTe detector properties, good quality annihilation images can be obtained. They do not match those from conventional PET in terms of spatial resolution and statistics, however they may contain distinct new information for example about the oxygenation of tissues. It could be obtained alongside any routine scan, e.g. FDG PET, using photons that are currently wasted, so it is certainly worth further exploration.
References
References
- [1]
- [2] [] Charlton M and Humberston J W 2001 Positron Physics (Cambridge, UK: Cambridge Univ. Press)
- [3]
- [4] [] Cooper A M, Laidlaw G J and Hogg B G 1967 Oxygen quenching of positron lifetimes in liquids J. Chem. Phys. 46 2441-2442
- [5]
- [6] [] De Benedetti S, and Siegel R 1954 The three-photon annihilation of positrons and electrons Phys. Rev. 94 955-959
- [7]
- [8] [] Chang T and Tang H 1985 Gamma-ray energy spectrum from orthopositronium three-gamma decay Phys. Lett. B 157B 357-360
- [9]
- [10] [] Drezet A, Monnet O, Montémont G, Rustique J, Sanchez G and Verger L 2004 CdZnTe detectors for the positron emission tomographic imaging of small animals IEEE Nucl. Sci. Symp. Conf. Record R11-67
- [11]
- [12] [] Hopkins B and Zerda T W 1990 Oxygen quenching of positronium in silica gels Phys. Lett.A 45 141-145
- [13]
- [14] [] Kacperski K, Spyrou N M and Smith F A 2004 Three-gamma annihilation imaging in positron emission tomography IEEE Trans. Med. Im. M9-451
- [15]
- [16] [] Kacperski K and Spyrou N M 2004 Three-Gamma Annihilations as a New Modality in PET IEEE Nucl. Sci. Symp. Conf. Record
- [17]
- [18] [] Kakimoto M, Hyodo T and Chang T B 1990 Conversion of ortho-positronium in low-density oxygen gas J. Phys. B: At. Mol. Opt. Phys. 23 589-597
- [19]
- [20] [] Klobuchar R L and Karol P J 1980 J. Chem. Phys. 84 483
- [21]
- [22] [] Machulla H J 1999 Imaging of hypoxia. Tracer developments. (Kluwer Academic Publishers)
- [23]
- [24] [] Moses W W, Derenzo S E and Budinger T F 1994 PET detector modules based on novel detector technologies Nucl. Inst. Meth. A 353 189-194
- [25]
- [26] [] Moss C E, Ianakiev K D, Prettyman T H, Smith M K and Sweet M R 2001 Multi-element, large-volume CdZnTe detectors Nucl. Inst. Meth. A 458 455-60
- [27]
- [28] [] Nemirovsky Y, Asa G, Gorelik J and Peyser A, 2001 Recent progress in n-type CdZnTe arrays for gamma-ray spectroscopy Nucl. Inst. Meth. A 458 325-333
- [29]
- [30] [] Ore A and Powell J L 1949 Three-photon annihilation of an electron-positron pair Phys. Rev. 75 1696-1699
- [31]
- [32] [] Philips B F, Kroeger J D, Kurfess J D, Johnson W N, Wulf E A and Novikova E I 2002 Small animal PET imaging with germanium strip detectors IEEE Nucl. Sci. Symp. Conf. Rec. 3 1438-1442
- [33]
- [34] [] Redus R, Huber A, Pantazis J, Pantazis T, Takahashi T and Woolf S 2004 Multielement CdTe stack detectors for gamma-ray spectroscopy IEEE Trans. Nucl. Sci. 51 2386–2394
- [35]
- [36] [] Scheiber C and Gaikos G C 2001 Medical applications of CdTe and CdZnTe detectors Nucl.Inst. Meth. A 458 12-25
- [37]
- [38] [] Schepp L A and Vardi Y 1982 Maximum likelihood reconstruction for emission tomography IEEE Trans. Med. Im. MI-1 113–122
- [39]
- [40] [] Stickel J R and Cherry S R 2005 High-resolution PET detector design: modelling components of intrinsic spatial resolution Phys. Med. Biol. 50 179-195
- [41]
- [42] [] Verger L, Drezet A, Gros d’Aillon, Mestais C, Monnet O, Montémont G, Dierre and Peyret O 2004 New perspectives in gamma-ray imaging with CdZnTe/CdTe IEEE Nucl. Sci. Symp. Conf. Record JRM1-1
- [43]
- [44] []
- [45]