Analysis of a Material Phase Shifting Element in an Atom Interferometer
Abstract
The interaction of Na atoms with a surface was probed by inserting a nanofabricated material grating into one arm of an atom interferometer (IFM). This technique permits a direct measurement of the change in phase and coherence of matter waves as they pass within 25 nm of the grating bar surface. The practical concerns and challenges of making such a measurement are discussed here. Interference of spurious diffraction orders, IFM path overlap, and the partial obscuration of IFM beams are all important aspects of this experiment. The systematic effects that contribute to the measured phase shift and contrast are discussed.
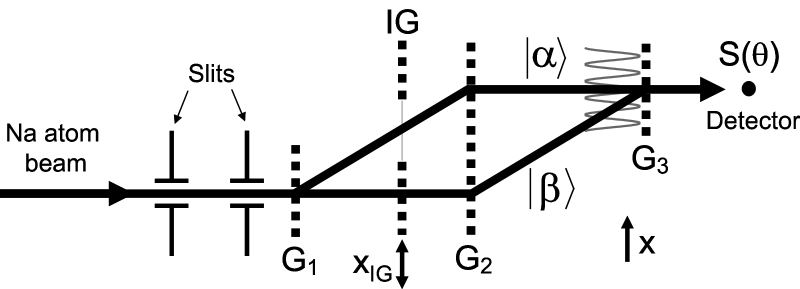
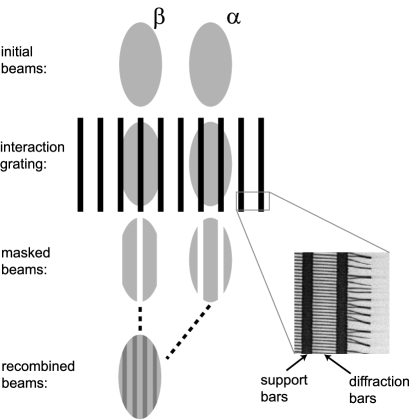
Atomic diffraction from material grating structures [1] has been used as a tool to measure atom-surface interactions for noble gases [2] and alkali atoms [3, 4]. In these experiments the van der Waals (vdW) interaction [5] changed the relative intensities of the diffraction orders. More recently the atom wave phase shift induced by these grating structures111The subscript of specifies this variable as the phase of the zeroth diffraction order induced by the IG. For reasons discussed in [6] only the zeroth diffraction order leads to significant interference contrast. was measured directly using a sodium atom beam interferometer (IFM) [6]. The experimental setup is shown in Fig. 1. An interaction grating (IG), comprised of an array of 50 nm wide channels, is inserted into one arm of the IFM. The vdW interaction between the sodium atoms and IG causes a phase shift of about radians. A number of systematic effects need to be understood before reporting this phase shift induced by the vdW interaction. This paper describes how the measured phase shift and contrast in [6] are influenced by these systematic effects and suggests some physical mechanisms for them.
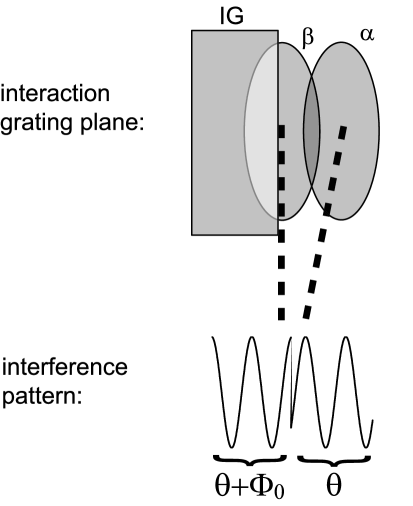
In general there is a non-trivial relationship between the measured phase shift and induced phase shift , when the IFM paths are partially obscured by a phase shifting element. Therefore, care should be taken when interpreting the phase shift data. This notion of partial obscuration is shown in Fig. 3, which illustrates how the interference pattern can have different phases in different regions of space. The detected interference signal can be written as the average flux transmitted through each grating window of in Fig. 1
| (1) | |||||
where the contrast (), phase (), and average intensity () of the interference pattern are assumed to be constant over each grating window of . The grating window size and period in Eqn. 1 refer to grating .222A more complete discussion of the grating structures and other experiments in which they are used can be found in a separate entry of the CAMS conference proceedings by A. D. Cronin. The variable accounts for the position of relative to the interference pattern phase . Equation 1 establishes a connection between the spatial interference pattern, shown just before in Fig. 1, and the signal which is actually measured.
From Eqn. 1 it is clear that the detector signal is a sum of cosines with varying phases and intensities . When determining the measured phase of the signal it is only the relative phase and intensity of the terms in Eqn. 1 that are important. For the case of a half-plane phase shifting element (e. g. the IG in Fig. 3) the form for the detector signal implied by Eqn. 1 would be
| (2) |
where constant offsets in the signal have been ignored. The intensity of the detector signal can then be given by
| (3) |
and the phase by
| (4) |
where and are the relative intensities of the unshifted and shifted interference patterns. The resulting phase and contrast measured by can also be found for more complicated interference patterns by using Eqn. 2 in an iterative fashion.
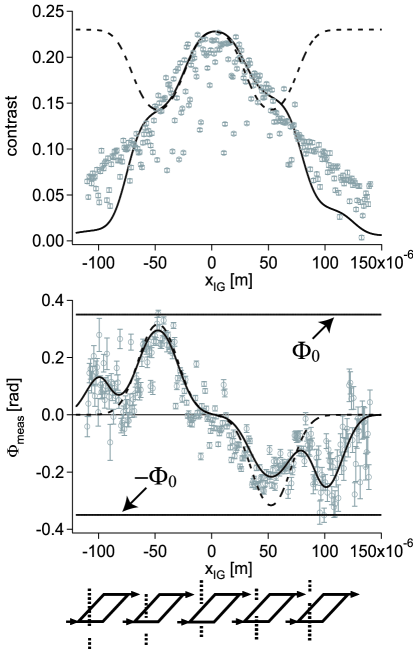
Figure 3 shows the measured phase and contrast of when the interaction grating is placed at a given location inside the atom IFM. All phase measurements are relative to the situation where the IG is out of the IFM, and this reference phase was regularly measured. As one would expect the measured phase reaches a local extremum when the IG is completely obscuring one of the IFM paths. When the IG begins to obscure both of the IFM paths one would presume that the measured phase should return to zero again. However, the data deviate from this prediction. Likewise, the contrast should decrease when the IG attenuates one of the IFM paths, but then return to its nominal value when both paths are obscured. In addition, the beam overlap shown in Fig. 3 will tend to make the measured phase smaller than the induced phase because the overlapped portion will have no relative phase difference. These expectations are made quantitative by the use of Eqn. 2 and shown as the dashed line in Fig. 3. There are two striking failures of this naive prediction when compared to the experimental data: the appearance of a phase shift and significant loss of contrast when both IFM paths are obscured by the IG.
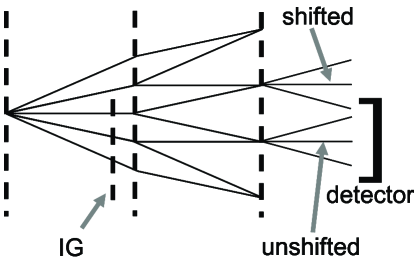
The appearance of the extra phase features can be understood by looking more carefully at the details of the IFM. Our IFM is formed by the zeroth and first order diffracted beams of the gratings and in Fig. 1. In reality there are more than just two paths that can interfere because of the other diffraction orders. This situation is depicted in Fig. 5. These additional interfering paths allow for the possibility of the IG to obscure both of the primary interferometer paths, while only obscuring one of the secondary interferometer paths. When this notion is combined with the finite size of the detector and diffraction caused by the third grating , a clear mechanism for the extra phase features is found.
A likely explanation for the unexpected reduction in contrast, when both interferometer paths are obscured by the IG, is shown in Fig. 5. The inset SEM image in Fig. 5 shows how the diffraction bars (which cause the atom-surface phase shift) are stabilized by much more widely spaced support bars. The support bars will imprint a spatial amplitude modulation on the two beams, shifted in space by different amounts with respect to the center of the beams. When the beams are recombined the region of overlap is effectively reduced, leading to an overall reduction in contrast. While there are some near-field diffractive effects caused by the support bars [7], numerical simulations have shown that the effective mask picture in Fig. 5 is still appropriate when considering the influence on . It is important to note that this effect only reduces the contrast for an IFM that has both paths obscured by the IG. This also explains the relative prominence of the extra phase features, since the contrast of the primary interferometer is reduced compared to the secondary one as a result of this effect.
When the previously discussed systematic effects are incorporated into the coefficients and in Eqn. 2, much better agreement with the data is achieved. The solid line in Fig. 3 shows the prediction of a model which includes the influence of other interfering orders and the support bars. It is quite satisfying to see that the behavior of the measured contrast and phase is now understood even when the IG is blocking both of the primary interferometer paths. One can also see that the asymmetry of the phase profile is reproduced.
In conclusion the measured phase and contrast as a function of IG position are now understood to be influenced by a number of systematic effects. The primary physical mechanisms for the systematic effects are beam overlap, interference of additional diffraction orders, and an effective masking by the IG support bars. The inclusion of systematic effects leads to a relationship between the phase shift that is measured () with our experiment and that which is actually induced () by the IG. This allows us to make quantitative comparisons to predictions for the phase shift and in turn the vdW coefficient [6].
This research was supported by grants from Research Corporation and the National Science Foundation.
References
References
- [1] T. A. Savas, M. L. Schattenburg, J. M. Carter, and H. I. Smith. Large-area achromatic interferometric lithography for 100 nm period gratings and grids. J. Vac. Sci. Tech. B, 14(6):4167, 1996.
- [2] R. E. Grisenti, W. Schollkopf, J. P. Toennies, G. C. Hegerfeldt, and T. Kohler. Determination of atom-surface van der Waals potentials from transmission-grating diffraction intensities. Phys. Rev. Lett., 83(9):1755, 1999.
- [3] A. D. Cronin and J. D. Perreault. Phasor analysis of atom diffraction from a rotated material grating. Phys. Rev. A, 70:043607, 2004.
- [4] J. D. Perreault, A. D. Cronin, and T. A. Savas. Using atomic diffraction of Na from material gratings to measure atom-surface interactions. Phys. Rev. A, 71:053612, 2005.
- [5] P. W. Milonni. The Quantum Vacuum. Academic Press, 1994.
- [6] J. D. Perreault and A. D. Cronin. Observation of atom wave phase shifts induced by van der Waals atom-surface interactions. arXiv:physics/0505160, 2005.
- [7] J. W. Goodman. Introduction to Fourier Optics. McGraw-Hill, 1996.